Transcription
Advisor Services2021 RIABenchmarking StudyJuly 2021Media contact:Meredith RichardCharles Schwab646.343.7419Meredith.Richard@schwab.com
2021 HighlightsA challenging year becomes a catalyst forgrowthSchwab’s RIA Benchmarking Study is theleading study in the industry —1,340 advisory firms, representing over 1.5 trillion in AUM, participated this year.The following report is organizedaccording to Schwab’s Guiding Principlesfor Advisory Firm Success, a framework tohelp advisors address the complexities ofgrowing their firms and creating enduringbusinesses.“2020 created an atmosphere of innovationthat helped advisors reimagine how theyengage with clients, prospects, and staff.These experiences will help advisors thrive asthe RIA industry continues to grow.”Lisa SalviManaging DirectorBusiness Consulting & Education2021 RIA Benchmarking Study from Charles Schwab Firms adapted to the challenging environment and achieved successby using a variety of innovative strategies to support staff, engageclients, and drive new business results. Given the environment, firms experienced remarkable growth in 2020: AUM up 14.5%, revenue up 7.5%, and number of clients up4.7% for all firms, at the median. Asset growth rates were higher than the 5-year compoundannual growth rates over the period 2016 through 2020. Firms adapted quickly to new business practices in 2020: Strengthening client relationships virtually. Approaching business development differently. Leveraging opportunities for productivity gains. This year’s focus section centered around new client growth andtactics firms used to propel client acquisition during the pandemic. RIAs had success with digital business development, withover 70% of firms generating leads from their websites, virtualprospect events, and online advertising. 68% of all advisors met or exceeded their client growth goals.Top Performing Firms did even better, with 81% exceeding ormeeting their new client goals.Looking aheadThis icon identifies insights from the studythat highlight the value of key managementstrategies that can help firms plan ahead.1
2021 RIA Benchmarking Study from Charles Schwab2
2021 RIA Benchmarking Study from Charles Schwab3
PlanningAdvisors continue to prioritize client acquisition, with leveragingdigital channels and recruiting new staff rising in importance.RankTop strategic initiatives20212020Acquire new clients through client referrals11Recruit staff to increase firm's skill set/capacity25Enhance strategic planning and execution34Acquire new clients through business referrals42Acquire new clients through digital channels510Improve productivity with new technology63Results for all firms with 250 million or more in AUM that selected initiative as a top 3 priority. 2021 RIA Benchmarking Study from Charles Schwab, fielded January to March 2021. Study contains self-reported data from1,340 firms. Participant firms represent various sizes and business models categorized into 7 peer groups by AUM.2021 RIA Benchmarking Study from Charles Schwab4
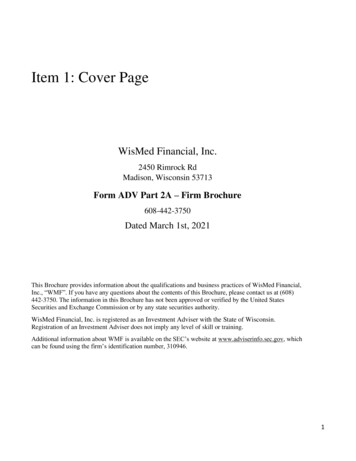
PlanningDespite an unprecedented year, RIA firms saw continued growth,indicating a positive trajectory.Assets under managementIn millionsRevenueClientsIn thousands 3,793 791383 2,578 1,860 439228 14.5% 7.5% 4.7% 12.5% CAGR1 8.0% CAGR1 5.2% CAGR1 19720151298in 20202020in 2020202520152020in 20202025201520202025Median compound annual growth rate (CAGR) over the five-year period from year-end 2015 through 2020 for all firms with 25 million or more in AUM.Median results for all firms with 25 million or more in AUM. Past performance is not an indicator of future results. 2021 RIA Benchmarking Study from Charles Schwab, fielded January to March 2021. Study containsself-reported data from 1,340 firms. Participant firms represent various sizes and business models categorized into 7 peer groups by AUM.2021 RIA Benchmarking Study from Charles Schwab5
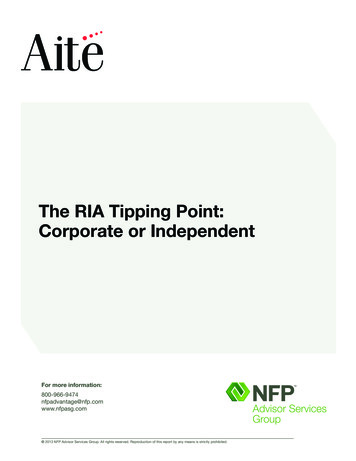
PlanningLast year’s AUM growth rate exceeded the 5-year annualizedgrowth rates for all peer groups.Assets under management (AUM)In millionsMedian results by peer group5-Year AUM CAGR (year-end 2015 through 2020) 12.8% CAGR 13.2%in 2020 4,2632015 (year-end)2020 (year-end) 12.8% CAGR 13.1% 10.2% CAGR 12.0% CAGR 12.6% CAGR 12.5% CAGR 175 100M– 250M 191 350 250M– 500M 2,073 1,492in 2020in 2020 864in 2020in 2020 90 10.8% 14.1% 14.3% 15.1%in 2020 349 621 500M– 750M 787 537 750M– 1B 1B– 2.5BOver 2.5BPast performance is not an indicator of future results. 2021 RIA Benchmarking Study from Charles Schwab, fielded January to March 2021. Study contains self-reported data from 1,340 firms. Participant firms representvarious sizes and business models categorized into 7 peer groups by AUM.2021 RIA Benchmarking Study from Charles Schwab6
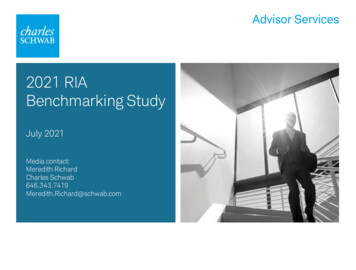
PlanningFive-year revenue growth remained solid, supported bystrong AUM performance in the prior year.RevenueIn thousandsMedian results by peer group5-Year revenue CAGR (year-end 2015 through 2020) 7.1% CAGR2015 (year-end) 22,3972020 (year-end) 7.9% CAGR 8.1% CAGR 7.5% CAGR 13,164 6.3% CAGR 7,849 8.8% CAGR 4,832 700 1,135 100M– 250M 1,310 2,130 250M– 500M 2,265 3,414 500M– 750M 4,820 3,157 750M– 1B 1B– 2.5BOver 2.5BPast performance is not an indicator of future results. 2021 RIA Benchmarking Study from Charles Schwab, fielded January to March 2021. Study contains self-reported data from 1,340 firms. Participant firms representvarious sizes and business models categorized into 7 peer groups by AUM.2021 RIA Benchmarking Study from Charles Schwab7
PlanningGrowth in clients remained consistent even as firms relied onvirtual interactions to engage prospects and build relationships.Total clientsMedian results by peer group 4.7M2020 Average assets per client ( M)2015 (year-end)2020 (year-end)1,449 3.0M986722 2.4M 1.9M 1.6M440 1.2M114161 100M– 250M183255 250M– 500M260344 500M– 750M461344 750M– 1B 1B– 2.5BOver 2.5BPast performance is not an indicator of future results. 2021 RIA Benchmarking Study from Charles Schwab, fielded January to March 2021. Study contains self-reported data from 1,340 firms. Participant firms representvarious sizes and business models categorized into 7 peer groups by AUM.2021 RIA Benchmarking Study from Charles Schwab8
PlanningTop Performing Firms demonstrate more robust AUM growththan other firms.Median AUM Growth26.0%26.2%Top Performing FirmsAll other 7201820192020Top Performing Firms are those that rank in the top 20% of the Firm Performance Index. The index evaluates all firms in the study according to 15 metrics to arrive at a holistic assessment of each firm's performance acrosskey business areas.Past performance is not an indicator of future results. 2021 RIA Benchmarking Study from Charles Schwab, fielded January to March 2021. Study contains self-reported data from 1,340 firms. Participant firms representvarious sizes and business models categorized into 7 peer groups by AUM.2021 RIA Benchmarking Study from Charles Schwab9
Looking aheadPlanningOrganic growth reflects how clients and prospects respond to afirm’s value proposition, client experience, and strategy.Contribution of net organic asset growth to AUM growthNet organic growthAUM 7.0%4.9%201911.4%2020Firms under 250M20194.7%2020Firms over 250M20192020Top Performing FirmsTop Performing Firms are those that rank in the top 20% of the Firm Performance Index. The index evaluates all firms in the study according to 15 metrics to arrive at a holistic assessment of each firm's performance across keybusiness areas.Median results. Past performance is not an indicator of future results. 2021 RIA Benchmarking Study from Charles Schwab, fielded January to March 2021. Study contains self-reported data from 1,340 firms. Participant firmsrepresent various sizes and business models categorized into 7 peer groups by AUM.2021 RIA Benchmarking Study from Charles Schwab10
Looking aheadPlanningStrategic and succession plans support firm performanceand endurance, helping firms adapt to change.Firms with written strategic planFirms with written succession plan71%73%63%53%60%41%Firmsunder 250MFirmsover 250MTop PerformingFirmsFirmsunder 250MFirmsover 250MTop PerformingFirmsTop Performing Firms are those that rank in the top 20% of the Firm Performance Index. The index evaluates all firms in the study according to 15 metrics to arrive at a holistic assessment of each firm's performance acrosskey business areas.Past performance is not an indicator of future results. 2021 RIA Benchmarking Study from Charles Schwab, fielded January to March 2021. Study contains self-reported data from 1,340 firms. Participant firms representvarious sizes and business models categorized into 7 peer groups by AUM.2021 RIA Benchmarking Study from Charles Schwab11
2021 RIA Benchmarking Study from Charles Schwab12
Looking aheadValueClient retention remains high, and net assets from existingclients showed a strong uptick in 2020.Client retention in 2020for firms across the studyNet assets from existing clients(excluding investment performance) increased in 202097% 78% 67% 23%Firmsunder 250MFirmsover 250MTop PerformingFirmsMedian results. Existing client net flows include assets gained and lost from existing clients. Past performance is not an indicator of future results. 2021 RIA Benchmarking Study from Charles Schwab, fielded January toMarch 2021. Study contains self-reported data from 1,340 firms. Participant firms represent various sizes and business models categorized into 7 peer groups by AUM.2021 RIA Benchmarking Study from Charles Schwab13
ValueExisting clients brought more net new assets to RIAs in2020 than in the past five years.Firms under 250MNet assets from existing clients ( M)In millionsFirms over 250MNet assets from existing clients ( M)In millions 10.0 2.5 2.0 1.02016 7.0 2.0 6.0 1.020172018 4.5 3.72019202020162017201820192020Median results for all firms with less than 250 million in AUM and firms with 250 million or more in AUM. Past performance is not an indicator of future results. 2021 RIA Benchmarking Study from Charles Schwab,fielded January to March 2021. Study contains self-reported data from 1,340 firms. Participant firms represent various sizes and business models categorized into 7 peer groups by AUM.2021 RIA Benchmarking Study from Charles Schwab14
Looking aheadValueDocumenting an ideal client persona and client valueproposition helps RIAs refine their offer and drive referrals.68%Top Performing FirmsFirms with a documented idealclient persona/profile (ICP)59%Firms over 250MFirms under 250M47%70%Top Performing FirmsFirms with a documentedclient value proposition (CVP)59%Firms over 250MFirms under 250M46%Top Performing Firms are those that rank in the top 20% of the Firm Performance Index. The index evaluates all firms in the study according to 15 metrics to arrive at a holistic assessment of each firm's performance across keybusiness areas.Past performance is not an indicator of future results. 2021 RIA Benchmarking Study from Charles Schwab, fielded January to March 2021. Study contains self-reported data from 1,340 firms. Participant firms represent varioussizes and business models categorized into 7 peer groups by AUM.2021 RIA Benchmarking Study from Charles Schwab15
ValueFirms with written marketing plans, ideal client personas, andclient value propositions attracted more new clients and assets.50%More newclients in 202062%More new clientassets in 2020Median results for all firms with 250 million or more in AUM.Past performance is not an indicator of future results. 2021 RIA Benchmarking Study from Charles Schwab, fielded January to March 2021. Study contains self-reported data from 1,340 firms. Participant firms representvarious sizes and business models categorized into 7 peer groups by AUM.2021 RIA Benchmarking Study from Charles Schwab16
Looking aheadValueTop Performing Firms are more likely to have a documentedmarketing plan and spend more to execute their plans.53%Top Performing FirmsFirms with a documentedmarketing plan47%Firms over 250MFirms under 250M30%2.1%Top Performing FirmsAverage marketing andbusiness development spendas a percent of revenueFirms over 250M1.6%Firms under 250M1.6%Top Performing Firms are those that rank in the top 20% of the Firm Performance Index. The index evaluates all firms in the study according to 15 metrics to arrive at a holistic assessment of each firm's performance acrosskey business areas.Past performance is not an indicator of future results. 2021 RIA Benchmarking Study from Charles Schwab, fielded January to March 2021. Study contains self-reported data from 1,340 firms. Participant firms representvarious sizes and business models categorized into 7 peer groups by AUM.2021 RIA Benchmarking Study from Charles Schwab17
Looking aheadValueTop Performing Firms are also more efficient with their businessdevelopment, requiring less staff time to acquire new clients.Top Performing FirmsAll other firmsAnnual hours spent toacquire a new clientCost of staff time pernew client 4,2174538Cost of staff time pernew 1 million in assets 3,350 3,170 2,520Median results for Top Performing Firms and all other firms. Top Performing Firms are those that rank in the top 20% of the Firm Performance Index. The index evaluates all firms in the study according to 15 metrics toarrive at a holistic assessment of each firm's performance across key business areas.Past performance is not an indicator of future results. 2021 RIA Benchmarking Study from Charles Schwab, fielded January to March 2021. Study contains self-reported data from 1,340 firms. Participant firms representvarious sizes and business models categorized into 7 peer groups by AUM.2021 RIA Benchmarking Study from Charles Schwab18
Looking aheadValueSpecialized services have increasingly become part of a firm’soffering.Firms offering 0Tax planningand haritableplanningFamilyeducationResults from the 2017 and 2021 RIA Benchmarking Study from Charles Schwab. Results for all firms with 250 million or more in AUM.Past performance is not an indicator of future results. 2021 RIA Benchmarking Study from Charles Schwab, fielded January to March 2021. Study contains self-reported data from 1,340 firms. Participant firms representvarious sizes and business models categorized into 7 peer groups by AUM.2021 RIA Benchmarking Study from Charles Schwab19
2021 RIA Benchmarking Study from Charles Schwab20
Looking aheadOperationsAdvisors leveraged opportunities for productivity gains duringthe pandemic.AUM perprofessional ( M)Clients perprofessionalAnnual hoursper client forclient serviceAnnual hoursper client foroperations &administration 1012020 992019572020532019312020342019202020191617Top Performing FirmsManage 59 clients perprofessionalSpent 12 hours per client foroperations and administration,25% less time than firms withover 250 million in AUMResults from the 2020 and 2021 RIA Benchmarking Study from Charles Schwab. Median results for all firms with 250 million or more in AUM.Past performance is not an indicator of future results. 2021 RIA Benchmarking Study from Charles Schwab, fielded January to March 2021. Study contains self-reported data from 1,340 firms. Participant firms representvarious sizes and business models categorized into 7 peer groups by AUM.2021 RIA Benchmarking Study from Charles Schwab21
Looking aheadOperationsMoving forward, firms anticipate engaging with someclients virtually even when in-person interactions resume.Percent of clients engaging with staff completely virtually90%during Q1 202150%when COVID-relatedrestrictions are liftedMedian results for all firms with 25 million or more in AUM. Past performance is not an indicator of future results. 2021 RIA Benchmarking Study from Charles Schwab, fielded January to March 2021. Study containsself-reported data from 1,340 firms. Participant firms represent various sizes and business models categorized into 7 peer groups by AUM.2021 RIA Benchmarking Study from Charles Schwab22
Looking aheadOperationsTechnology was essential for client connections and operationsduring the pandemic.Firms using technology systems2016Technology systems selected as havinggreatest impact or ROI in lio managementsystemClient relationshipmanagement (CRM)systemFinancial planningsystemPortal to shareTrading and rebalancing Document managementinformation with clientssystemsystemResults from the 2017 and 2021 RIA Benchmarking Study from Charles Schwab. Median results for all firms with 250 million or more in AUM.Past performance is not an indicator of future results. 2021 RIA Benchmarking Study from Charles Schwab, fielded January to March 2021. Study contains self-reported data from 1,340 firms. Participant firms representvarious sizes and business models categorized into 7 peer groups by AUM.2021 RIA Benchmarking Study from Charles Schwab23
Looking aheadOperationsLeveraging CRM systems can help serve clients moreconsistently and streamline communications.Firms with three or more data sourcesor systems integrated with CRMFirms with standardized workflowswithin CRM for over 50% of tasks54%43%32%31%Firmsunder 250M45%44%Firmsover 250MTop PerformingFirmsFirmsunder 250MFirmsover 250MTop PerformingFirmsTop Performing Firms are those that rank in the top 20% of the Firm Performance Index. The index evaluates all firms in the study according to 15 metrics to arrive at a holistic assessment of each firm's performanceacross key business areas.Past performance is not an indicator of future results. 2021 RIA Benchmarking Study from Charles Schwab, fielded January to March 2021. Study contains self-reported data from 1,340 firms. Participant firmsrepresent various sizes and business models categorized into 7 peer groups by AUM.2021 RIA Benchmarking Study from Charles Schwab24
Looking aheadOperationsTracking prospecting results and refining tactics helps ensurefirms are allocating their marketing resources effectively.Firms that track metrics to measure progress towards new client growthPercent of leads closed1Top Performing FirmsAll other firmsTOP PERFORMING FIRMS60%75%60%60%ALL OTHER FIRMS57%53%55%49%48%42%41%27%Source ofinquiriesGeneral inquiriesfrom prospectsQualifiedleadsStatus of prospectsin sales funnelLeadconversion rate1 Median results for firms that track their lead conversion rate.Results for Top Performing Firms and all other firms. Top Performing Firms are those that rank in the top 20% of the Firm Performance Index. The index evaluates all firms in the study according to 15 metrics to arrive at aholistic assessment of each firm's performance across key business areas.Past performance is not an indicator of future results. 2021 RIA Benchmarking Study from Charles Schwab, fielded January to March 2021. Study contains self-reported data from 1,340 firms. Participant firms representvarious sizes and business models categorized into 7 peer groups by AUM.2021 RIA Benchmarking Study from Charles Schwab25
Looking aheadOperationsAdvisors are taking key steps to strengthen their cybersecurityprograms, protecting their clients and firms.Firms with cybersecurity activity bersecurityinsuranceEmployeetrainingResults for all firms with 250 million or more in AUM. Past performance is not an indicator of future results. 2021 RIA Benchmarking Study from Charles Schwab, fielded January to March 2021. Study contains selfreported data from 1,340 firms. Participant firms represent various sizes and business models categorized into 7 peer groups by AUM.2021 RIA Benchmarking Study from Charles Schwab26
OperationsProfit margins remained robust for firms of all sizes in 2020.Standardized operating income marginMedian results by peer group (AUM)33.3%27.5%28.1% 100M– 250M 250M– 500M32.2%27.7% 500M– 750M 750M– 1B27.5% 1B– 2.5BOver 2.5BPast performance is not an indicator of future results. 2021 RIA Benchmarking Study from Charles Schwab, fielded January to March 2021. Study contains self-reported data from 1,340 firms. Participant firms representvarious sizes and business models categorized into 7 peer groups by AUM.2021 RIA Benchmarking Study from Charles Schwab27
2021 RIA Benchmarking Study from Charles Schwab28
BrandDespite the challenges of 2020, firms succeeded in achievingtheir new client growth goals.68%of all firms in the studymet or exceeded their newclient growth goals81%of Top Performing Firmsmet or exceeded their newclient growth goalsTop Performing Firms are those that rank in the top 20% of the Firm Performance Index. The index evaluates all firms in the study according to 15 metrics to arrive at a holistic assessment of each firm's performance across keybusiness areas.Results for all firms with 25 million or more in AUM that reported tracking their new client growth goals. Past performance is not an indicator of future results. 2021 RIA Benchmarking Study from Charles Schwab, fieldedJanuary to March 2021. Study contains self-reported data from 1,340 firms. Participant firms represent various sizes and business models categorized into 7 peer groups by AUM.2021 RIA Benchmarking Study from Charles Schwab29
BrandFirms were successful in maintaining their level of new clientassets.Firms under 250MAssets from new clients ( M)Firms over 250MAssets from new clients ( M)In millions 5.0 4.02016 4.32017In millions 5.1 17.7 4.02018 21.02019202020162017 23.0 23.0 19.7201820192020Median results for all firms with less than 250 million in AUM and firms with 250 million or more in AUM. Past performance is not an indicator of future results. 2021 RIA Benchmarking Study from Charles Schwab,fielded January to March 2021. Study contains self-reported data from 1,340 firms. Participant firms represent various sizes and business models categorized into 7 peer groups by AUM.2021 RIA Benchmarking Study from Charles Schwab30
Looking aheadBrandFirms pivoted to virtual business development and tried newtactics to maintain their level of new client assets in 2020.Firms using digital tactics for prospectingTop Performing FirmsAll other firms82%71%Over one-third of all firms implementedthese tactics for the first time in 202071%58%61%50%47%38%41%32%22% 20%14% 13%WebsiteEmailand inarsOnlineadvertisingVirtual eventswith clientsinviting friends10%7%Podcast7%5%Virtual eventswith prospectsonlyResults for Top Performing Firms and all other firms. Top Performing Firms are those that rank in the top 20% of the Firm Performance Index. The index evaluates all firms in the study according to 15 metrics toarrive at a holistic assessment of each firm's performance across key business areas.Past performance is not an indicator of future results. 2021 RIA Benchmarking Study from Charles Schwab, fielded January to March 2021. Study contains self-reported data from 1,340 firms. Participant firmsrepresent various sizes and business models categorized into 7 peer groups by AUM.2021 RIA Benchmarking Study from Charles Schwab31
BrandRIAs had success in generating leads digitally, with nearly 80% offirms converting some prospects completely virtually in 2020.1Percent of firms generating leads from digital tactics2Over two-thirds of all firms reported generating leads from these tactics80%68%67%58%75%72%58%54%47%WebsiteEmailand inarsOnlineadvertisingVirtual eventswith clientsinviting friendsPodcastVirtual events withprospects only1 Based on firms that converted one or more prospects into clients completely virtually in 2020.2 Based on firms that track leads and indicated generating one or more leads from tactic.Results for all firms with 25 million or more in AUM. Past performance is not an indicator of future results. 2021 RIA Benchmarking Study from Charles Schwab, fielded January to March 2021. Study contains selfreported data from 1,340 firms. Participant firms represent various sizes and business models categorized into 7 peer groups by AUM.2021 RIA Benchmarking Study from Charles Schwab32
Looking aheadBrandWith websites serving as the new “front door” during thepandemic, firms optimized them to attract and engage prospects.Features firms have implemented to optimize website for lead generationFirms under 250MFirms over 250MTop Performing Contentdesigned for idealclient personaWebsite metricsand analytics37%33%28%Search engineoptimization42%40%27%Lead capture formBlogSocial media buttonsVideoTop Performing Firms are those that rank in the top 20% of the Firm Performance Index. The index evaluates all firms in the study according to 15 metrics to arrive at a holistic assessment of each firm's performance acrosskey business areas.Past performance is not an indicator of future results. 2021 RIA Benchmarking Study from Charles Schwab, fielded January to March 2021. Study contains self-reported data from 1,340 firms. Participant firms representvarious sizes and business models categorized into 7 peer groups by AUM.2021 RIA Benchmarking Study from Charles Schwab33
Looking aheadBrandLooking ahead, advisors anticipate leveraging both virtualand in-person business development strategies.Percent of prospects engaging with staff completely virtually90%during Q1 202130%when COVID-relatedrestrictions are liftedMedian results for all firms with 25 million or more in AUM. Past performance is not an indicator of future results. 2021 RIA Benchmarking Study from Charles Schwab, fielded January to March 2021. Study containsself-reported data from 1,340 firms. Participant firms represent various sizes and business models categorized into 7 peer groups by AUM.2021 RIA Benchmarking Study from Charles Schwab34
Looking aheadBrandTop Performing Firms saw twice the growth in assets from newclients, driven by their marketing and client referrals.Asset growth from new clients by source7.4%2.8%2.0xmore growth1.0%3.6%3.6%1.0%0.6%Other marketingCOI/business partner referralsExisting client referrals2.0%Top Performing FirmsAll other firmsResults for Top Performing Firms and all other firms. Top Performing Firms are those that rank in the top 20% of the Firm Performance Index. The index evaluates all firms in the study according to 15 metrics to arrive at aholistic assessment of each firm's performance across key business areas.Past performance is not an indicator of future results. 2021 RIA Benchmarking Study from Charles Schwab, fielded January to March 2021. Study contains self-reported data from 1,340 firms. Participant firms representvarious sizes and business models categorized into 7 peer groups by AUM.2021 RIA Benchmarking Study from Charles Schwab35
BrandThe 5-year net organic CAGR for Top Performing Firms indicatessuccessful long-term strategies.Top PerformingFirmsAll other firmsMultiple5-year net organic assets CAGR13.9%4.7%3.0x5-year revenue CAGR14.7%7.0%2.1xNet asset flows in 2020 25 million 12 million2.1xNumber of new clientsin 202022141.6xAssets from new clientsin 2020 19 million 11 million1.7x 50,000 32,0001.6xNew revenue per professionalin 2020Median results for Top Performing Firms and all other firms. Top Performing Firms are those that rank in the top 20% of the Firm Performance Index. The index evaluates all firms in the study according to 15 metrics toarrive at a holistic assessment of each firm's performance across key business areas.Past performance is not an indicator of future results. 2021 RIA Benchmarking Study from Charles Schwab, fielded January to March 2021. Study contains self-reported data from 1,340 firms. Participant firms representvarious sizes and business models categorized into 7 peer groups by AUM.2021 RIA Benchmarking Study from Charles Schwab36
Looking aheadBrandReferrals account for a majority of new clients, yet fewer thanhalf of firms document referral plans.45%Top Performing FirmsFirms with a documentedreferral plan for existing clients39%Firms over 250M28%Firms under 250M32%Top Performing FirmsFirms with a documentedreferral plan for businesspartners30%Firms over 250MFirms under 250M16%Top Performing Firms are those that rank in the top 20% of the Firm Performance Index. The index evaluates all firms in the study according to 15 metrics to arrive at a holistic assessment of each firm's performance acrosskey business areas.Past performance is not an indicator of future results. 2021 RIA Benchmarking Study from Charles Schwab, fielded January to March 2021. Study contains self-reported data from 1,340 firms. Participant firms representvarious sizes and business models categorized into 7 peer groups by AUM.2021 RIA Benchmarking Study from Charles Schwab37
BrandFirms with referral plans achieved stronger results from thosechannels in 2020 than firms without referral plans.Firms with existing client referral plansFirms with business partner referral plans9%2x16%4xmore new clientsgenerated from existingclient referralsmore assets from new clientsgenerated from existingclient referralsmore new clientsgenerated from businesspartner referralsmore assets from new clientsgenerated frombusiness partner referralsMedian results for all firms with 250 million or more in AUM. Past performance is not an indicator of future results. 2021 RIA Benchmarking Study from Charles Schwab, fielded January to March 2021. Study containsself-reported data from 1,340 firms. Participant firms represent various sizes and business models categorized into 7 peer groups by AUM.2021 RIA Benchmarking Study from Charles Schwab38
2021 RIA Benchmarking Study from Charles Schwab39
TalentHaving an employee value proposition is critica
2021 RIA Benchmarking Study from Charles Schwab. Median results for all firms with less than 250 million in AUM and firms with 250 million or more in AUM. Past performance is not an indicator of future results. 2021 RIA Benchmarking Study from Charles Schwab, fielded January to March 2021. Study contains self -reported data from 1,340 firms.