Transcription
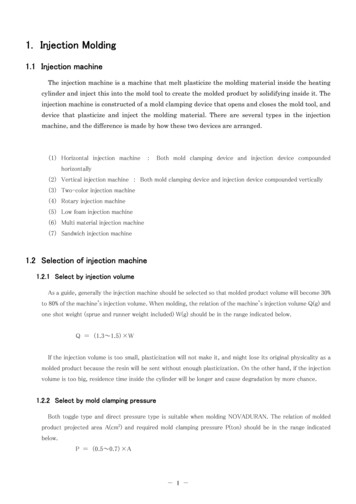
Best practice for benchmarking injectionmoulding simulationR. G. Speight, F. Costa, P. K. Kennedy* and C. FriedlInjection moulding simulation benchmarking is the comparison of predicted and actual processand quality parameters. Best practice requires that the inputs and outputs from an injectionmoulding simulation agree to the actual conditions of a real life moulding machine, as closely aspossible. The accuracy of injection moulding simulation is influenced by many factors such as: themodelling of the part geometry, runner and nozzle, model mesh type and density, mathematicalfinite element solution, material data, and process settings. Validation of injection mouldingsimulation requires good quality process measurements from a range of transducers, measuringprocess pressure and temperatures at different locations and including movement of thereciprocating screw to infer flow rate and accurate and repeatable measurement methods for partdeflection. The objective of this paper is to give the reader an appreciation of the important issues,to ensure the inputs for an injection moulding simulation match the actual conditions of the real lifemoulding machine. The inputs for injection moulding simulation are reviewed in detail, firstlyconsidering machine performance issues and secondly considering the simulations issues. Thiswill provide the reader with knowledge and understanding to improve benchmarking procedures.Keywords: Injection moulding, Simulation, Validation, Accuracy, Error, ExperimentIntroductionBenchmarking is a technique used by engineers since thevery beginning of Computer Aided Engineering (CAE)for injection moulding simulation. One of the earliestdocumented benchmarks was by Colin Austin, founderof Moldflow, in late 1970s during a trip to Japan. Colinwas lecturing on a seminar tour to promote Moldflowtechnology, after presenting his seminar in Tokyo hedesigned a simple runner balancing technique on amould for Toshiba. On his visit to the Toshiba plant thenext day, the engineers informed Colin, that they hadgone back to their factory the previous night, assembleda mould with inserts in it, moulded samples and theirresults agreed with the simulations. They wereimpressed.1 At that time there was a real problem withregulating the flow of polymer melt into the runners andcavities, with overpacking in one cavity and a short shotin another cavity. Use of CAE for injection mouldingsimulation has progressed from flow front prediction inthe early days, through to include full simulation of theinjection moulding process and its variants and associated processes. The theory and practice for validationof flow analysis software is described by Austin.2An important reason for benchmarking is to confirmsimulation results when users are first introduced toinjection moulding simulation applications. Typically anMoldflow Pty Ltd, Kilsyth, Australia*Corresponding author, email Peter kennedy@moldflow.com124ß 2008 Institute of Materials, Minerals and MiningPublished by Maney on behalf of the InstituteReceived 12 October 2007; accepted 3 December 2007DOI 10.1179/174328908X283203extensive study is carried out on a representative mould,machine and material combination, where filling pattern,injection pressures and part warpage are reviewed. Onceresults have been confirmed and practical considerationsare documented, the injection moulding simulationapplications are then implemented on a large scale, whichdemands good communications between design engineersand the shopfloor. The moulding industry is changing andimproving the link between design and manufacturing, theflow of machine setup information and process responsecontinues to be critical. It is still true today that the threekey stages of the value chain: part design, mould designand production, may actually be controlled by differentorganisations, within a company (see Fig. 1). While theseorganisations may be independent, it is vital that therequired inputs for the CAE simulation are validatedby part design, mould design, manufacturing andproduction.Objectives of benchmarking are to gain confidenceand experience in modelling, material and simulationcapability, and to then use simulation results to guidefuture design decisions for which designers do not havemoulding data.The following list outlines the key parameters that aretypically compared by design and process engineers:(i) fillinga. injection nozzle pressureb. filling pattern, weldlines and hesitationsc. packing cavity pressure decay(ii) warpagea. deflections, out of planePlastics, Rubber and Composites2008VOL37NO2/3/4
Speight et al.Best practice for benchmarking injection moulding simulation1 Three key stages of value chain (‘islands of automation’ operate independently)b. in plane shrinkages.The cooperation between the design engineer, processengineers and machine setters will improve throughinformation exchange. Design induced limitations willbe reduced by automated tools that pass informationtransparently between the shop floor and the designengineers, as part of a product lifecycle managementsystem. Such a system will provide evidence of designproblems and reduce anecdotal information, with animportant area being the comparison of predicted andexperimental data. The key to the validation of suchsystems is ensuring that there is good agreement betweenthe simulations and the real world. Figure 2 shows aschematic diagram of the benchmark process. Thispaper will focus on the preparation of a benchmarkand the importance of appreciating and understandingthe inputs.Value of injection moulding simulationThe value of injection moulding simulation are clear.3Injection moulding and its variants are the mostsuccessful area of simulation because:(i) the process may be represented by a relativelysimple material model, namely, the generalisedNewtonian fluid which allows the viscosity of thefluid to be a function of the rate of deformation(ii) the governing equations may be reduced to asimple form that is suitable for solution onordinary computers(iii) injection moulding simulation has a high returnon investment.Injection moulding demands more of part and moulddesigners, as experimentation after the mould is built isexpensive in terms of time and money. Injectionmoulding simulation is relatively inexpensive in termsof project cost and offers great benefits to those using itearly in the manufacturing process. The above factorsbring a level of complexity to injection moulding that isnot present in other plastic forming processes. All theseaspects combine to make injection moulding an idealfocus for simulation. Simulation of injection mouldinghas a higher return on investment than simulation ofother plastic forming processes.Accuracy of injection mouldingsimulationThe accuracy of injection moulding simulation isinfluenced by many factors. If the aim of the simulationis the prediction of filling patterns and the location ofany weldlines or hesitation marks, then the accuraterepresentation of the geometry is the most critical factor.2 Schematic diagram of benchmarking processErrors in the modelling of wall thickness are surprisinglycommon. These may be due to design changes madetowards the end of the design cycle not being present inthe CAD model used as a basis for the simulationmodel, or they may be due to the tooling not exactlymatching the final CAD design. In either case, whenbenchmarking fill pattern predictions against short shotsamples, it is important to check key wall thicknesses inthe simulation model against actual moulded parts.Another class of geometry inaccuracy which can arise isthe simplification inherent in the modelling representation chosen. Injection moulding simulation has traditionally been based on a midplane shell representation ofthe part geometry. More recently, Dual Domaintechnology from Moldflow has allowed a solid geometryrepresentation, but both of these modelling methods arereliant on the assumption of laminar Hele-Shaw flowand are not well suited to geometries with width tothickness ratios less than four. For such geometries, atrue solid modelling representation of the part geometryis required because the errors in the Hele-Shawapproximations become too great.If the aim of simulation is the prediction of thepressure required to fill the moulding, then inclusion ofthe runner, sprue and gating design is essential. Inaddition, if the simulation injection pressure will becompared to a measured nozzle pressure, then it is alsoappropriate to account for the pressure drop in thenozzle and contraction into the nozzle tip. This can bedone either my including the nozzle body and contraction into the simulation model (typically assigning aproperty similar to hot runners) or by performing an airshot experiment. An air shot experiment is when theinjection unit of the moulding machine is retracted awayfrom the mould and an injection shot performed at thetypically injection speed, but with polymer extrudingfreely out of the nozzle tip rather than flowing into thetop of the sprue. The recorded nozzle pressure duringthe air shot experiment may typically be between 10 and40 MPa and should be added to the predicted injectionpressure if the simulation model begins from the top ofthe sprue.Good quality material data is also important whencomparing injection pressures. In this case, gradespecific viscosity data is required, including pressuredependence if the injection pressures will be high(.100 MPa) and including some model to representthe entrance pressure loss, extensional viscosity orPlastics, Rubber and Composites2008VOL37NO2/3/4125
Speight et al.Best practice for benchmarking injection moulding simulation‘juncture loss’ which will occur at any strong contractions, such as entering narrow gates.If the aim of simulation is to predict the final warpedshape of the ejected part, then the accurate reflection ofthe process settings in the simulation is important. Inparticular, packing time and packing pressure (orpressure profile), cooling time and any relative differencein coolant temperatures have a strong influences on theamount of shrinkage and warpage. In mouldingpractice, it is possible to halve the amount of warpage,or even change the warpage direction for some partsthrough changes in these process settings. Injectionspeed, which has a strong influence on filling pressure, isnot usually a dominant influence on warped shape.The availability of accurate material data will alsoinfluence the simulation accuracy of warpage predictions. For example, the use of grade specific pressure–volume–temperature (PVT) and thermal conductivityand specific heat data is required for accurate representation of shrinkage and warpage, as are the mechanicalproperties of the solidified polymer such as modulus andcoefficient of thermal expansion. Shrinkage correctioncoefficients derived from shrinkage measurements onplaque mouldings for a range of processing conditionsand geometries can also be used to improve the accuracyof shrinkage and warpage predictions.4The discretisation of the geometry (into finite differencegirds, finite elements or finite volume cells), will also play akey role in simulation accuracy. Areas of changes inthickness, such as the gate, should be discretised by aminimum of three rows of elements to allow an adequaterepresentation of the thickness changes. Some discretisation methods allow the geometry surface to be altered tofit the discretisation size, but this should be avoided ininjection moulding where small features such as the gatecan have critical influences on simulations. For example, ageometry error in the sizing of a gate due to discretisationwould lead to a delayed prediction of gate freezeoff duringpacking, which will have a strong influence on theshrinkage and warpage of the part.The mesh size must also be considered with respect tothe type of numerical solution being used. Traditionally,for Hele-Shaw based laminar flow simulations, a mixedfinite element and finite difference method is used,5where a one dimensional finite difference grid isemployed in the thickness direction to capture temperature, viscosity and shear rate variations. Analogously,when using a three-dimensional method, care must betaken to ensure sufficient discretisation is presentthrough the thickness direction in all locations toprovide sufficient resolution to represent the sameproperty variations. Lower order or constant propertyschemes such as the finite volume method require a finerlevel of discretisation than finite element methods,particularly if higher order interpolations are used inthe finite element formulation.126involves testing that the intended equation or algorithmand associated boundary conditions have been codedfaithfully. Verification is not related to the process beingsimulated. It is a mathematical step that ensures no errorsare introduced in creating the simulation code.Validation checks that the results of the codedmathematical model have some agreement with physicalexperiment. Validation therefore assesses how well aparticular model describes the physical process beingsimulated.Analysis accuracy refers to the accuracy of the resultsobtained from simulation. Accuracy depends on thefidelity of the mathematical model used in the simulation, its implementation in the code, the appropriateboundary conditions (these include processing conditions), discretisation of the geometric domain in whichwe seek a solution and material models that describe thematerial’s physical properties. Verification is necessaryto ensure accuracy, however it is validation thatprovides quantitative measures of accuracy.Accuracy is therefore not a simple comparison ofsimulation results and an experiment. Errors arise forthe following reasons:(i) software error – incorrect coding of a mathematical expression and/or its associated boundary conditions(ii) geometrical error – import of geometry and thesubsequent discretisation used to define thecomputational domain does not reflect the realpart(iii) material data error – material data is notappropriate for the materials used to producethe part(iv) input error – processing conditions used in thesimulation differ from those used in themanufacturing process(v) post processing – manipulation of calculateddata for post processing(vi) experimental error – experimental data is inerror often due to poor experimental technique,poor instrumentation or transducers.Injection moulding machinebenchmarkingAn understanding of the fundamental concepts of theinjection moulding machine are required, and alsospecific details of the actual machine being used. It isimportant to have an appreciation of the links betweenthe manufacturing and simulation worlds, and that thesimulation should be treated as a virtual mouldingmachine. Important factors to consider are: machinecapability, accurate information about screw movements, check ring valve performance, material preparation (drying), nozzle pressure or cavity pressure, nothydraulic pressure, shot to shot variations (stability),venting, sensor types and reliability.Verification and validationMoulding: machine capabilityAt its most abstract, simulation involves using a computerto solve partial differential equations with suitableboundary conditions (mathematical model). In practice,simulation involves the transformation of the mathematical model into computer code. This involves the codingof algorithms to solve the mathematical model and thediscretisation of the solution domain. VerificationMoulding machines are continually advancing, andthere are a wide range of machines available. Theinjection stage can be pressure controlled or velocitycontrolled, most modern machines are velocity controlled, in open or closed control loop. There are alsodifferent methods of actuation: open loop digitalhydraulics, closed loop proportional valve, and closedPlastics, Rubber and Composites2008VOL37NO2/3/4
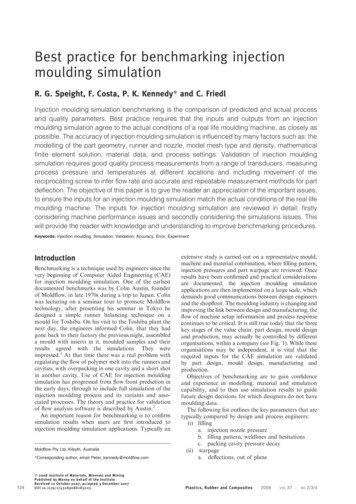
Speight et al.3 Screw position in packing/holding stage,check ring valveforwornloop servovalve. The packing or compression stage is atransition stage from velocity control to pressurecontrol, typically this stage is not well controlled, untilthe set holding pressure is achieved. In a recentvalidation study at Moldflow, a moulding machinewhich had a set flow rate of 93 cm3 s21, actually onlyachieved an average flow rates of 52 cm3 s21, based onscrew movement calculations, due to machine responsecapability. There was not indication from the mouldingmachine that the set flow rate was not achieved. AnotherMoldflow study showed that set holding pressureswere not being reached until gate freezeoff occurred,due to the dynamics of the control system. An important technical requirement for the benchmarkingprocess is a high speed data acquisition system,monitoring the injection moulding process. This willprovide a accurate indication of a machines performance, and this data can then be used as the basis of thesimulation inputs.Moulding: screw movement and check ringvalve performanceProcess monitoring, as well as providing details ofmachine performance can also detect machine problems,which should always be reviewed prior to the start of abench mark. Moulding machines that are subjected tocontinuous use will have problems, worn check ringvalues can result in incorrect flow rates and packing/holding pressures. Figure 3 demonstrates the screwmoving in packing/holding up to 50% of the fillingstroke due to a worn check ring valve. This screwmovement continued even after the cavity pressuretraces (blue) indicated that the polymer in the cavityhad frozen.Best practice for benchmarking injection moulding simulation4 Screw nozzle melt pressure and hydraulic pressurecomparisonsNozzle melt pressure (APiston AScrew ) hydraulic injection pressurewhere APiston is area of hydraulic piston (m2) and AScrewis area of screw (m2)The ratio of piston to screw areas is referred to as thescrew intensification ratio or gain, and is typicallyquoted as being approximately equal to 10, it may infact vary considerably depending on screw and pistongeometries. In practice the apparent screw intensification ratio may vary due to:(i) compressibility of the hydraulic oil due totemperature changes(ii) frictional effects between the screw and barrel(iii) the influence of polymer melt compressibilityduring the filling process.Figure 4 shows nozzle melt pressure measured using aDynisco nozzle melt pressure sensor and nozzle meltpressure derived from multiplication of the theoreticalscrew intensification ratio of hydraulic pressure, showing a 10 mPa difference.7 In practice, nozzle meltpressure is often derived from hydraulic pressure, dueto difficulties of installing nozzle melt pressure sensors.Moulding: shot to shotTypical injection machine controllers typically have verylimited capabilities for data overlaying, making itdifficult to determine shot to shot variations. Figure 4demonstrates differences in nozzle melt pressure, it isMoulding: material dryingMaterial drying can cause process stability issues andalso differences in melt viscosity. In research by Khannaet al.,6 Nylon was dried for 17 h at 80, 110, 125 and140uC, the lower temperature resulted in a highermoisture content which resulted in a viscosity differenceup to 500% at low shear rates and 200% at higher shearrates.Moulding: nozzle pressureThe ideal relationship between nozzle melt pressure andhydraulic injection pressure is shown below5 Overlaid screw position and injection pressure profilesPlastics, Rubber and Composites2008VOL37NO2/3/4127
Speight et al.Best practice for benchmarking injection moulding simulation6 Overlaid screw position and injection pressure profilesimportant to note that the curves are the mean of 25cycles, and the coefficient of variation is displayed, sothat the quality of the data is clearly visible. Figure 5shows successive pressure sensor and screw positiontraces (short glass fibre reinforced polyethylene terephthalate (PET)/polybutylene terephthalate (PBT)blend, fibre filled) immediately following a change inprocessing settings (injection speed). The screw positiontrace appears stable, but the pressure traces are notstable, this is a material effect, not a machine effect andis probably a result of an unoptimised melt preparationstage.Figure 6 shows the pressure traces once the processhas stabilized, the successive pressure traces typicallystabilise after 5 to 10 shots.Moulding: sensorsA machine independent process monitoring system fordata acquisition is essential for injection mouldingvalidation. The system has to be capable of capturingthe true machine and process dynamics. Coates andSpeight8 describe the full range of sensors that areavailable for the injection moulding process. Sensorselection is determined by considering multiple factors,such as cost, robustness/reliability, dynamics, repeatability, linearity, influence of external indirect factors(such as temperature on a pressure sensor), size ofmeasuring head and ultimately suitability. Figure 7shows cavity pressure readings for three equidistantpressure sensors in a 1 mm rectangular cavity, filled withpolypropylene at constant flow rate. The flow front isexpected to reach cavp3 one second after cavp2, but it isclearly visible that the pressure rises earlier. The pressuresensor is performing correctly, but is measuring the airpressure build up due to poor mould venting.Moulding practice: warpageFlow front position, injection pressure and warpage arecommon benchmarking parameters. Warpage benchmarking can be influenced by coolant temperatures,packing pressure settings, shot to shot variations(stability) and a reliable and repeatable way of measuring warpage. Warpages measured within the tool makersmould tolerance, i.e. ¡10 mm, are really outside thebounds of the simulation world.128Plastics, Rubber and Composites2008VOL37NO2/3/47 Cavity pressure readings for three equidistant pressuresensors in 1 mm rectangular cavity, filled at constantflow rate, polypropyleneInjection moulding simulationbenchmarkingInjection moulding simulation benchmarking of CAErequires an appreciation of simulation technology andknowledge of the assumptions made in the simulation.Simulation: filling inputsThe most important input that influences filling patternis mould geometry, so an accurate representation of themould geometry is essential. The most important inputsthat influence injection pressure are:(i) geometry,(ii) switchover from velocity to pressure control stages(iii) material viscosity(iv) injection speed (profile or constant).Simulation: geometryOften time is spent analysing simulation results of anintricate feature, only to find that the feature was notmodelled correctly. Models are often assumed to becorrect. It is always advisable to have a moulded part toreview, to check for any obvious errors, it is alsorecommended to consider the life of the tool, as severalmodifications may have been performed on the tool. Themodel used for the injection moulding simulation may befrom the part design, so the tool maker’s shrinkageallowance will not be included in any dimensions. Nozzle,runner and gate geometries are not always included in asimulation model, these features can have a considerableeffect on simulation results, particularly pressure to fill.Simulation: switchoverSwitchover from velocity to pressure control is set by:screw position or time, in this case the full geometry mustbe modelled accurately, or volume percentage filled orautomatic. Moulding simulation often uses the latter andit is essential to check that this is a reasonable approximation of the settings used on the moulding machine.Simulation: viscosityIn the situation when a material is not present in thematerial database it is common practice to choose‘similar’ material based on melt flow index (MFI) orviscosity, using the same polymer family, similar levels of
Speight et al.8 Experimental and predicted injection pressuresBest practice for benchmarking injection moulding simulation9 Experimental and predicted injection pressures10 Default and actual packing/holding pressure profilesfiller and perhaps the same manufacturer. It may beexpected that a 10% difference in filler weight percentagegives y10% difference in pressure prediction. If usingmaterial data from a different manufacturer expect up to40% difference in pressure. This is because viscosity is alsoindirectly affected by the material’s thermal properties.Figure 10 illustrates the effect of using an arbitrarypressure profile on warpages results. This example servesto highlight the need for users to appreciate any settingsthat are determined by the simulation program for thepurpose of making the program easier to use.Simulation: injection speedConclusionsIt is important to set the correct injection velocity (flowrate profile). Figure 8 shows the experimental andsimulation results compared, where the flow rate used insimulation was determined from readings on two cavitypressure sensors. The difference in position between thesensors and the time difference for the flow to reach thesensors was used to determine an injection speed forthe simulation. However injection speed calculated thisway shows poor agreement with measured pressures.Figure 9 shows the results of simulation using the actualscrew velocity profile of the machine used in the experiment. The prediction of pressure is greatly improved.Benchmarking of injection moulding simulation requiresa systematic approach to problem elimination whencomparing simulation and moulding practice.Many different factors may be the cause of error.1. Machine capability and response time.2. Material preparation, characterisation and stability.3. Measurement methods (pressure or deflection).4. Geometry inaccuracies.5. Variation in process settings used in experimentand inputs to simulation software.Awareness of these points is essential when comparing simulation results to those obtained on mouldingmachines.Fortunately, even without perfect agreement, simulation can provide great insight into performancesensitivities to process, geometry and material. Thesesensitivities may be used by engineers to improve product design and process settings for actual production.Simulation: packing pressureInjection moulding simulation has many built-in features to make running a simulation easy. One feature isthe automatic packing/holding pressure profile, whichuses by default 80% of the maximum injection pressurefor 10 s. Often the actual pressure profile is overlooked.Plastics, Rubber and Composites2008VOL37NO2/3/4129
Speight et al.Best practice for benchmarking injection moulding simulationAcknowledgementThis paper is based on a presentation at the PolymerProcess Engineering Conference held in Bradford, UK,in July 2007.References1. B. Whitford: ‘Success through excellence, a professional innovator’, 389; 1992, Perth, Beaumont Publishing House.130Plastics, Rubber and Composites2008VOL37NO2/3/42. C. Austin: Proc. ANTEC 90, Dallas, TX, USA, May 1990, SPE,208–211.3. A. R. Thomas, R. G. Speight and P. K. Kennedy: J. Plast. RubberCompos., 2005, 34, (5/6), 211–221.4. P. Kennedy and R. Zheng: Proc. ANTEC 2002, San Francisco,CA, USA, May 2002, SPE, 593–599.5. C. A. Heiber and S. F. Shen: J. Non-Newt. Fluid Mech, 1980, 7, 1–32.6. Y. P. Khanna, P. K. Han and E. D. Day: Polym. Eng. Sci., 1996,36, (13), 1745–1754.7. R. G. Speight, P. D. Coates, J. B. Hull and C. Peters: Proc. I MechE Part E, 1997, 211E, (2), 115–128.8. P. D. Coates and R. G. Speight: Proc. I Mech E Part B, 1995, 209B, 357.
Best practice for benchmarking injection moulding simulation R. G. Speight, F. Costa, P. K. Kennedy* and C. Friedl Injection moulding simulation benchmarking is the comparison of predicted and actual process and quality parameters. Best practice requires that