Transcription
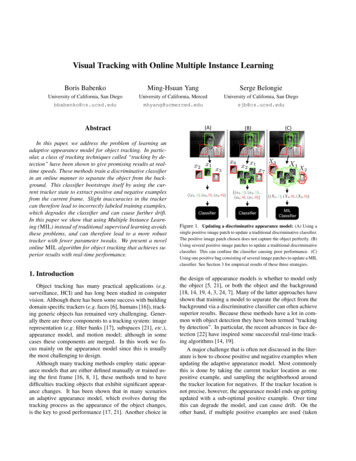
TUTORIALNOTECellular Imaging and AnalysisVolocity TutorialTracking in Volocity Software This tutorial will demonstrate how to perform tracking using Volocity Software.DataLive Cell TrackingWorkflowTracking objects may be appropriate if you are interested in characterizing the movement of objects (i.e. theirspeed, direction), or monitoring properties of objects as they move over time. In Volocity, tracking is a twostage process:1)2)The identification of the objects.The analysis of the positions of those objects and the building of tracks.Finding objectsClick once on the data in the library list and click on the Measurements tab to display the Measurement View.The image is shown in the mode that best shows the objects to be measured, and below it is an area whereall measurements made will be displayed. At the top left of the screen is an area where a measurementprotocol will be built, to find objects of interest in the dataset and track them, using the list of tasks in the areabelow.Image preview shows feedback as measurements are madeDragmeasurementprotocol tasksto this pane tomake protocolsMeasurementprotocol tasksMeasurements are shown here as a table or histogram
It is important that the Measurement Protocol identifies objects as accurately as possible in each timepoint asthis will be essential for the tracking algorithm.The objects within this dataset do not exhibit the same intensity values throughout the time-course; thereforethresholding on the same intensity values in each timepoint is unlikely to be successful.The task “Find Objects” is designed to operate even in these challenging conditions. Drag this task to theprotocol pane above.Where intensities are found within range a colored overlay is applied. Groups of selected intensities formobjects. View the image, with object overlays, in different ways by changing the mode of view in the top left.www.perkinelmer.com2/9
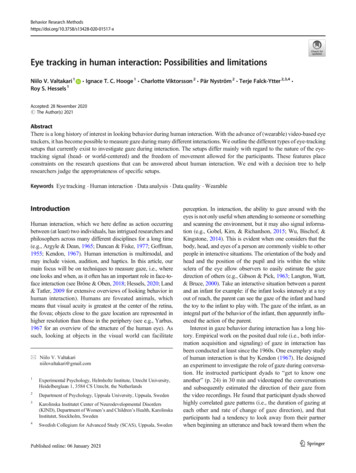
In this example, some of the objects formed are too large, they are actually two or more objects currentlyidentified as one. Use the task “Separate Touching Objects” to improve this situation. This task will beapplied to the previously selected population, so make sure that it is dragged into the series and containedwithin the same colored bubble.The Object size guide, shown in the “Separate Touching Objects” task box, can be set to the approximatesize of the smallest object that can be created by the separating step. In this example the Object size guide is30 µm , the best separation is achieved by not restricting the size of objects that will be made.TrackingOnce all objects have been identified in all timepoints they can be connected together by tracks. Add a“Track” task to the measurement protocol.The tracking algorithm uses the centroid measurement for each previously identified object to determinewhether there is any movement of objects over time. Tracks are generated by connecting the centroids so asto trace the path of a moving object. The track objects task will always place itself at the bottom of the list oftasks in the protocol since objects must be found before they can be tracked.www.perkinelmer.com3/9
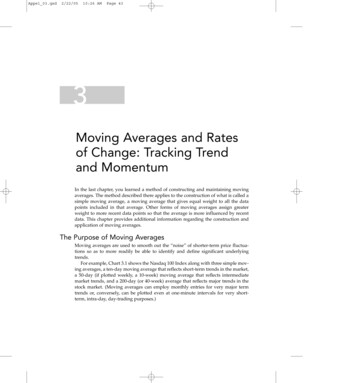
To alter how the tracks are measured, click on the cog icon on the “Track” task to access the secondarydialog for this task. For example, it may be necessary to set a maximum distance between objects, in thisexample 5 µm.www.perkinelmer.com4/9
To see the results of the “Track” task, all timepoints must be measured. Select Measure all timepoints fromthe Measurements menu.Objects that have been tracked, and are therefore determined to be the same object in different locations arecollected in a separate population for tracks. Display this population to see only measurements made on trackinformation. This contains summary information such as track length, the average velocity for the duration ofthe track, the trajectory and the meandering index.www.perkinelmer.com5/9
Check the trackingTo see individual properties of each cell, and how those properties change over time, display the populationand sort by track ID. This will sort the table so that the measurements for each cell in each timepoint, and thetrack, are listed in order.Now that the objects have been measured and tracked, we should confirm these tracking results by examiningindividual tracks. Select a row (shift-click to select multiple rows) in the table, representing a track, to show theindividual overlay of that track on the image.www.perkinelmer.com6/9
Showing object feedback for the current timepoint only can assist in understanding what is being shown. Toadjust the feedback that is displayed on the image, select Feedback Options. from the Measurementsmenu.Use the time navigation controls to compare the feedback with the underlying image data.The most likely problem with tracks is caused by setting the wrong maximum distance between objects in thesecondary dialogue of the “Track” task (as discussed previously). If tracks are incorrect because they switchwww.perkinelmer.com7/9
to different objects part way through the time series, the maximum distance assigned is too great. If tracks areincorrect because they do not follow an object far enough in the time course, the maximum distance may betoo small. Adjust as appropriate.Analysis of tracking dataTo easily extract what is of particular interest from this wealth of information, you may store all themeasurements, in table format, as a separate Measurement Item within the library, and then perform furtheranalysis.Select Make Measurement Item from the Measurements menu, remembering to select Measure AllTimepoints when prompted.www.perkinelmer.com8/9
The measurement item has different tabs, such as Raw, Analysis and Chart. The raw view shows the sameinformation for objects and tracks as was visible in the measurements view. Click on the Chart tab toimmediately show the default representation of track information.Raw tables, analysis tables and charts, created within the resulting Measurement Item, can all be viewed inVolocity or exported as text or image files.PerkinElmer, Inc.940 Winter StreetWaltham, MA 02451 USAP: (800) 762-4000 or( 1) 203-925-4602www.perkinelmer.comFor a complete listing of our global offices, visit www.perkinelmer.com/ContactUsCopyright 2010, PerkinElmer, Inc. All rights reserved. PerkinElmer is a registered trademark of PerkinElmer, Inc. All other trademarks are the property of their respective owners.www.perkinelmer.com9/9
Tracking in Volocity Software This tutorial will demonstrate how to perform tracking using Volocity Software. TUTORIAL NOTE Measurements are shown here as a table or histogram Measurement protocol tasks Drag measurement protocol tasks to this pane to make protocols Image preview shows feedback as measurements are made . www.perkinelmer.com 2/9 It is important that the

![Unreal Engine 4 Tutorial Blueprint Tutorial [1] Basic .](/img/5/ue4-blueprints-tutorial-2018.jpg)