Transcription
Cite this articleResearch ArticleOrense RP, Mirjafari Y and Suemasa NScrew driving sounding: a new test for field characterisation.Geotechnical er 1800024Received 27/04/2018; Accepted 18/06/2018Keywords: field testing & monitoring/geotechnical engineering/siteinvestigationPublished with permission by the ICE under theCC-BY 4.0 0/)Geotechnical ResearchScrew driving sounding: a new test for fieldcharacterisationRolando P. Orense Dr.Eng.Yasin Mirjafari PhDAssociate Professor, Department of Civil and Environmental Engineering,University of Auckland, Auckland, New Zealand (corresponding author:r.orense@auckland.ac.nz) (Orcid:0000-0002-0581-9563)Geotechnical Engineer, Tonkin & Taylor Ltd, Auckland, New Zealand;formerly University of Auckland, Auckland, New ZealandNaoaki Suemasa Dr.Eng.Professor, Department of Urban and Civil Engineering, Tokyo CityUniversity, Tokyo, JapanVarious in situ testing techniques are commonly employed to obtain geotechnical parameters for use in analyses anddesign. Some of the more popular field tests include standard penetration tests (SPTs), cone penetration tests (CPTs) andSwedish weight sounding (SWS). SPT and CPT are commonly preferred for large-scale projects, but they are expensivewhen implemented for small-scale constructions. SWS is highly portable and economical but poor in classifying soils. Thescrew driving sounding (SDS) test, which has been recently developed in Japan, is an improved version of SWS and canmeasure more parameters, including the required torque, load, speed of penetration and rod friction, and thereby providesa robust way of characterising soil stratigraphy. It is cost efficient and uses a machine-driven and portable device, makingit suitable for testing in confined areas. Moreover, with a testing depth of 10–15 m, it is ideal for characterising shallowdeposits. In this paper, the SDS test is introduced and the results of its application to various New Zealand sites arediscussed. Moreover, a number of correlations between SDS parameters and CPT/SPT data are presented. The results provethat SDS can be an effective alternative for soil characterisation, particularly in residential areas and roading projects.NotationAvedT average change in torque per 25 cm penetrationcpcoefficient of plastic potential in plasticity-basedSwedish weight sounding (SWS) modelcp00average value of cp for 25 cm penetrationcycoefficient of yield locus in plasticity-based SWS modelDmaximum diameter of the screw pointEpenetration energy at a load stepEsaverage specific energy per 25 cmFCfines contentfscone penetration test (CPT) sleeve frictionIcCPT soil behaviour type indexLamount of penetrationNnumber of blow counts in a standard penetration testNanumber of half-turns per 25 cm in an SWS testNSDnumber of half-turns per 25 cm in a screw drivingsounding testNswnumber of half-turns per metre in an SWS testnnumber of steps of loadingnhtnumber of half-turns at a load stepqcCPT cone resistancerradius of the sounding rodstsettlement at a load stepTeffective (corrected) torque at the screw pointTaapplied torqueTavgaverage torque on the rodTfhorizontal component of rod frictionTmtorque at the end of a loading stepTmax maximum torque on the rodTminminimum torque on the rodVzpenetration velocityVqWWaWfWswqtmaxtvtztqrotation velocityeffective (corrected) load at the screw pointapplied loadvertical component of rod frictionstatic weight in SWS testinclination of maximum shear stress with respect to thehorizontalmaximum shear stress on the rodvertical shear stress on the rodvertical shear stresshorizontal shear stress on the rodIntroductionAdequate information about ground conditions is very important foranalyses, design and construction of geotechnical systems. Theconventional method for determining the soil types and properties isby laboratory testing of samples retrieved in situ. However, thelaboratory tests usually performed for the mentioned purpose havesome limitations, such as difficulty in terms of obtaining highquality undisturbed samples, modelling the real in situ stress andboundary conditions in the laboratory and being relatively expensiveand time consuming. Recently, field testing has become popular ingeotechnical engineering practice not only because it can avoidsome of the limitations and difficulties of laboratory testing (such assample disturbance and performing tests only at discrete points), butalso because of the development of better field testing techniquesand equipment as well as improved understanding of soil behaviour.Moreover, if a continuous, or nearly continuous, subsurface profileis desired for an engineering project, field investigation techniquesare commonly preferred to provide economical alternatives over thetraditional methods of sampling and laboratory testing.Downloaded by [ University of Auckland] on [30/07/18]. Published with permission by the ICE under the CC-BY license1
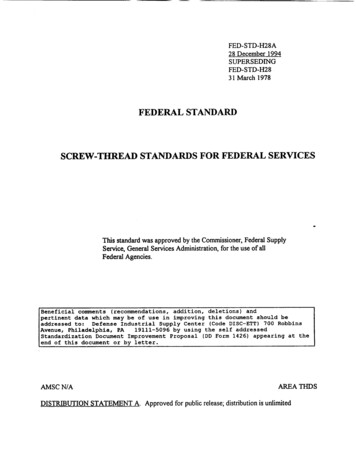
Geotechnical ResearchScrew driving sounding: a new test forfield characterisationOrense, Mirjafari and SuemasaA number of field testing techniques are available to characterisesites, and these include standard penetration tests (SPTs), conepenetration tests (CPTs) and Swedish weight sounding (SWS).Each of these tests applies specific loading patterns to measure thecorresponding soil properties (mostly in terms of resistance topenetration). Although SPT is still popular worldwide, it suffersfrom many disadvantages such as poor repeatability and nocontinuous soil profile. CPT has been the preferred choice inmany engineering projects because it gives a continuous profileand is generally not operator dependent. Although sampling is notpossible, soil type (to be more specific, soil behaviour type(SBT)) can be estimated from the data collected during the test.On the other hand, the SWS method is a highly portable andeconomical technique which provides a continuous profile of thesoil. It is used very often in Japan to evaluate the strength profilesof soil deposits for residential house construction, and it isofficially recommended as an investigation tool by the Ministry ofLand, Infrastructure and Transport (Japan).weights, making a total of 100 kilogram-force (kgf) (980 N), asshown in Figure 1(a). The field test, which can be implementedeither automatically (using a machine; see Figure 1(b)) ormanually (see Figure 1(c)), consists of two phases: (a) staticpenetration and (b) rotational penetration. During the staticpenetration phase, the screw-shaped point attached to the tip ofthe rod (weighing 49 N or 5 kgf) is statically penetrated byloading several weights (10, 10, 25, 25 and 25 kgf) on top of therod in stepwise increments until the total load reaches 100 kgf(980 N). At each load increment, the depth of static penetration ismeasured and the total weight is denoted as Wsw (kN). If thescrew point cannot penetrate under the maximum load, staticpenetration is terminated and the second phase (rotationalpenetration) is conducted. The horizontal handle attached to thetop of the rod is rotated, and the number of half-turns necessary topenetrate the rod through 25 cm is counted; this is denoted as Na.The values of Na are then multiplied by 4 and are converted to thenumber of half-turns per metre, Nsw.In this paper, a new field testing method, called screw drivingsounding (SDS), is introduced which can be utilised tocharacterise soils and sites. The SDS machine has been recentlydeveloped in Japan to improve the implementation of the SWStest, as well as to include a procedure for measuring the frictionon the sounding rod. The machine previously used for the SWStest has been modified and improved to accommodate the changesand to make it suitable for the SDS test. In conducting the SDStest, a machine drills a rod, with a screw point attached at the tip,into the ground in several loading steps while the rod iscontinuously rotated. At the same time, a number of parameters,such as torque, load and speed of penetration, are logged at everyrotation of the rod. Because these parameters are continuouslymeasured, a clear overview of the soil profile (as well as strengthvariation) throughout the depth of penetration can be obtained.While the SWS test is highly portable and simpler than othersounding tests, it has some disadvantages, such as low accuracyin classifying soils and the results are fairly influenced by the rodfriction. In cases where the soil contains gravel, the required loadto penetrate, the number of half-turns and, consequently, the soilresistance estimated from the SWS tend to be overestimated asthe rod friction becomes large.As the SDS test is relatively new, very few empirical relationshipsfor soil characterisation have been developed. For this purpose,the authors performed a total of 260 SDS tests at a variety of sitesin New Zealand (NZ), mostly at sites where CPT/SPT data orborehole logs are available, so that correlations can be made withthe SDS parameters. Moreover, soil samples (both disturbed andundisturbed) were obtained near the SDS sites and tested in thelaboratory for soil characterisation. Using the soil databaseobtained, a soil classification chart was developed and correlationswith geotechnical parameters and SPT/CPT data were establishedbased on SDS-derived parameters.Principle and test procedureSWS testBefore describing the principle behind the SDS test, a briefbackground of the SWS test is first discussed. Tsukamoto et al.(2004) describe in detail the procedure of the SWS test and theinterpretation of the results. The SWS apparatus comprises ascrew point, sounding rods, a rotating handle and six pieces of2Suemasa et al. (2005) examined the interaction between thetorque and the vertical load during SWS implementation by usingminiature SWS model equipment. From the results, they proposeda plasticity-theory-based macroelement model where theyindicated that the coefficient of yield locus, cy (which relates thenormalised torque and normalised weight applied), and thecoefficient of plastic potential, cp (which relates the normalisedhalf-turns and the torque on the rod), vary depending on the soiltype – that is, clay, loam, medium sand or dense sand. Hence,they concluded that the soil can be classified based on the dataobtained from the SWS if the torque can be measured. This led tofurther refinements of the SWS in terms of the operating systemand resulted in the development of the SDS test.SDS testThe SDS test is basically an improved system for conducting theSWS test to incorporate a procedure to measure the rod frictionand, in the process, minimise the disadvantages of the SWS. Inthe SDS test, a small portable machine is used to apply the loadmonotonically in seven steps (0·25, 0·38, 0·50, 0·63, 0·75, 0·88and 1·0 kN) – that is, the load is increased at every completerotation of the rod until a 25 cm penetration is reached. Duringthis time, the rod is always rotated at a constant rate(25 revolutions/min). After each 25 cm of penetration, the rod islifted up by 1 cm and then rotated once to measure the rodfriction. Then, it is moved down 1 cm back to its original position,and the process is repeated at every 25 cm of penetration. Theparameters measured at every complete rotation of the rod areDownloaded by [ University of Auckland] on [30/07/18]. Published with permission by the ICE under the CC-BY license
Geotechnical ResearchScrew driving sounding: a new test forfield characterisationOrense, Mirjafari and SuemasaHandle19 mmWeightRod20 mmBottomplate33·3 mm200 mmRodScrew pointScrewpoint(b)(a)(c)Figure 1. SWS equipment: (a) details of equipment and screw point (after Tsukamoto (2015)); (b) automatic implementation; (c) manualimplementationmaximum torque (Tmax), average torque (Tavg), minimum torqueon the rod (Tmin), penetration length (L), penetration velocity (Vz)and number of rotations of the rod (NSD). The procedure forperforming the SDS test is summarised in Figure 2.While SWS is usually performed manually (i.e. application ofweights and rotation of rods are done with human effort), theneed to measure torque and velocity at each step of loadingrequires the use of a machine. A machine originally used for theSWS test has been revised with some sensors added toincorporate the changes required by the SDS test. Figure 3(a)illustrates the small-scale machine used in conducting SDS; it canbe mounted on top of a crawler (see Figure 3(b)) for ease intransport and handling from one site to another. Furthermore, themachine can be disassembled and can easily fit inside a normalvan, together with the crawler.Estimation of frictionDue to the effects of friction on the measured torque and load onthe rod during penetration, the measured load and torque requiredfor penetration are greater than the values acting on the screwpoint. The rod friction that develops as the rod rotates andDownloaded by [ University of Auckland] on [30/07/18]. Published with permission by the ICE under the CC-BY license3
Geotechnical ResearchScrew driving sounding: a new test forfield characterisationOrense, Mirjafari and SuemasaThe load (Wa) and torque (Ta) applied by the SDS machine aredefined as followsStartLoad 250 N andpenetrate forone rotationAmountof penetration 25 cm?Add 125 N loadand penetratefor one rotationNoStoppenetratingYesMove up 1 cmMake onerotation andmeasure torqueNo1.W a ¼ Wf þ W2.Ta ¼ Tf þ Twhere W and T are the load and torque at the screw point,respectively. The maximum shear stress, tmax, acting on the rodbody is computed as follows3.Total load 1 kN?Move down1 cm back tooriginal positionYesContinue penetratingwith 1 kN until totalpenetration reaches25 cmRepeat for thenext 25 cmFigure 2. Test procedure for the SDS testpenetrates into the ground can be divided into a verticalcomponent (Wf) and a horizontal component (Tf) (Tanaka et al.,2012); the concept is illustrated in Figure 4(a).tmax ¼Tm2pr2 Lwhere Tm is the torque resisting the rod friction measured at theend of a loading set, r is the radius of the rod and L is the amountof penetration. Assuming that the directions of rotation velocity(Vq) and of penetration velocity (Vz) are equal to those of thehorizontal shear stress (tq) and vertical shear stress (tz) on the rodsurface, respectively (see Figure 4(b)), the expressions for theshear stresses are derived as follows4.tq ¼ tmax sin q5.tz ¼ tmax cos q(a)Figure 3. SDS equipment: (a) in action; (b) on top of a crawler4Downloaded by [ University of Auckland] on [30/07/18]. Published with permission by the ICE under the CC-BY license(b)
Screw driving sounding: a new test forfield characterisationOrense, Mirjafari and SuemasaθApplied torque(Ta)Horizontalcomponentof rod friction(Tf)Verticalcomponentof rod friction(Wf)τ, Vτz , Vz(a)(b)Figure 4. (a) Concept of friction acting on the sounding rod;(b) estimation of rod friction (Tanaka et al., 2012)q can be derived from the ratio between Vq and Vz. Bysubstituting Equation 3 into Equations 4 and 5, the vertical andhorizontal components of the rod friction are obtained as6.vqT m2Tf ¼ 2pr2 L v2v þ v2q7.vvT m2Wf ¼ 2prL qffiffiffiffiffiffiffiffiffiffiffiffiffiffiffiv2v þ v2q 2pr LDefinition of SDS parametersThe authors conducted an extensive research programme throughfield tests using SDS at various sites in NZ and obtained soilsamples at the tested sites for laboratory testing. The objectives ofthe research were as follows: (a) add data to the existing databaseof Japanese soils in order to improve the applicability of the SDSto various types of soils; (b) by comparing the SDS results withavailable data from adjacent CPT/SPT sites and/or borehole logs,provide further data for characterising NZ sites and determinetheir geotechnical properties; (c) develop empirical correlations toestimate various geotechnical design parameters directly from theSDS data; and (d) explore the possibility of using SDS-derivedparameters for soil classification and evaluation of liquefactionpotential of sandy deposits.To date, SDS tests have been performed at 260 sites all over NZ(105 in Auckland, 34 in Wellington and 121 in Christchurch). Themajority of the sounding tests were conducted within 2–5 m fromCPT/SPT sites or sites with borehole logs, as described in theNew Zealand Geotechnical Database (NZGD, 2014). For siteswhere data were not available, additional CPT tests wereconducted. In addition, undisturbed soil samples of cohesive claysand plastic silts were obtained using push tubes at fine-grainedsites (generally in Auckland) where SDS tests have beenperformed, while in SDS sandy sites (generally in Christchurch),disturbed sand samples were obtained by block sampling.A typical SDS test result is shown in Figure 5. The test wasconducted within 2 m of a CPT site and borehole. The SDS plotsillustrate the corrected torque and load (for rod friction) and thepenetration velocity at every 25 cm, up to a depth of 10 m. Alsoshown in the figure is the CPT profile (cone resistance, qc, andsleeve friction, fs) available from NZGD. Comparison of the CPTqc and measured torque in SDS indicates a good correlationbetween the two – that is, the torque required to penetrate thescrew point increases with increase in cone penetration resistance.Within a given 25 cm interval, the change in torque as loadingsteps progress with the application of load appears to increasewhen the penetration resistance is high. On the other hand, thechange in torque in a softer layer is small. Moreover, thepenetration velocity significantly decreases when a hard layer isencountered.More information can be obtained by processing the initialinformation obtained from SDS, and some of these are illustratedin Figure 6. For example, NSDD is the normalised number of halfturns and is obtained by multiplying the number of half-turns forevery 25 cm of penetration (NSD) by the outer diameter of thescrew point (D). For the profile shown in Figure 6(a), NSDD islow in the upper 3·5 m and increases below it (depth between 3·5and 5 m), reflecting the trend in the penetration resistance fromthe CPT. Another parameter, pT/WD, represents the normalisedtorque and is defined using the effective torque (T) and the weight(W) as well as the outer diameter of the screw point (D). Thevariation with depth at this specific site is shown in Figure 6(b).These two indices give an indication of the level of torquerequired to twist the rod and therefore an index for soil type. Infact, based on the plasticity theory discussed earlier, Suemasa etal. (2005) defined the ratio of these two parameters as thecoefficient of plastic potential in terms of SDS tests, cp, as follows8.cp ¼00123456789NSD DpT WDqc: MPa10Corrected W: kNCorrected T: N m060 0·00 040PenetrationSleeve friction:velocity: mm/sMPa200Depth: mτθ , VθDepth: mApplied load(Wa)Depth: mGeotechnical ResearchFigure 5. Comparison of typical SDS result (torque, load andvelocity) with CPT dataDownloaded by [ University of Auckland] on [30/07/18]. Published with permission by the ICE under the CC-BY license5
h: m0123456789100Screw driving sounding: a new test forfield characterisationOrense, Mirjafari and SuemasaDepth: mDepth: mGeotechnical ResearchDepth: mDepth: mDepth: m(a)(b)(c)AveδT: N mEs: N mm/mm3dT/dW–50 00408050 )(f)Figure 6. Additional information from SDS data variation withdepth of (a) normalised number of half-turns, NSDD;(b) normalised torque, pT/WD; (c) coefficient of plastic potential,cp; (d) change in torque with applied load, dT/dW; (e) specificenergy, Es; and (f) average change in torque, AvedTThus, cp is an indication of the difficulty of penetration. From theJapanese database, Tanaka et al. (2012) found that the value of cpvaries depending on the type of soil. They noted that the range of cpvalues for different types of soils is as follows: sand layer: 1·0; siltand clay: 0·3–1·0; and peat and organic soil: 0·3. The distributionof cp in Figure 6(c) appears to indicate generally a silt layer at depthsof up to 3·5 m and between 5 and 6·2 m and a sandy soil layerbetween 3·5 and 5 m and below 7 m; this is consistent with thedescription indicated in the borehole log. Another parameter, dT/dW,whose depth variation for this site is shown in Figure 6(d), representsthe change in torque, T, with the applied weight, W, and is thereforeanalogous to the slope of the plot of shear stress against confiningpressure in conventional laboratory testing.The combined effect of the applied load and torque during SDStest can be expressed in terms of energy – that is, the incrementalwork done, dE, by the torque and vertical load for a small rotationcan be calculated as (Suemasa et al., 2005)9.dE ¼ pTdnht þ Wdstwhere dnht is the number of incremental half-turns and dst is theincremental settlement caused at a load step. The average specific6energy, Es, is defined as the average of the penetration energy Efor different loading steps divided by the volume of penetration ofthe screw point10.Es ¼ 1 XnEi¼1 LðpD2 4 Þniwhere L is the amount of penetration, D is the maximum diameterof the screw point and n is the number of steps of loading; thisparameter is an indication of the layer stiffness (i.e. the stiffer thesoil, the more energy is required to penetrate it). As indicated inFigure 6(e), Es 10 N mm/mm3 at depths of 0–3 and 5–6 m,consistent with the assumed silt profile, and Es 10 N mm/mm3at depths perceived to be sandy.Finally, the average change in torque, AvedT, shown in Figure 6(f),is defined as11.AvedT ¼61XT Tnn i¼1 nþ1where T is the torque at each step of loading, i, and n is thenumber of load steps. Generally, AvedT is related to the soil grainsize, with high values associated with sandy soil and low valuesfor clayey soils.Soil classification chartConsidering the SDS tests performed in 38 sites in NZ which wereconducted adjacent to sites where borehole logs were available, anattempt was made to determine which SDS parameter(s) wouldcorrelate well with the type of soil (determined visually from theborehole logs) found at each depth. Hence, it was possible to comeup with a soil classification chart based purely on SDS parametersobtained during the tests. For this purpose, various SDS parameters(expressed in terms of measured torque, load, energy etc.) wereinvestigated to examine which of these best correlate with theappropriate soil types. Based on observation using NZ experience,the parameter cp and AvedT correlate well with the soil type.However, for the purpose of classification, the cp defined in Equation8 is expressed as the average value of the different loading steps andtherefore represents the average at every 25 cm penetration12.c00p 1 XnNSD D¼i¼1 pT WDniThe soil classification chart obtained based on the NZ soildatabase is shown in Figure 7.Note that in the figure, the boundary lines are drawn to separatethe data visually such that points representing similar soil typesare grouped together. Data points in region A are sandy soils,Downloaded by [ University of Auckland] on [30/07/18]. Published with permission by the ICE under the CC-BY license
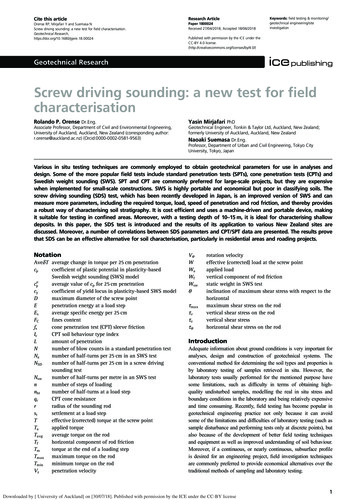
Geotechnical Researchcp′′10ClayStiff peatPlastic clay(B)Silty clay/clayey siltStiff peatSandSand with silt/silt with sand(D)SiltStiff plastic claysand layers would be considered, as the data for other types ofsoil were very limited. Thus, the soil type was first identifiedthrough the borehole log, and then comparisons were madebetween SDS and SPT on a depth-by-depth basis. Figure 8illustrates the correlation between SPT N value and specificenergy Es from SDS for 18 sandy sites in Christchurch.(A)Sand10·01–10(C)Silty sand/sand silt(E)Clay/silt0·1–8–6–4–20246810AveδT: N mFigure 7. Soil classification chart based on SDS data from NZdatabasewhich, because of their frictional nature, are expected to havehigher AvedT and cp00 values compared with the other soil types.Based on borehole log analysis, sands on the left part of theregion are finer than those on the right part. In addition, as cp00 isan indication of the difficulty in penetration, the upper part ofregion A would be denser than those on the lower part. Region Bis for stiff peat, which can be found in South Auckland; peat isconsidered as a c–f soil, and it is reasonable that it is positionedto the right side of regions D and E, both of which representcohesive soils. Region C represents sandy silt and silty sands.Soils at the bottom left of the region contain more silt than sand;therefore, this region can be considered as a transition zone froma frictional behaviour to a frictionless (cohesive) one. Soils inregion D are highly plastic stiff clays which have AvedT values 1·5 and 0 9 cp00 3. Finally, region E, where cp00 0 9,belongs to clayey silt, silty clay, silt and clay. Note that theavailable borehole data for clayey soils in the database werescarce, and more tests are planned to separate clay and silt.However, it is expected that the upper part of this region wouldrepresent stiff clay or silt, while the lower part would be for softclay.Estimation of parameters from SDS dataSPT N valueSPT is a very popular test around the world, and geotechnicalengineers have gained significant experience in designinggeotechnical structures using parameters based on SPTcorrelations. For SDS, more development based on localexperience and field observation is required to derive geotechnicalparameters from the obtained results. Thus, there is a need forreliable SDS–SPT correlation so that SDS data can be used inconjunction with available SPT design correlations.It is observed that while there is scatter in the plots, there isgenerally a linear relation between the SPT N value and specificenergy, Es. As the SPT N value increases, the soil becomes denserand the energy required to penetrate the screw point into the soilincreases.The sources of the scatter in the data points can be traced to thedifference in the penetration mechanism and the depth ofrecording points. Obviously, the penetration in SPT is dynamic,while in SDS, it is static. Also, while SDS recorded theparameters continuously along the depth (and Es was averagedevery 25 cm of penetration), the SPT N value was measured every1 or 1·5 m. In dense to medium dense sands, Es may represent theproperties of soil for a layer with thickness of even less than25 cm (due to difficulty in penetration). At some depths, theaverage of two successive 25 cm penetration was used in SDS tocompare with the SPT N value, and some outliers belonging totransition layers, identified visually by observing the trends of thetwo tests, were removed from the plot.As mentioned, this correlation is applicable only to clean sands,and more data are required to extend this relation to other types ofsoils. In addition, the maximum load and torque that the SDSmachine can apply are limited. Thus, in stiff soils, the machinecannot penetrate and the rod just simply rotates without significantpenetration and therefore the measured energy does not representthe actual stiffness of soil. Generally, based on experience, SDScan penetrate in soil layers with SPT N value 15.Fines contentFines content (FC) in sandy soil plays an important role in theengineering design of geotechnical structures, particularly when3020151050For this purpose, SDS tests were performed at sites where SPThad been conducted to compare the SDS output and measuredSPT N value. The borehole and SPT data used were obtainedfrom NZGD, and the SDS tests were conducted 2 m away fromthe preselected sites. It was deemed that only those with cleanN 0·27EsR2 0·5025SPT N100Screw driving sounding: a new test forfield characterisationOrense, Mirjafari and Suemasa02040Es: N mm/mm36080Figure 8. Plot showing the relation between SPT N value and Esof SDS (clean sand)Downloaded by [ University of Auckland] on [30/07/18]. Published with permission by the ICE under the CC-BY license7
the area is prone to earthquakes. The amount of FC significantlyinfluences the liquefaction potential of soil. In engineeringpractice, it is very common to estimate FC using the CPT data, asthis test has become the most common field test for the design ofstructures. However, experience in Christchurch showed that CPToverestimated the fines content within a soil (Van T Veen, 2015).Hence, an attempt was made to formulate a relationship betweenthe fines content and the SDS parameter(s) as an alternative to theCPT-based estimation.Screw driving sounding: a new test forfield characterisationOrense, Mirjafari and Suemasa100FC 4·84 (AveδT )2 – 46·68 AveδT 109·14R2 0·7880FC: %Geotechnical Research60402000For this purpose, samples obtained from 18 different sites wereconsidered and sieve analyses were performed on 115 samples.The particle size distribution for each sample was obtained by themethod of wet sieving described in NZS 4402.2.8 (Standards NZ,1986), with FC defined as the percentage by weight passingthrough a 63 mm sieve. As mentioned earlier, AvedT relates to thegrain size of soils; hence, a relationship between FC and AvedTwas sought. All the data are compiled and plotted in Figure 9. ForAvedT 0·2 N m, FC can be considered to be 100%; for AvedT 3·5 N m, the soil can be considered as clean sand (FC 5%).Between these ranges, the curve shows a good correlationbetween FC and AvedT.Although the graph shows a good correlation between FC andAvedT, more tests need to be performed, particularly for soilswith AvedT 3·5 N m (including silty sand, sandy silt, clayeysand and sandy clay). It should be mentioned that the plasticity offines is not taken into consideration in the plot. Furtherinvestigation needs to be done to evaluate the applicability of theproposed method when used for other soils. Currently, more testsare planned to refine the developed correlation.CPT cone tip resistanceIn order to develop a correlation between CPT and SDSparameters, SDS tests were conducted 2 m from sites withav
A number of field testing techniques are available to characterise sites, and these include standard penetration tests (SPTs), cone penetration tests (CPTs) and Swedish weight sounding (SWS). Each of these tests applies specific loading patterns to measure the corresponding soil properties (mostly in terms of resistance to penetration).