Transcription
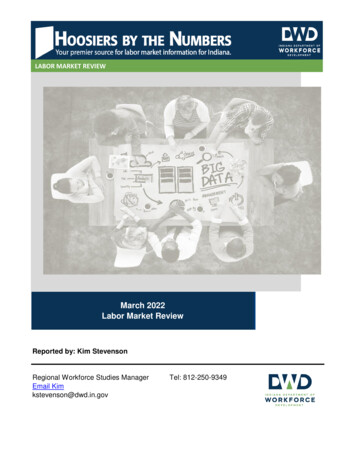
LABOR MARKET REVIEWMarch 2022Labor Market ReviewReported by: Kim StevensonRegional Workforce Studies ManagerEmail Kimkstevenson@dwd.in.govTel: 812-250-9349
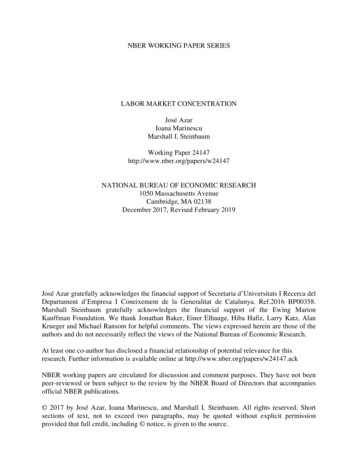
LABOR MARKET REVIEWEconomic Growth Region 7Statistical Data Report for March 2022, Released May 2022State Employment and UnemploymentUnemployment rates were lower in March in 37 states and stable in 13 states and theDistrict of Columbia, the U.S. Bureau of Labor Statistics reported. All 50 states and theDistrict had jobless rate decreases from a year earlier. The national unemploymentrate, 3.6 percent, declined by 0.2 percentage point over the month and was 2.4 pointslower than in March 2021.Nebraska and Utah had the lowest jobless rates in March, 2.0 percent each. The nextlowest rates were in Indiana, 2.2 percent, and Montana, 2.3 percent. The rates in thesefour states set new series lows, as did the rates in the following eight states (all stateseries begin in 1976): Alaska (5.0 percent), Arizona (3.3 percent), Georgia (3.1percent), Idaho (2.7 percent), Mississippi (4.2 percent), Tennessee (3.2 percent), WestVirginia (3.7 percent), and Wisconsin (2.8 percent). The District of Columbia had thehighest unemployment rate, 6.0 percent, followed by New Mexico, 5.3 percent. In total,15 states had unemployment rates lower than the U.S. figure of 3.6 percent, 13 statesand the District had higher rates, and 22 states had rates that were not appreciablydifferent from that of the nation.Nonfarm payroll employment increased in 10 states and was essentially unchanged in40 states and the District of Columbia in March 2022. Over the year, nonfarm payrollemployment increased in 49 states and the District and was essentially unchanged in 1state.Economic GrowthRegion (EGR) 7Clay, Parke, Putnam,Sullivan, Vermillion andVigo CountiesUnemployment Rates byState (seasonallyadjusted): March 2022U.S. - 3.6%The largest job gains occurred in California ( 60,200), New York ( 28,100), andMassachusetts ( 21,000). The largest percentage increases occurred in Maine andMassachusetts ( 0.6 percent each), followed by Minnesota, New Jersey, and NorthCarolina ( 0.4 percent each).Illinois - 4.7%Indiana - 2.2%Kentucky - 4%Michigan - 4.4%Ohio - 4.1%March 2022 Labor Force Estimates (not seasonally adjusted)Source: U.S. Department of Labor, Bureau ofLabor StatisticsAreaLabor ,272,12191,4752.7%2.7%4.6%EGR 795,94292,9512,9913.1%3.1%4.9%Terre HauteMSA72,50870,1282,3803.3%3.3%5.2%Clay Co.11,65111,3223292.8%2.7%4.5%#8 - Vermillion (3.5%)Unemployment Rank byCounty (of 92 counties):March 2022#7 - Sullivan (3.5%)Parke Co.6,7966,6071892.8%2.6%4.0%#12 - Vigo (3.3%)Putnam Co.16,63816,2164222.5%2.4%4.0%#30 - Clay (2.8%)Sullivan Co.7,9677,6922753.5%3.4%4.9%#32 - Parke (2.8%)Vermillion Co.6,5696,3402293.5%3.4%5.4%#49 - Putnam (2.5%)Vigo Co.46,32144,7741,5473.3%3.4%5.4%Terre Haute24,22623,4078193.4%3.3%5.9%Source: Indiana Department of Workforce Development, Research & Analysis, Local Area Unemployment Statistics Unemployment Statistics Released: 04/22 Notes:The data displayed are presented as estimates only. The most recent month's data are always preliminary and are revised when the next month's data are released.Indiana Department of Workforce Development2Source: Indiana Department of WorkforceDevelopment, Research and Analysis, Local AreaUnemployment StatisticsLabor Market Review EGR 7
Development, Research and Analysis, Local AreaUnemployment StatisticsConsumer Price Index (CPI-U Change), Unadjusted Percent Changeto March 2022 fromMar-21CPI ItemFeb-22U.S. .5%4.8%0.2%1.5%-0.3%5.5%0.5%All ItemsFood & BeveragesHousingApparelTransportationMedical CareRecreationEducation & CommunicationOther Goods & ServicesMar-21Unemployment Claims:March 2022Feb-22Midwest 6%0.6%4.3%0.3%0.0%-1.0%6.1%0.5%*Midwest region Midwest Urban Average. Midwest Region includes Illinois, Indiana, Iowa, Kansas, Michigan, Minnesota, Missouri, Nebraska, North Dakota, Ohio,South Dakota and Wisconsin Source: U.S. Bureau of Labor StatisticsRegion 7Initial Claims03/05/22 - 72(D)03/12/22 - 81(D)03/19/22 - 81(D)03/26/22 - 45(D)Continued Claims03/05/22 - 61103/12/22 - 56903/19/22 - 513Percentage of Unemployment Claims for Top 5 Region 7 Industries03/26/22 - 485March 2022Total ClaimsDistribution as a Percent of Total03/05/22 - 68303/12/22 - 650Construction42.7%03/19/22 - 59403/26/22 - 530Manufacturing12.8%State of IndianaHealth Care & Social Assistance6.5%Initial ClaimsAdministrative & Support & WasteManagement & Remediation Services03/05/22 - 3,2955.8%03/12/22 - 3,508Retail Trade03/19/22 - 3,2744.9%03/26/22 - 3,226Source: Indiana Department of Workforce Development, Research and AnalysisContinued Claims03/05/22 - 25,49003/12/22 - 23,394WARN Notices03/19/22 - 21,993WARN Notices for Region 7 for March 2022CompanyCityCounty# ofWorkersaffected03/26/22 - 21,312Notice DateTotal Claims03/05/22 - 28,78503/12/22 - 26,90203/19/22 - 25,26703/26/22 - 24,538There are no WARN Notices for March 2022 for EGR 7.Source: Indiana Department of Workforce Development, WARN Notices For information on WARN Act requirements, you may go to the U.S. Department of LaborEmployment Training Administration Fact Sheet:(D) indicates item is affected by non-disclosureissues relating to industry or ownership status Source: Indiana Department of WorkforceDevelopment, Research and rn.htmIndiana Department of Workforce Development3Labor Market Review EGR 7
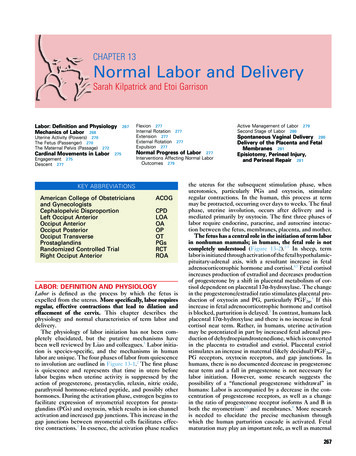
Terre Haute MSAWage and Salaried EmploymentMarch 2022# Change% Change# Change% ChangeIndustryMar-22Feb-22Mar-21Feb-22 to Mar-22Mar-21 to Mar-22Total Nonfarm66,70066,30064,6004000.6%2,1003.3%Total Private54,20053,90052,4003000.6%1,8003.4%Goods roviding53,90053,60052,4003000.6%1,5002.9%Private Service Providing41,40041,20040,2002000.5%1,2003.0%Mining, Logging and ing9,1009,0008,9001001.1%2002.3%Trade, Transportation, and Utilities12,70012,70012,40000.0%3002.4%Wholesale Trade1,7001,7001,60000.0%1006.3%Retail Trade8,6008,6008,40000.0%2002.4%Transportation, Warehousing, and 050000.0%00.0%Financial Activities2,4002,4002,40000.0%00.0%Professional and Business Services4,1004,1003,90000.0%2005.1%Education and Health Services12,10011,90011,9002001.7%2001.7%Leisure and Hospitality7,2007,2006,70000.0%5007.5%Other Services2,4002,4002,40000.0%00.0%Total Government12,50012,40012,2001000.8%3002.5%Federal Government1,1001,1001,20000.0%-100-8.3%State Government4,7004,6004,3001002.2%4009.3%Local Government6,7006,7006,70000.0%00.0%Local Government Educational Services3,4003,4003,50000.0%-100-2.9%Source: Indiana Dept. of Workforce Development, Research and Analysis, Current Employment StatisticsTerre Haute MSA Employment PRMAYJUN2020JULAUG2021SEPOCTNOVDEC2022Source: Indiana Department of Workforce Development, Research & Analysis, Current Employment Statistics Note: Historical data for the most recent 4 years (both seasonally adjusted and not seasonally adjusted) arerevised near the beginning of each calendar year, prior to the release of January estimates for statewide data.Indiana Department of Workforce Development4Labor Market Review EGR 7
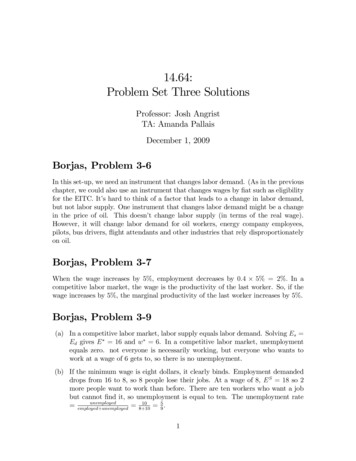
Frequently Listed JobsApplicant PoolTop 20 job listings in Region 7 in the past monthTop 20 occupations desired by applicants on their resumesin the past 12 monthsRankOccupationsOccupations# ofApplicants1Laborers and Freight, Stock, andMaterial Movers, HandProduction Workers, All Other7662Helpers--Pipelayers, Plumbers,Pipefitters, and SteamfittersAssemblers and Fabricators, All Other5913Registered NursesHelpers--Production Workers5604Nursing AssistantsCashiers5255Licensed Practical and LicensedVocational NursesCustomer Service Representatives4186Production Workers, All OtherLaborers and Freight, Stock, and MaterialMovers, Hand3027Material Moving Workers, All OtherOffice Clerks, General2688Personal Care AidesRetail Salespersons2069Dining Room and Cafeteria Attendantsand Bartender HelpersConstruction Laborers19810Medical and Health ServicesManagersWaiters and Waitresses19811Respiratory TherapistsManagers, All Other19212Home Health AidesOffice and Administrative SupportWorkers, All Other19013First-Line Supervisors ofTransportation Workers, All OtherCarpenters18714Heavy and Tractor-Trailer TruckDriversWelders, Cutters, Solderers, and Brazers18715Janitors and Cleaners, Except Maidsand Housekeeping CleanersConstruction and Related Workers, AllOther17316Cooks, Institution and CafeteriaFood Preparation Workers15717Managers, All OtherPackers and Packagers, Hand15718Merchandise Displayers and WindowTrimmersReceptionists and Information Clerks15519Retail SalespersonsJanitors and Cleaners, Except Maids andHousekeeping Cleaners14720Medical Secretaries andAdministrative AssistantsHeavy and Tractor-Trailer Truck Drivers141Source: Indiana Workforce Development, Indiana Career ConnectIndiana Department of Workforce DevelopmentSource: Indiana Workforce Development, Indiana Career Connect5Labor Market Review EGR 7
LABORUREAU SOF LABOR SIntries had more job openings than experienced unemployed. In those 10 industries, the demand for labor exceed avale xprienced labor. Inlabor.2019,averageannual averagejob openingswereinlargestin professionaland business(12019, Inannualjob openingswere largestprofessionaland businessservices services(1), hare and social assistance (1,186,000), and accommodation and food services (875,000). These three industries had only aInunemployed. In those 10 industries, the demand for labor exceeded the available supply of experienced labor. In 2019, annual average jobaverageopeningslargest in professionalbusinessservices (1,272,000),healthcareand social(1,186,000),assistance (1,186,000),openingsjobwerelargest werein professionaland businessandservices(1,272,000),healthcare andsocial assistanceandandaccommodationand foodservices(875,000).Theseindustrieshad onlyabouthalf numberthat numberof experiencedaccommodationand foodservices(875,000).Thesethreethreeindustrieshad onlyabouthalf thatof experiencedunemployed.4 Professional and business services had 647,000 experienced unemployed, healthcare and social assistance had 441,000,441,000,and accommodationfood hadserviceshad 605,000.Cumulatively,these industrieshad anannualofaverageof 3,334,000job andand accommodationand food andservices605,000.Cumulatively,these industrieshad an annualaverage3,334,000job ers.unemployedWhenjob experiencedopenings andunemployedexperiencedworkers, hecomparingnumber of thejob significantus that in 2019,there were insignificantjob opportunitiesin theseinindustries.few industriesindata tell us thatin 2019,therewerejob opportunitiesthese industries.A few industries2019 hadAmoreexperienced2019had moreonTheseaveragethan jobwereopenings.These (435,000industriesexperiencedwere construction(435,000unemployedon experiencedaverage thanunemployedjob enced318,000 jobunemployedand 318,000job openings);services(180,000 (468,000and 121,000),manufacturing(468,000and 437,000);and arts,openings); educationalservices(180,000educationaland 121,000),manufacturingand 437,000);and arts,entertainment,and recreationentertainment,and recreation(141,000121,000).Findinga job inwherethe supplyof experienced(141,000 and 121,000).Findinga job in andindustrieswherethe supplyof industriesexperiencedunemployedlaborexceeds theunemployeddemand for laborlabor isexceedsthechallengingdemand forthanlaboris likelymore challengingthanthe reverseis true.bout unemployed.4half that numberof experiencedlikely morewhenthe reverseis true.bouthalfwhenthat numberof experiencedProfessionaland businessunemployed.4Professionaland businessserviceshad 647,000unemployed,healthcareand social assistancehadservices had 647,000experiencedunemployed,healthcareand experiencedsocial assistancehad 441,000,and accommodationand foodservices had441,000,accommodationand food serviceshad 605,000.industriesan annualaverage ofunemployed3,334,000 job605,000. andCumulatively,these industrieshad an annualaverageCumulatively,of 3,334,000 thesejob openingsandhad1,693,000experiencedopeningsand 1,693,000experiencedworkers.When comparingthe numberof jobtheseopeningsandusexperiencedworkers. Whencomparingthe numberunemployedof job openingsand experiencedunemployedworkers,data tellthat in 2019, there wereunemployedthese indatatell industries.us that in 2019,were insignificantopportunitiesin theseindustries.A few industriessignificant jobworkers,opportunitiestheseA fewthereindustries2019 hadjobmoreexperiencedunemployedon averagethan job inopenings.2019more experiencedunemployedon averagethanunemployedjob openings.Theseindustrieswere ere construction(435,000experiencedand318,000job openings);educationalservices(180,000 andunemployedand 318,000(468,000job openings);educational(180,000 and121,000),manufacturingand437,000);and arts,121,000), manufacturingand 437,000);and servicesarts, entertainment,andrecreation(141,000 and(468,000121,000).Findinga n industriesentertainment,andofrecreation(141,000and 121,000).Findingthea demandn or is true.where the supplyexperiencedunemployedlabor exceedsfor laborlikelymoreofchallengingthanwhen the reverseexceedsthe demand for labor is likely more challenging than when the reverse is sa https://www.ghnfngncdsdsa Indiana Department of Workforce Development6Labor Market Review EGR 7
ghnfngncdsdsa Questions?Please contact the DWDRegional Workforce Analystlisted below:Kim StevensonResearch and AnalysisIndiana Department ofWorkforce Development30 North 8th StTerre Haute, IN 47807812-250-9349kstevenson@dwd.in.govIndiana Department of Workforce Development7Labor Market Review EGR 7
Helpers--Pipelayers, Plumbers, Pipefitters, and Steamfitters Customer Service Representatives Cashiers Occupations Applicant Pool Top 20 occupations desired by applicants on their resumes in the past 12 months Rank Occupations Frequently Listed Jobs Top 20 job listings in Region 7 in the past month Laborers and Freight, Stock, and Material .