Transcription
NBER WORKING PAPER SERIESLABOR MARKET CONCENTRATIONJosé AzarIoana MarinescuMarshall I. SteinbaumWorking Paper 24147http://www.nber.org/papers/w24147NATIONAL BUREAU OF ECONOMIC RESEARCH1050 Massachusetts AvenueCambridge, MA 02138December 2017, Revised February 2019José Azar gratefully acknowledges the financial support of Secretaria d’Universitats I Recerca delDepartament d’Empresa I Coneixement de la Generalitat de Catalunya. Ref.2016 BP00358.Marshall Steinbaum gratefully acknowledges the financial support of the Ewing MarionKauffman Foundation. We thank Jonathan Baker, Einer Elhauge, Hiba Hafiz, Larry Katz, AlanKrueger and Michael Ransom for helpful comments. The views expressed herein are those of theauthors and do not necessarily reflect the views of the National Bureau of Economic Research.At least one co-author has disclosed a financial relationship of potential relevance for thisresearch. Further information is available online at http://www.nber.org/papers/w24147.ackNBER working papers are circulated for discussion and comment purposes. They have not beenpeer-reviewed or been subject to the review by the NBER Board of Directors that accompaniesofficial NBER publications. 2017 by José Azar, Ioana Marinescu, and Marshall I. Steinbaum. All rights reserved. Shortsections of text, not to exceed two paragraphs, may be quoted without explicit permissionprovided that full credit, including notice, is given to the source.
Labor Market ConcentrationJosé Azar, Ioana Marinescu, and Marshall I. SteinbaumNBER Working Paper No. 24147December 2017, Revised February 2019JEL No. J2,J3,L1,L4ABSTRACTA product market is concentrated when a few firms dominate the market. Similarly, a labormarket is concentrated when a few firms dominate hiring in the market. Using data from theleading employment website CareerBuilder.com, we calculate labor market concentration forover 8,000 geographic-occupational labor markets in the US. Based on the DOJ-FTC horizontalmerger guidelines, the average market is highly concentrated. Using a panel IV regression, weshow that going from the 25th percentile to the 75th percentile in concentration is associated witha 17% decline in posted wages, suggesting that concentration increases labor market power.José AzarIESE Business School, Universidad de NavarraAvinguda Perason 2108034 Barcelona, Spainjazar@iese.eduIoana MarinescuUniversity of PennsylvaniaSchool of Social Policy & Practice3701 Locust WalkPhiladelphia PA, 19104-6214and NBERioma@upenn.eduMarshall I. SteinbaumRoosevelt Institute,1789 Lanier Pl, NW Apt 1Washington, DC 20009msteinbaum@gmail.com
1IntroductionThere is growing concern about increasing market concentration and its potential effects onthe economy, including increases in markups (De Loecker and Eeckhout, 2017) and the declinein the labor share (Autor et al., 2017; Barkai, 2016). Concerns about a lack of competition inthe labor market have also reached the policy debate (CEA, 2016). While interest in monopsony has grown in recent years (Ashenfelter, Farber and Ransom, 2010; Manning, 2011), firms’ability to pay workers less than their marginal productivity is not generally taken into accountin antitrust practice. Antitrust enforcement is mainly concerned with consumer welfare, andhence the impacts of a lack of competition on product prices, not wages. Antitrust enforcershave historically paid little attention to labor market power, despite the labor economics literature finding that firms can have substantial market power in the labor market (Staiger, Spetzand Phibbs, 2010; Falch, 2010; Ransom and Sims, 2010; Matsudaira, 2013). This empirical workhas generally focused on particular labor markets. Therefore it is not clear how widespreadlabor market power truly is, and how much it affects wages.In this paper, we approach this question by directly quantifying the level of labor market concentration across a wide range of occupations and for almost every commuting zonein the US. In a nutshell, we find that labor market concentration in the average market ishigh, and higher concentration is associated with significantly lower posted wages. Givenhigh concentration, mergers have the potential to significantly increase labor market power.This type of analysis could be used by antitrust agencies to assess whether mergers can createanti-competitive effects in labor markets.We measure labor market concentration using traditional measures such as the HerfindahlHirschman Index (HHI), which have the advantage that they can be compared with the thresholds in the antitrust agencies’ horizontal merger guidelines (FTC/DOJ, 2010). The same thresholds apply to seller and buyer power, as the horizontal merger guidelines state that “To evaluate whether a merger is likely to enhance market power on the buying side of the market, the1
Agencies employ essentially the framework described above for evaluating whether a mergeris likely to enhance market power on the selling side of the market.” The buying side of themarket refers to inputs markets, including the labor market. Therefore, a merger can be said toenhance market power if it results in a high level of concentration in specific labor markets.To calculate market shares in geographic and occupational labor markets, we use data fromCareerBuilder.com, the largest online job board in the United States, matching millions of workers and firms. We calculate vacancy shares and HHIs of market concentration for over 8,000labor markets, defined by a combination of occupation at the SOC-6 level and commutingzone. The occupations we cover include the most frequent occupations among CareerBuildervacancies, plus the top occupations in manufacturing and construction. We show that, on average, labor markets are highly concentrated: the average HHI is 3,157, which is above the2,500 threshold for high concentration according to the Department of Justice / Federal TradeCommission horizontal merger guidelines. Concentration varies by occupation and city, withlarger cities being less concentrated.We document a negative correlation between labor market concentration and average postedwages in that market. We then run both OLS and instrumental variables (IV) regressions ofposted wages on concentration at the market level (HHI), using quarterly panel data rangingfrom 2010 to 2013. Our instrument for the IV specification is the inverse number of postingemployers in other geographic markets for the same occupation in a given quarter. This instrument uses variation in market concentration that is driven by national-level changes in occupational hiring over time, and not by potentially endogenous changes in occupational hiringwithin a particular local market.The OLS and IV results are qualitatively similar, but quantitatively the instrumented estimates are much larger. In the baseline IV specification, the elasticity of the real wage with respect to the HHI is -0.127, while in the baseline OLS specification the elasticity is -0.038. Goingfrom the 25th to the 75th level of concentration decreases posted wages by 17% in the baselineIV specification, and by 5% in the baseline OLS specifications. The instrument we use may not2
be fully exogenous. Therefore, we allow departures from full exogeneity (Conley, Hansen andRossi, 2010): we find that the second-stage estimate of the impact of HHI on wages is boundedaway from zero as long as the direct (endogenous) effect of the instrument on wages is notmore than 75% of the reduced form effect. We thus show that the negative effect of HHI onwages is robust even for large departures from exogeneity.One might be concerned that the impact of concentration on posted wages is endogeneousdue to the relationship between the number of vacancies and concentration. The sign of the biascould be positive or negative: a decrease in labor demand can lower wages and the numberof firms hiring in the market, leading to higher concentration; a decrease in labor supply canincrease wages, and lower the number of firms hiring, also leading to higher concentration. Toalleviate this concern, we control for labor market tightness, defined as vacancies/applications(Davis and Marinescu, 2017). We find that the negative effect of concentration on wages isessentially unchanged. Overall, our results are consistent with labor market concentration creating labor market power, and hence putting downward pressure on wages.We perform a number of additional robustness checks. Most importantly, Marinescu andWolthoff (2016) show that posted wages are largely explained by job titles. Therefore, it is important to control for heterogeneity by job title to get an estimate of the impact of concentrationon wages for a given job type. When we control for job titles, the effect of concentration onwages is still highly significant and negative but smaller, suggesting that concentration maychange the composition of jobs toward lower paying jobs. We also use alternative measures oflabor market concentration, such as the inverse of the number of hiring firms, or market concentration as measured by the number of applications: these alternative measures also yield anegative and highly significant impact of labor market concentration on posted wages.This paper provides for the first time to our knowledge a measure of labor market concentration for many of the largest labor markets in the US. Our measure of concentration is distinctfrom the industry concentration measures used by Autor et al. (2017) and Barkai (2016): it is3
based on concentration in the labor market rather than concentration in the product market.1Our contribution is therefore complementary: while those authors show that product marketconcentration is associated with a lower labor share, we show that labor market concentrationis associated with lower posted wages.The papers that come closest to ours in approach are Benmelech, Bergman and Kim (2018)and Rinz (2018), which build on the present article by studying concentration of employmentin labor markets defined by geography and industry, using Census data on employment byfirms and establishments.The monopsony literature in labor economics approaches the issue of market power throughquestions such as the impact of the minimum wage and unionization. This literature focuseson the elasticity of labor supply to the individual firm, as opposed to market concentration2 . Insuch “New Monopsony” models, employers trade off wages with their employees’ quit rates,and they face an upward-sloping supply curve due to search frictions, firm-specific amenities,and limited geographic mobility of workers, in addition to other mechanisms. If workers havea high labor supply elasticity, then firms pay them more to get them to stay. The literaturegenerally finds low elasticities of labor supply and interprets this as evidence for firm-levelmonopsony power to reduce wages below the marginal product of labor (Webber, 2015; Dubeet al., 2019).Our approach is complementary to this literature, but with a different mechanism at play.We measure market-level concentration in local and occupational labor markets, implicitlyarising from restrictions to employer entry or other characteristics of firms or industries, asopposed to characteristics of workers. In our framework, firms pay higher wages if the labormarket is unconcentrated and workers can expect abundant job offers from competing employers.1 Toour knowledge, the last published measurement of labor market concentration is Bunting (1962). Boal andRansom (1997) reviewed the literature.2 An older literature has explored the impact of labor market concentration on wages. However, this literatureis mostly limited to teachers’ and nurses’ markets and uses cross-sectional identification, as discussed in Boal andRansom (1997).4
Buyer-side market power caused by concentration and the upward-sloping firm-level laborsupply curve are mutually-reinforcing mechanisms for monopsony power and for the empirical findings from the aforementioned labor literature, such as the small effect of minimumwage increases on employment.The remainder of the paper is organized as follows. Section 2 describes the data, and ourmeasure of labor market concentration. Section 3 analyzes the relationship between labor market concentration and posted wages. Section 4 performs robustness tests and addresses remaining limitations. Finally, section 5 concludes.2Measuring labor market concentration2.1DataWe use proprietary data from CareerBuilder, which is the largest online job board in theUnited States. The site received approximately 11 million unique job seeker visits in January2011. Job seekers can use the site for free, while firms seeking to hire workers must pay a fee ofseveral hundred dollars to post a job opening for one month. The total number of vacancies onCareerBuilder.com represents 35% of the total number of vacancies in the US in January 2011as counted in the Job Openings and Labor Turnover Survey. The dataset used here was firstused in Davis and Marinescu (2017). Occupations were selected based on counts of jobs postedbetween 2009 and 2012 on CareerBuilder: at the broad SOC level, i.e. SOC-5 digits, the 13 mostfrequent occupations were selected. We also added the three most frequent occupations inmanufacturing and construction (17-2110, 47-1010, 51-1010). The full list of SOC-6 occupationsis as follows: 11-3011 Administrative services managers 13-2011 Accountants and Auditors5
13-2051 Financial Analysts 13-2052 Personal financial advisers 13-2053 Insurance Underwriters 13-2061 Financial Examiners 15-1041 Computer support specialists 17-2111 Health and Safety Engineers, Except Mining Safety Engineers and Inspectors 17-2112 Industrial engineers 29-1111 Registered nurses 41-4011 Sales representatives, wholesale & manufacturing, technical & scientific products 41-9041 Telemarketers 43-3031 Bookkeeping, accounting, and auditing clerks 43-4051 Customer service representatives 43-6011 Executive secretaries and administrative assistants 43-6012 Legal Secretaries 43-6013 Medical secretaries 43-6014 Secretaries and Administrative Assistants, Except Legal, Medical, and Executive 47-1011 First-Line Supervisors of Construction Trades and Extraction Workers 49-3041 Farm equipment mechanics 49-3042 Mobile Heavy Equipment Mechanics, Except Engines6
49-3043 Rail Car Repairers 51-1011 First-line supervisors/managers of production and operating workers 53-3031 Driver/sales workers 53-3032 Truck drivers, heavy and tractor-trailer 53-3033 Light Truck or Delivery Services DriversOur data includes, for each vacancy, the number of applicants. This allows us to calculate labor market tightness at the occupation by local labor market level as (number of vacancies)/(number of applications).Only about 20% of the CareerBuilder vacancies post salary information. The posted wageis converted into an annual salary if it is hourly. The posted wage is defined as the middle ofthe range if the vacancy posts a range rather than a single value. We estimate posted wages fora given market and year-quarter as the simple average of the posted wage in the wage-postingvacancies. Figure 1 shows the distribution of log real wages across markets and year-quarters.The distribution is bi-modal and there are a small number of outliers on the left and the rightsides of the distribution.2.2Labor market definitionGiven that monopsony power in labor markets has not been a focus of antitrust policy, thecrucial question of how to define the relevant market for antitrust analysis is relatively unexplored in the literature. The twin imperatives contained in the Horizontal Merger Guidelinesare that markets be defined in terms of “lines of commerce” and “section of the country.”Marinescu and Rathelot (2018) show that applications to a job decline rapidly with distance,although most applications are still outside the applicant’s zip code. It is therefore key to definelabor markets geographically to obtain meaningful measures of market concentration. For our7
baseline analysis, we use commuting zones (CZs) to define geographic labor markets. Commuting zones are geographic area definitions based on clusters of counties that were developedby the United States Department of Agriculture (USDA) using data from the 2000 Census oncommuting patterns across counties to capture local economies and local labor markets in away that is more economically meaningful than county boundaries. According to the USDAdocumentation, “commuting zones were developed without regard to a minimum populationthreshold and are intended to be a spatial measure of the local labor market.” Marinescu andRathelot (2018) also show that 81% of applications on CareerBuilder.com are within the commuting zone, and Manning and Petrongolo (2017) similarly find that labor market searchesare local in UK data, and Bartik (2018) finds evidence against full worker mobility across commuting zones. We conduct robustness checks using single counties for our geographic marketdefinition instead of commuting zones.When it comes to defining the analog to “line of commerce” in labor markets, the economicliterature shows that there are substantial frictions associated with transitioning between jobs(Artuc, Chaudhuri and McLaren, 2010; Dix-Caneiro, 2014; Artuc and McLaren, 2015; Traiberman, 2017; Macaluso, 2017). No work, to our knowledge, attempts to define labor markets inthe education space. Macaluso (2017) defines the concept of "skill remoteness" on the supplyand demand sides of a labor market and finds that workers whose skills are further away fromthe available jobs in their local labor market (defined by city and occupation) are more likelyto either move or exit the labor force in response to a layoff. Hershbein and Kahn (2016) andModestino, Shoag and Ballance (2016) characterize the skill distribution of job vacancies aschanging in response to the severity of local labor market recessions. But the extent to whichworkers confine their job searches to an education- or skills-delimited segment of available jobshas not yet been systematically explored (but see some evidence on search across occupationsin Marinescu and Rathelot (2018)).Using the a vacancies dataset from the same source as the one used in this paper, Marinescuand Wolthoff (2016) show that, within a 6-digit SOC, the elasticity of applications with respect8
to wages is negative. Therefore, the 6-digit SOC is likely too broad to be a labor market, since wewould expect applications to increase in response to posted wages in a frictional labor market(see Subsection 3.3 below). Nonetheless, we consider SOC-6 occupation to be a conservativebenchmark, with the understanding that concentration measured within labor markets definedthat way is likely to be an under-estimate.We calculate labor market concentration using posted vacancies and applications to thosevacancies. Concentration could also be computed using observed employment (albeit not withthis dataset). The concentration of employment is almost certainly lower than the concentration of vacancies–only a subset of the firms in a given labor market (defined by geographyand occupation) will be hiring at any given time. But our measure of concentration based onvacancies is more relevant for active job seekers, especially in light of evidence of lengtheningjob tenures, which implies that a given position will remain filled for longer (Hyatt and Spletzer, 2016). Moreover, our results about the effect of concentration on wages are estimated fromvariation in concentration over time within a labor market, and in our robustness checks we aggregate vacancy postings over time, which reduces observed concentration levels–toward whatwe would probably observe if concentration were computed from firm-level employment.We do our analysis at the quarterly level, since the median duration of unemployment wasabout 10 weeks in 2016 BLS (2017). We consider for our market share calculations all vacanciesor applications that occur within a given quarter, including vacancies with missing wages.2.3Measuring concentrationWe keep an unbalanced panel of 61,017 CZ-occupation-year-quarter observations, covering the period 2010Q1-2013Q4, 681 commuting zones, and 26 SOC 6-digit occupations. Thesemarkets all include at least one vacancy with a posted wage.Our baseline measure of market power in a labor market is the Herfindahl-Hirschman Index (HHI) calculated based on the share of vacancies of all the firms that post vacancies in9
that market.3 The HHI is widely used as a measure of market concentration in the industrialorganization literature and in antitrust practice. An advantage of this measure of market concentration is that there are guidelines for what represents a high level of market concentration.The DOJ/FTC guidelines: an HHI above 1500 is "moderately concentrated", and above 2500 is"highly concentrated". An HHI of 2,500 occurs when four employers have equal shares of thevacancies in a labor market. A merger that increases the HHI by more than 200 points, leadingto a highly concentrated market is "presumed likely to increase market power".While these measures and thresholds are generally used to evaluate market concentrationin product markets, the antitrust agency guidelines state that “[t]o evaluate whether a mergeris likely to enhance market power on the buying side of the market, the Agencies employessentially the framework describe above for evaluating whether a merger is likely to enhancemarket power on the selling side of the market.” This implies that adverse effects of mergers onthe inputs market, including the labor market, are part of the legal framework for evaluatingmergers.The formula for the HHI in market m and year-quarter t isJHHIm,t s2j,m,t(2.1)j 1where s j,m is the market share of firm j in market m. For the HHI based on vacancies, themarket share of a firm in a given market and year-quarter is defined as the sum of vacanciesposted in CareerBuilder by a given firm in a given market and year-quarter divided by totalvacancies posted in the website in that market and year-quarter. We treat all vacancies postedby a recruiting / staffing firm as belonging to the same firm, since we cannot observe whichfirm the recruiting / staffing firm is hiring for.In addition to calculating HHIs for each labor market based on shares of vacancies, we3 Byconfining this investigation to only the largest online job board, CareerBuilder, we add another dimensionto market definition, that of the search platform. If workers search for jobs across multiple platforms, this mightyield an excessive concentration estimate, but if most users use only one platform, then that concern would bemitigated.10
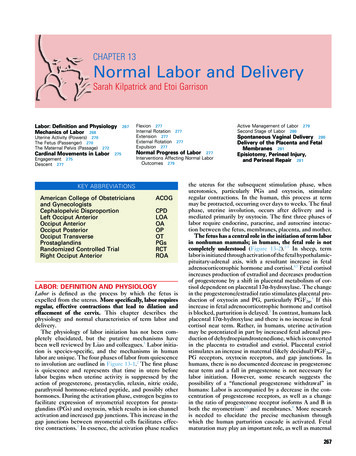
also calculated HHIs based on shares of applications (more specifically Expressions of Interest,i.e. clicking on the button "Apply now"). For the HHI based on applications, we define themarket share of a firm in a given market and year-quarter as the sum of applications throughthe website to a given firm in a given market and year-quarter divided by the total number ofapplications to all firms in that market and year-quarter.Table 1 shows summary statistics of the main variables used in our analysis. The averagereal wage was 41,547 USD (in 2009 dollars). The average market in our sample had 20 firms, 83vacancies, 441,156 searches, and 3,612 applications. The average HHI based on vacancies was3,157. The average HHI based on applications was somewhat higher: 3,480, reflecting the factthat not all vacancies received the same level of interest from job seekers.Table 1 also shows that the average HHI calculated using shorter time periods than the quarter is higher, and the HHI using longer time periods is lower but still highly concentrated. Thepopulation-weighted quarterly HHI is lower and moderately concentrated. As would be expected, county-level HHIs are higher than CZ-level HHIs, and state-level HHIs are lower thanCZ-level HHIs. With the exception of a state-level definition of the labor market, all alternativedefinitions still show moderate to high concentration.Figure 2 shows a map of all the commuting zones in the United States color-coded by theaverage HHI, based on vacancy shares. Commuting zones around large cities tend to havelower levels of labor market concentration than smaller cities or rural areas. This suggestsa new explanation for the city-wage premium (Yankow, 2006; Baum-Snow and Pavan, 2012):cities, and especially large cities, tend to have less concentrated labor markets than rural areas.4Figure 3 shows the distribution of the HHIs based on vacancies and of the HHI based onapplications in our sample. Under both definitions for market shares, the median market ismoderately concentrated, while the average market is highly concentrated.Figure 4 shows the average HHI, based on vacancy shares, by 6-digit SOC occupation.The occupations that are least concentrated on average are "Customer service representatives",4 Manning(2010) shows evidence on plant size that is consistent with lower monopsony power in cities.11
"Sales representatives, wholesale and manufacturing, technical and scientific products", and"Registered nurses", each with an average HHI of around 2,000. The occupations that are mostconcentrated on average are "Farm equipment mechanics", "Rail car repairers", and "Light truckor delivery services drivers", each with an average HHI well above 5,000 (which is the level ofconcentration of a symmetric duopsony market).In summary, we find that reasonably defined local labor markets are highly concentratedon average. A limitation of our analysis is that we only use vacancies posted on the CareerBuilder website.5 Given that CareerBuilder is the largest job-posting website in the UnitedStates, the high level of concentration was somewhat surprising to us, especially given thatmany economists’ prior seems to be that labor market monopsony power, if it exists at all, isdue primarily to search frictions. Our findings can, however, be consistent with the search frictions story, in the sense that if we consider a longer time period the market is less concentrated(Table 1). Also, while the CareerBuilder website does not contain all vacancies, it is likely that,for job seekers who use it, the site is a main source of information on the labor market.3Concentration and wagesFigure 5 shows a binned scatter plot of the log real wage and log HHI based on vacancies.The two variables are strongly correlated and the association is close to log-linear. AppendixFigure 6 shows a similar relationship between the real wage and market concentration obtainswhen using the log HHI based on applications instead of the log HHI based on vacancies.This negative correlation between market concentration and real wages is consistent withstandard oligopsony theory, which predicts that firms in more concentrated labor marketsshould be able to pay workers wages below their marginal product. Of course, we cannotinfer a causal relationship from this correlation alone. It could be driven, for example, by thefact that larger cities tend to have both a higher number of firms and higher wages, perhaps5 Thisis less of an issue for interpreting the within-market variation over time in concentration, which is thebasis for the regression analysis in the following section.12
due to a higher cost of living. To address this issue, we conduct panel regressions that control for commuting zone by occupation effects, and identify the effect purely from variation inconcentration and wages over time within a given commuting zone-occupation pair.3.1Empirical specification: OLS and IVOur baseline specification is the following:log(wm,t ) β · log HHIm,t γ · Xm,t αt νm ε m,t ,(3.1)where log(w) is the log real wage in market m in year-quarter t, log HHIm,t is the correspondinglog HHI, Xm,t is a set of controls, and αt and δm are year-quarter and market (commuting zoneoccupation) fixed effects and em,t is an error term.We run a first specification with just year-quarter fixed effects. We then add successivelymarket (CZ by SOC-6) fixed effects and log tightness (defined as the number of vacancies divided by the number of applications in a labor market) in the commuting zone and occupationfor a given year-quarter. We then run a fourth specification further controlling for year-quarterby commuting zone, and finally we also add year-quarter by SOC fixed effects in a fifth specification, to control for any possible changes in the characteristics of the commuting zone or theoccupation over time. We cluster standard errors at the commuting zone-occupation level.The key threat to identification is that there is a time-varying market-specific variable that iscorrelated with HHI and drives wages. According to search and matching theory, posted wagesare determined by labor market tightness, productivity and the worker’s out-of-work benefit(Rogerson, Shimer and Wright, 2005). We already control for labor market tightness. Sinceunemployment benefits are determined at the state level, we are able to control for workers’out-of-work benefits by controlling for market fixed effects, and, in some specifications marketby time fixed effects. Therefore, the main threat to identification is time-varying market-specificproductivity changes.13
To further address the issue of the endogeneity of HHI, we instrument the HHI with the average of log(1/N ) in other commuting zones for the same occupation and time period (whereN refers to the number of firms in the market). That is, for each commuting zone-occupationtime period combination, we calculate the average of log(1/N ) for the same occupation forevery other commuting zone. We use log(1/N ) instead of HH I as the instrument because itis less likely to be endogenous, as it does not depend on market shares. This provides
Labor Market Concentration José Azar, Ioana Marinescu, and Marshall I. Steinbaum NBER Working Paper No. 24147 December 2017, Revised February 2019 JEL No. J2,J3,L1,L4 ABSTRACT A product market is concentrated when a few firms dominate the market. Similarly, a labor market is concentrated when a few firms dominate hiring in the market.