Transcription
ACCC CommunicationsMarket Report 2017–18February 2019accc.gov.au
ISBN 978 1 920702 42 7Australian Competition and Consumer Commission23 Marcus Clarke Street, Canberra, Australian Capital Territory, 2601 Commonwealth of Australia 2019This work is copyright. In addition to any use permitted under the Copyright Act 1968, all material contained within this work is providedunder a Creative Commons Attribution 3.0 Australia licence, with the exception of: the Commonwealth Coat of Arms the ACCC and AER logos any illustration, diagram, photograph or graphic over which the Australian Competition and Consumer Commission does not holdcopyright, but which may be part of or contained within this publication.The details of the relevant licence conditions are available on the Creative Commons website, as is the full legal code for the CC BY 3.0AU licence.Requests and inquiries concerning reproduction and rights should be addressed to the Director, Content and Digital Services, ACCC,GPO Box 3131, Canberra ACT 2601.Important noticeThe information in this publication is for general guidance only. It does not constitute legal or other professional advice, and should notbe relied on as a statement of the law in any jurisdiction. Because it is intended only as a general guide, it may contain generalisations.You should obtain professional advice if you have any specific concern.The ACCC has made every reasonable effort to provide current and accurate information, but it does not make any guarantees regardingthe accuracy, currency or completeness of that information.Parties who wish to re-publish or otherwise use the information in this publication must check this information for currency and accuracyprior to publication. This should be done prior to each publication edition, as ACCC guidance and relevant transitional legislationfrequently change. Any queries parties have should be addressed to the Director, Content and Digital Services, ACCC, GPO Box 3131,Canberra ACT 2601.ACCC 02/19 1440www.accc.gov.au
ContentsGlossaryivTypes of internet access platformsviii1.Executive summary2.Competition indicators2.1 Wholesale market indicators2.2 Retail market indicators2.3 Consumer trends and related issues9917383.ACCC activities in communications3.1 Access to telecommunications networks3.2 National Broadband Network3.3 Structural separation of Telstra3.4 NBN migration activities3.5 Monitoring and reporting3.6 Enforcement and compliance activities3.7 Anti-competitive conduct3.8 Merger, authorisation and third line forcing reviews3.9 Advice, advocacy and contributions to policy processes464647494950515254564.AppendixesAppendix 4.1:Appendix 4.2:Appendix 4.3:Appendix 4.4:Appendix 4.5:Appendix 4.6:160Access to telecommunications services60NBN and non-NBN superfast services regulatory frameworks62Telstra’s structural separation and other Telecommunications Act provisions 63Record keeping rules (RKR)66Price monitoring methodology: calculating real changes in weighted averageprices through a ‘plan matching’ approach67Price monitoring methodology: calculating real changes in weighted averageprices through a ‘hedonic’ approach71ACCC Communications Market Report 2017–18iii
Glossary2G/3G/4G/5G second/third/fourth/fifth generation mobile communicationsivABSAustralian Bureau of StatisticsACCCAustralian Competition and Consumer CommissionACLAustralian Consumer LawACMAAustralian Communications and Media AuthorityADSLasymmetric digital subscriber lineAGVCaggregated virtual circuitAVCaccess virtual circuitBROCbinding rule of conductCANcustomer access networkCCACompetition and Consumer Act 2010CVCconnectivity virtual circuitDSLdigital subscriber lineDSLAMdigital subscriber line access multiplexerDTCSdomestic transmission capacity serviceESAexchange service areaFADfinal access determinationFOASfixed originating access serviceFoxtelFoxtel Management Pty LimitedFTASfixed terminating access serviceFTTBfibre to the basementFTTCfibre to the curbFTTNfibre to the nodeFTTPfibre to the premisesGBgigabyteGHzgigahertzHFChybrid fibre coaxialiiNetiiNet LimitedITOIn-Train OrderLBASlocal bitstream access serviceLCSlocal carriage serviceLSSline sharing serviceMBAMeasuring Broadband AustraliaMbpsmegabits per secondACCC Communications Market Report 2017–18
MHzmegahertzMNOmobile network operatorMTASmobile terminating access serviceMTMmulti-technology mixMVNOmobile virtual network operatorNBNnational broadband networkNBN CoNational Broadband Network Co Limited (also referred to as nbn)NNInetwork-to-network interfaceOptusSingtel Optus Pty LimitedOTTover-the-topPDBPremium Direct BillingPOIpoint of interconnectionRAFregulatory accounting frameworkRKRrecord keeping ruleRSPretail service providerSAUspecial access undertakingSBASsuperfast broadband access serviceSCRService Continuity RegionsSFAAstandard form of access agreementSIOservice in operationSMSshort message serviceSSUstructural separation undertakingTBterabyteTCPTelecommunications Consumer ProtectionTelstraTelstra Corporation LimitedTEMTelstra Economic ModelTIOTelecommunications Industry OmbudsmanTPG GroupTPG Telecom LimitedULLSunconditioned local loop serviceVDSLvery high bit rate digital subscriber lineVHAVodafone Hutchison Australia Pty LimitedVocus GroupVocus Communications LimitedVoIPvoice over internet protocolWLRwholesale line rentalACCC Communications Market Report 2017–18v
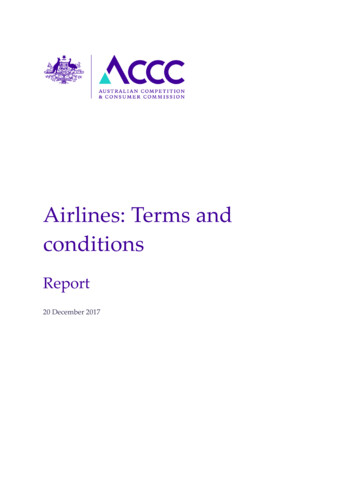
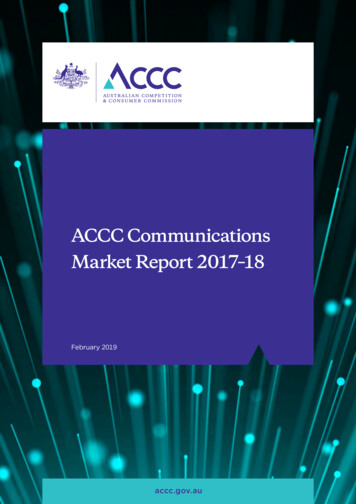
Competition and price changes intelecommunications services in Australia2017–181.5%Fixedbroadband3.5%Annual price decreaseFive year averageannual price decrease*8.3%Mobile phoneservices8.3%Annual price decreaseFive year averageannual price decrease*7.5%Mobilebroadband5.6%Annual price decreaseFive year averageannual price decrease*40%Proportion of all planswith unlimited data(up from 5% in 2013–14)172%Increase indata allowance33%Increase indata allowanceProportion of total downloadsGrowth indata downloadsMobile handset29%Wireless* compound annual price decrease 2013–14 to 2017–18vi91%FixedACCC Communications Market Report 2017–186%3%
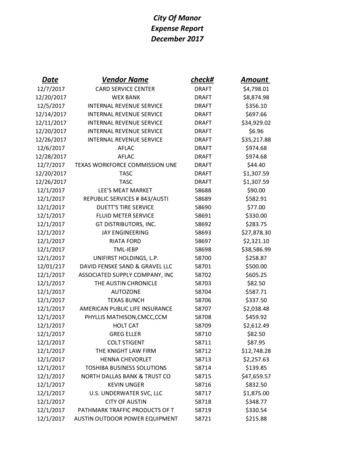
NBN activationsincreased2.4mTelstra legacy coppernetwork declined4m7.5m6mKey ACCC projectsCommunicationssector market studyMobile roaminginquiryDigital platformsinquiryNBN relatedSpeeds claimsguidanceMeasuringBroadband AustraliaEnforcementactionNBN servicestandards inquirySourcesACCC record keeping rules and estimates based on publicly available informationTelstra Economic Model (public version)ABS, Internet Activity (8153.0)NBN Co, National Broadband Network – Rollout InformationACCC Communications Market Report 2017–18vii
Types of internet access platformsDSL, including asymmetric digital subscriber line (ADSL), uses the copper access network to providean internet service. DSL operates at higher frequencies than voice services, and therefore is a form ofbroadband which operates independently of and simultaneously with the provision of traditional voiceservices over the same copper pair.ADSL2 is a DSL technology commonly used in the current network to provide high data rates overcopper pair telephone lines up to about 4 km in length. It is typically installed in telephone exchanges oralternatively in nodes closer to the end customers. The downlink data rate is usually significantly greaterthan the uplink data rate.Very high bit rate digital subscriber line 2 (VDSL2) is a DSL technology used to provide high data ratesover copper pair telephone lines of up to about 1 km in length. It is typically used in fibre to the node(FTTN) or fibre to the basement (FTTB) deployments. It can also include vectoring to help remove theimpact of crosstalk from one copper line to others. It is able to provide symmetric data services.Hybrid fibre coaxial (HFC) cable is a combination of optical fibre and coaxial cable, which can be usedto provide high data rate broadband services, in addition to pay TV and voice services.Fibre refers to optical fibre which can be used to provide high data rate broadband services bytransmitting information as light pulses.Wi-Fi is a technology for wireless local area networking.Wireless broadband services are offered through both mobile and fixed wireless retail services: Mobile broadband services have evolved from mobile phone technology, which uses variousportions of the radio frequency spectrum. Mobile network technologies allow users to both movebetween geographic areas or cells and roam between different mobile networks. Users can accessmobile broadband networks using 3G or 4G voice handsets or non-voice service equipment such asUSB modems or datacards. Fixed wireless networks use similar technology to that used in mobile networks. Significantly higherdata rates and/or longer transmission distances can be attained from these networks by using fixeddirectional antenna only (that is, mobility is not supported by these networks).Satellite broadband uses satellites to relay data signals sent and received via a satellite dish by isolatedend users to and from a ground station connected to a broadband network.viiiACCC Communications Market Report 2017–18
1.Executive summaryCommunication services are important enablers of an increasingly digital world where an exponentiallyincreasing number of transactions and experiences are undertaken online, either voluntarily or as arequirement of the supplier of services. Connectivity thus becomes very important for a wide range ofeconomic and social purposes.Pervasive connectivity and the continuing rise of data consumption accelerate the extent and impactof digital disruptions across an array of service markets. This includes markets beyond those we havetraditionally considered ‘telecommunications’ but where communication services play an importantrole, and has led to the ACCC considering competition and consumer issues in new areas such asexamining the market power of digital intermediaries (through our digital platforms inquiry) and accessto consumer data as an enabler of consumer choice (through our consumer data right work).The communications industry and public sector are meeting the requirement for increased connectivitythrough ongoing investment including in 5G and most significantly with the deployment of the nationalbroadband network (NBN), the completion of which will significantly enhance fixed line connectivityin Australia.The increasing importance of connectivity is a worldwide trend and a number of ongoing trends incommunication markets in Australia reflect developments that are also occurring internationally andhave continued in 2017–18, as outlined below.A number of trends in communication markets continuedin 2017–18Real prices of telecommunications services continued to decline acrossmost categoriesReal prices fell in 2017–18 across most categories. An average consumer renewing their fixedbroadband plan would have paid 1.5 per cent less in real terms and 8.3 per cent less when renewingtheir mobile phone plan compared to 2016–17. These declines take into account improvements in nonprice characteristics, such as data allowances and other inclusions.NBN prices reduced by 4 per cent while non-NBN fixed broadband prices increased slightly, in realterms, by 0.5 per cent. The decline in mobile phone service prices in 2017–18 continues a trend over thepast five years with real prices approximately 30 per cent lower in 2017–18 than they were in 2013–14.Overall in the past five years, there have been real price declines across all categories since 2013–14, asset out in table 1.1.ACCC Communications Market Report 2017–181
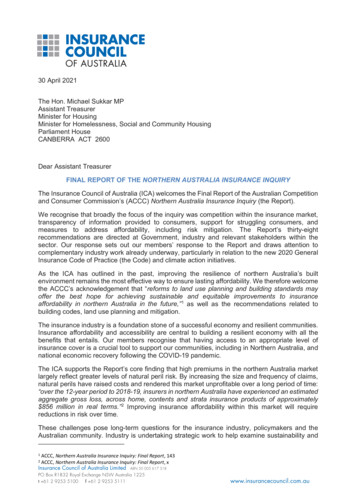
Table 1.1:Real changes in average pricesAdjusted for non-price characteristics, consumer spending patterns, and l fixed –6.0%–4.6%–4.2%–7.5%–5.6%Post-paid mobilePrepaid mobileTotal mobile phone servicesMobile broadbandData consumption continued its inexorable rise, supported by increasingdata allowancesData downloads continue to grow via all access technologies. The total volume downloaded increasedby 29 per cent over 2017–18 (measured between the June 2017 and 2018 quarters), likely reflectingan increased use of content streaming services, social media and other content-rich applications. Theincrease was higher for data downloaded by mobile handsets, up 45 per cent, compared to fixedbroadband at 27 per cent. Notwithstanding, fixed access technologies continue to account for the vastmajority of data downloaded (91 per cent).Retail service providers (RSPs) are competing with each other to respond to this demand by increasingdata allowances (which in turn can facilitate increased usage)—in the order of 172 per cent in the case ofmobile—and increasing the prevalence of plans with no hard data limits.On the fixed network, the proportion of unlimited broadband plans increased from 24 per cent to40 per cent (whereas five years ago it was 5 per cent). In mobile, certain mobile network operators(MNO) launched mobile phone plans without hard data limits or excess charges, which instead offerfull speeds up to a certain number of gigabytes (GB) and reduced speeds thereafter. Both of thesetrends show providers are following the international experience, where especially for fixed broadband,unlimited plans tend to be the norm.The significant upwards trend in mobile data allowances in recent years is illustrated in figure 1.1.Average mobile data allowances for post-paid mobile post-paid mobile phone plans increased by91 per cent to 14.2GB between 2016–17 and 2017–18, while prepaid mobile services experienced anincrease of 153 percent to 11.5 GB over the same period.2ACCC Communications Market Report 2017–18
Figure 1.1:Average data allowance, post-paid and prepaid mobile services, 2014–15 to 2017–1816Average data allowance –172017–18prepaidContinued investment in network capacity driven by competitionNetwork operators are responding to the growing demand for connectivity and resulting increase indata consumption. This includes putting in place upgrade paths to the latest technologies that providesignificant additional capacity. For example, the National Broadband Network Co Limited (NBN Co)is spending significant amounts of capital to upgrade to the latest technologies and standards suchas DOCSIS 3.1 (hybrid fibre coaxial—(HFC)), and in future, Gfast (fibre to the curb—(FTTC)) as well asupgrading its fixed wireless network. MNOs are investing in the later stages of 4G and on the path todeploying 5G in the next year.Such investment is driven by competition—network operators and RSPs know that they must havesufficient capacity to meet end users demands—including demand for streaming content, or risk losingcustomers to competitors. This is evidenced on the fixed network by the results of our MeasuringBroadband Australia (MBA) program, which show that RSPs are typically delivering close to 90 per centof maximum plan speeds, with speeds not significantly reducing during busy evening hours (7 pm to11 pm) when consumers are using their internet services the most.Consumers increasingly substituting traditional fixed voice calls withmobile voice and other communication, as voice becomes just anotherapplicationThe ongoing decline in the usage of fixed voice services continued. While the number of fixed linesfell gradually, from 8.8 to 8.3 million, there was a substantial fall in the number of voice call minutesoriginating from fixed line networks—from 16 to 12 billion.In previous years, declines in fixed voice minutes have been more than offset by an increase in mobilevoice minutes, such that total voice minutes consistently increased. However, in 2017–18 it was notablethat the number of mobile voice minutes did not increase—despite the widespread prevalence ofunlimited calls—but remained steady at about 66 billion. This is likely to reflect not just consumers’increasing use of over-the-top (OTT) voice applications such as Skype and WhatsApp, but also a shiftaway from voice towards other forms of communication especially for younger demographics.ACCC Communications Market Report 2017–183
The transition of legacy services to the NBN continues,but some may move to mobileNBN rollout continues towards completion as the focus shifts to theoperational phaseNBN deployment and activations accelerated sharply during the year, with almost 8.1 million premisespassed, seven million ready to connect and over four million activations by 30 June 2018. The NBNrollout has had a particularly important impact in regional areas, where it typically represents a stepchange in broadband services. In fact, regional areas account for the majority of active NBN servicestoday, at 55 per cent.Consumers benefit from structural reformThe NBN also heralds a more competitive environment as fixed line services migrate to a wholesale-onlyaccess network, which represents a major structural reform in the communications industry. Althoughthe majority of services still remain on the legacy networks (HFC and digital subscriber line (DSL)), thenumber of legacy DSL services was overtaken by NBN services during the year, with over 3.6 millionfixed line NBN subscribers compared to 3.2 million on DSL.This structural reform is already delivering important outcomes for consumers, with Telstra CorporationLimited (Telstra)’s fixed broadband retail plans showing a marked increase in value over the past threeyears, as Telstra has transitioned its business to meet heightened competition.On the other hand, migration to the NBN can potentially disrupt broadband users. The ACCC approveda number of additional protections for businesses, and consumers on the NBN HFC and FTTCnetworks, which Telstra had developed in consultation with NBN Co and other service providers.NBN faces potential challenge from wireless, particularly at the lower endFor both fixed voice and broadband services, the compulsory migration to the NBN represents a keydecision point for end users as to whether they continue to take fixed voice and broadband services orreplace either or both with mobile services. This calculation depends on both end users’ preferences forthe type of service they want, as well as the relative cost and service experience of the NBN comparedto mobile alternatives.At this stage, there remains uncertainty as to the level of fixed to mobile substitution that will occur, withthe ACCC’s communication sector market study finding up to 30 per cent of households will considermobile alternatives when choosing their broadband plan.1 Such substitution is likely to encouragegood competitive outcomes for consumers, especially those with lower data needs that can beaccommodated by wireless broadband plans.14ACCC, Communications sector market study final report, p. 40.ACCC Communications Market Report 2017–18
There was a shift to higher quality fixed broadband serviceson the NBNA defining theme of 2017–18 was a shift to higher quality fixed broadband services delivered overthe NBN, as NBN Co moves from the build phase to the operational phase. There are a number ofindications of more competitive markets and better consumer outcomes including the take-up of higherspeed products and reduced congestion, as discussed below.NBN speeds showed a significant improvementIn 2017–18 consumers experienced a strong improvement in speeds on the NBN, demonstrated in anumber of ways: a significant increase in the take up of higher speed services with the number of 50 megabits persecond (Mbps) services increasing from just 100 000 (4 per cent of all NBN services) in June 2017 tonearly 1.5 million customers (35 per cent) in June 2018, with this number continuing to grow average NBN network congestion reduced from almost 5.5 hours a week in June 2017 to 25 minutesin June 2018 a shift in the focus of advertising from maximum theoretical speeds to speeds that customers arelikely to experience in practice, with RSPs representing around 90 per cent of the market moving togive consumers comparable information about typical busy period broadband speeds.These improvements followed a number of important developments: the release of our broadband speeds claims guidance in August 2017 to promote RSPs providingbetter broadband speed information to consumers a series of undertakings entered into by RSPs with the ACCC between November 2017 and March2018 to inform consumers of the maximum speeds they could achieve on NBN fibre to the node(FTTN) and fibre to the basement (FTTB) services and assist those on affected services NBN Co’s promotion introduced in December 2017 that reduced the price of its 50 Mbps wholesaleservice to the same as the 25 Mbps service and boosted bandwidth (connectivity virtual circuit(CVC)) by 50 per cent the introduction of our broadband performance monitoring and reporting program, MeasuringBroadband Australia, which provides independent information on the speeds typically supplied overthe NBN and which first reported in March 2018.But not all consumers have benefitted equally from improvementsin speedNotwithstanding these improvements, a material number of fixed wireless services are experiencingsignificant congestion during busy hours (less than 6 Mbps on average) and a material number offixed line connections do not deliver the full speed of the consumer’s chosen plan at any time. Thishas significantly diminished some consumers’ experience and required NBN Co to commit to investsignificant amounts of capital to upgrade the fixed wireless network, as well as trialling new processesto remediate factors at users’ premises that impede service quality.Further NBN product and pricing changes are being introducedLooking forward, NBN Co is transitioning its customers from the short term promotional discountsto new wholesale product and pricing bundles. As noted above, NBN Co’s pricing changes fromDecember 2017 had positive effects on the market and consumer outcomes. How RSPs will respondto NBN Co’s new wholesale products will be critical to ensuring the improvements described abovecontinue into the medium term. This includes the impact on speeds and congestion as well as ensuringthe needs of both low and high usage customers are well served. We will continue to monitor NBNpricing including in the context of considering any changes to NBN Co’s special access undertaking(SAU). We consider that our range of actions outlined above should assist in supporting positiveconsumer outcomes.ACCC Communications Market Report 2017–185
There is an increased focus on consumer experience onthe NBNImportant steps have been taken to improve service on the NBNAs observed above, a key theme in 2017–18 was the shift of NBN Co moving from the build phase ofits rollout to the operational phase. This has increased the focus on the level of service provided byNBN Co, with this issue featuring heavily in the draft report of the communications sector market studydelivered in October 2017. These concerns included: the wholesale service levels and their appropriateness recourse and compensation where NBN Co does not meet wholesale service levels coordination and information flows to assist service levels being met.Since the publication of the draft report, there has been significant progress on these issues. InNovember 2017 the ACCC announced an inquiry into NBN wholesale service standards and published adiscussion paper in December 2017. The Australian Communications and Media Authority (ACMA) alsointroduced new industry standards at the retail level relating to continuity of services when migrating tothe NBN, which came into effect in September 2018. By targeting both the wholesale and retail levels,the objective is to ensure the entire supply chain works efficiently to fix issues, rather than shiftingresponsibility between the retail and wholesale levels to end users’ detriment.In September 2018 the ACCC accepted a court enforceable undertaking from NBN Co to makechanges to its wholesale service level commitments to support positive consumer experiences onthe NBN.2 Some of the key amendments to the service standard commitments include changes tothe rebates payable under access agreements, including 25 rebates for every late connection, faultrectification and missed appointment. As part of these changes, RSPs must also take reasonable stepsto ensure their end users receive a fair value benefit from the wholesale rebates, which ensures there isa direct benefit to end users where NBN Co does not deliver a service that meets the standard.During the year, NBN Co started to publicly report on its service standards, including throughits monthly dashboard. While there remains more work to be done, this reporting showed someimprovements, for example as of October 20183: 97 per cent of homes and businesses are being connected within NBN Co’s agreed timeframescompared to 91 per cent a year prior 93 per cent of homes and businesses are now connected right the first time, up from 85 per cent ayear prior NBN Co resolved 92 per cent of faults within the timeframes agreed with RSPs, up from 80 per centa year prior.While the measures committed to by NBN Co represent important steps in improving service standardsfor the benefit of end users, there remains a number of areas of focus in the ACCC’s ongoing inquiry. Tothis end, in December 2018 the ACCC published a paper on the next part of its NBN service standardsinquiry seeking input on further measures NBN Co might take to improve end users’ experience onthe NBN.236The undertaking can be found on the ACCC public register: ngs-registers/nbnco-limited.NBN Co, Monthly progress report, October 2018, 18-monthly-progress-report.pdf.ACCC Communications Market Report 2017–18
NBN wholesale markets are developing slowly but moreproviders are connecting directlyWholesale NBN markets have developed more slowlyLarger providers of both fixed broadband and mobile services maintain a significant share of theirrespective markets, with the communications sector market study finding that the largest four verticallyintegrated providers of broadband services held 94 per cent of the NBN market.The market study found that the relatively concentrated supply of wholesale NBN aggregation servicesby the largest four providers may limit other service providers’ ability to compete in downstreammarkets. We also note that recently, some resellers, such as Amaysim, have exited the NBN resalemarket due to concerns about low margins. The ACCC is considering a proposal to gather moreinformation about this market to better understand any barriers that exist with these services.More service providers are investing to connect directly to the NBNThere was significant progress in RSPs directly connecting to the NBN in 2017–18 with AussieBroadband joining the four existing providers connected to all 121 points of interconnection (POIs)(Telstra, Singtel Optus Pty Ltd (Optus), TPG Telecom Limited (TPG Group) and Vocus CommunicationsLimited (Vocus Group)) and by June 2018, there were at least seven access seeker groups acquiringservices at 117 POIs, up from 55 POIs at the end of the March quarter.NBN Co also launched its network-to-network interface (NNI) link service. This assists retail serviceproviders to directly order their own NBN Co services and manage their own CVC capacity andconsumer experience, without having to install physical infrastructure at the POI.Mobile market shares remained steady while concernsabout mobile coverage continuedMarket shares for mobiles have remained relatively stable, althoughMVNOs are making some inroadsRetail market shares for mobiles have largely remained stable, with Telstra experiencing a modestdecline from 45 per cent market share between June 2014 and June 2016 to 42 per cent as of June2018. Optus’ and Vodafone Hutchison Australia’s (VHA) market shares have remained relatively stableat around 28 and 18 per cent respectively.Mobile virtual network operators (MVNO) provide competition to the three MNOs and serve sectionsof the market that the MNOs may not necessarily cater to or target. Some concerns were raised inthe course of the market study about the ability to provide differentiated downstream services usingwholesale MVNO services, noting this is often dependent on individual commercial agreements withone of the three MNOs. Notwithstanding this, there has been growth of three percentage pointsof MVNOs’ market share over the past two years, such that MVNOs now comprise 13 per cent ofthe market.There were a number of significant developments in the mobile sector. This included the announcementin August 2018 of the proposed merger between TPG Group and VHA, which combines the fixed andmobile services of the two companies and is currently under review by the ACCC. Another significantdevelopment was the commencement of the auction process for part of the ‘pioneer’ spectrumbands of 5G, the 3.6 gigahertz (GHz) band. In May 2018, the ACCC provided advice to the Ministerfor Communications and the Arts on the application of allocation limits in this auction. The auctionoccurred in November/December 2018.ACCC Communications Market Report 2017–187
Continuing concerns about inadequate mobile coverage in regional areasMobile coverage in regional Australia also remains a significant area of focus with continued investmentto address mobile blackspots and the ACCC considering a series of regulatory and policy measures toassist in improving coverage.In 2017–18 there was continued co-investment by governments and MNOs into expanding mobilecoverage to blackspot areas. While the size of the coverage area will be relatively small for eachupgrade, such as for a sm
Mobile phone services 6% 91% 3% * compound annual price decrease 2013-14 to 2017-18 Growth in data downloads 29% Mobile handset Fixed Wireless Mobile broadband 33% Proportion of all plans with unlimited data (up from 5% in 2013-14) 40% Fixed broadband 7.5% 5.6% Increase in data allowance 8.3% 8.3% 172% Annual price decrease Five year .