Transcription
ANALYSIS OF TRENDS ANDCHALLENGES IN THE INDONESIANLABOR MARKETEmma R. AllenNo. 16ADB PAPERS ON INDONESIAMarch 20161
Creative Commons Attribution 3.0 IGO license (CC BY 3.0 IGO) 2016 Asian Development Bank6 ADB Avenue, Mandaluyong City, 1550 Metro Manila, PhilippinesTel 63 2 632 4444; Fax 63 2 636 2444www.adb.org; openaccess.adb.orgSome rights reserved. Published in 2016.The views expressed in this publication are those of the authors and do not necessarily reflect the views and policies of theAsian Development Bank (ADB) or its Board of Governors or the governments they represent.ADB does not guarantee the accuracy of the data included in this publication and accepts no responsibility for any consequenceof their use. The mention of specific companies or products of manufacturers does not imply that they are endorsed orrecommended by ADB in preference to others of a similar nature that are not mentioned.By making any designation of or reference to a particular territory or geographic area, or by using the term “country” in thisdocument, ADB does not intend to make any judgments as to the legal or other status of any territory or area.Unless otherwise noted in this publication, “ ” refers to US dollars.This work is available under the Creative Commons Attribution 3.0 IGO license (CC BY 3.0 IGO) https://creativecommons.org/licenses/by/3.0/igo/. By using the content of this publication, you agree to be bound by the terms of said license as well as theTerms of Use of the ADB Open Access Repository at openaccess.adb.org/termsofuseThis CC license does not apply to non-ADB copyright materials in this publication. If the material is attributed to another source,please contact the copyright owner or publisher of that source for permission to reproduce it. ADB cannot be held liable for anyclaims that arise as a result of your use of the material.The ADB Papers on Indonesia is an ongoing, quick-disseminating, informal publication whose titles could subsequently berevised and developed into other forms of publication. Each paper is subject to formal revision and correction before they arefinalized and considered published. The series is maintained by the ADB Indonesia Resident Mission based in Jakarta, Indonesia.2
Analysis of Trends and Challenges in the Indonesian Labor MarketEXECUTIVE SUMMARYPerformance in the labor market has been weak, with slow job growth and high levels of laborunderutilization. Different groups of workers, particularly youth, women and rural dwellers, havehad disparate labor market outcomes, highlighting problems posed by labor marketsegmentation. Increasing investment in education has expanded the pool of educated workers;although, these investments have not translated into substantial gains in labor productivity.Under-qualified workers still fill many positions, with skills shortages a continuing challenge.Access to up-skilling and re-skilling opportunities are limited; however, analysis shows thatwithout investment in better quality education and training, access to quality jobs and careermobility is extremely limited.Over time, regular wage employment has expanded, while informal employment has declined.However, the majority of workers are employed on short-term contracts and/or earning anincome that is below the minimum wage. An over reliance on short-term contracting hasdiscouraged skills investment and is reinforcing segmentation in the labor market. Growth inminimum wages has been outpacing growth in average wages and this may be one reason forweak demand labor market performance.Moving forward, the key priority is expanding productive employment, including better qualityjobs and boosting the employment elasticity of growth. Strengthening linkages betweeneconomic growth and employment outcomes can support the expansion of quality jobs. Inaddition, it is important to strengthen incentives for skills formation in order to promote laborproductivity improvements. In this regard, training policies that support structural transition fromschool to work are needed, including the strengthening of vocational training and apprenticeshipsystems.A more flexible labor market is needed to ensure that the ongoing structural transformationprocess does create quality jobs. Ensuring that the regulatory framework provides the rightcombination of flexibility for enterprises and security for workers is critical. Current incentivesystems in the labor market tend to discourage stable employment and career progression.Labor law provisions on short-term contracting, worker dismissal, severance payment andunemployment insurance, should be should be reviewed in the light of the need to accelerateskills formation and foster productivity gains.Sustainable solutions are needed for wage policies. Trends indicate that the minimum wage isbecoming close to the average wage and efforts are needed to return the minimum wage to itssafety net function. This includes strengthening alternative avenues for wage negotiation at theindustry and enterprise level and building a culture of good faith bargaining. In parallel with this,it will be important to strengthen labor market governance to ensure that a larger majority ofIndonesian workers benefit from the standards outlined in regulations.Keywords: Employment, education, skills, training, wages, productivity, labor market flexibility3
I.INTRODUCTION1.Employment. Owing to its rapid growth, the services sector became the key source ofemployment, creating 14.2 million jobs in the last decade. The industry1 sector, with its modestperformance, contributed only 7.1 million new jobs, including 4.4 million jobs in manufacturing.The agriculture sector lost 900,000 jobs in the last decade. Most new jobs were generated inurban areas. The majority of jobs created use short-term contracting arrangements or are in theinformal sector. Employment quality is a major issue, and compliance with existing laborregulations is very low. Youth unemployment, skills shortages, and skills mismatches are alsopersistent challenges. Gains in labor productivity have been slow, and a multifaceted approachfor accelerating labor productivity is required to support growth in higher value-added activities2.Indonesia needs to ensure that new entrants to the labor force are equipped to supporteconomic development. Labor market institutions need to provide an enabling environment forsupporting economic growth and job creation. Social protection and social security systemsneed to support the productivity of the labor force and help to resolve issues related to povertyand inequality. Integrated solutions are required across education, infrastructure, economicsectors, and the social sectors, in order to promote quality employment and supportemployment creation.3.The following paper provides an overview of trends in the labor market, including generalemployment trends, trends related to skills and education, employment quality trends, andearnings and governance trends. Section III provides an overview of the government’sframework for promoting employment. Section IV discusses challenges in the labor market,including promoting productive employment, training and skills development, labor marketflexibility, sustainable wage policies and labor market governance.II.OVERVIEW OF LABOR MARKET TRENDSA.General employment trends4.Slow job growth, with many workers likely to be discouraged. Formal job creationhas slowed considerably in recent years. In August 2015 growth in employment slowed sharplyyear-on-year. As table 1 illustrates, fewer than 200,000 jobs were created between August 2014and August 2015, while the population aged 15 years and over increased by 3.1 millionpersons. In the same period, the number of unemployed workers increased by over 300,000people, while the number of people not economically active rose by 2.6 million.Table 1: Key labor market indicators (2013-2015)Key indicatorTotal population (millions)Population aged 15 years and over(millions)Economically active (millions)Employed (millions)Unemployed (millions)Not economically active 2.4114.87.663.7Industry sector includes manufacturing, mining, utilities, and construction.4
Employment-to-population ratio(%)Labor force participation rate (%)Unemployment rate 66.6%5.9%65.5%69.5%5.8%61.7%65.8%6.2%Source: BPS (2015) SAKERNAS, Badan Pusat Statistik, Jakarta. *Based on revised population weights andbackcast.5.Labor market performance fluctuates throughout the year. Employment outcomestend to fluctuate substantially between February and August of each year, while estimates ofunemployed workers remain comparatively stable throughout the year. Data presented in table1 illustrates that employment declined by 6 million people between February 2015 and August2015, while unemployment increased by only 100,000 workers. Normally fluctuations inemployment outcomes should be reflected in variations in the unemployment rate. However, asIndonesia does not provide unemployment benefits for the working age population, manyworkers tend to shift between short-term work opportunities and then exit the labor force. Suchworkers could be considered to be discouraged workers who are marginally attached to thelabor force. Closer examination of the employment-to-population ratio or the labor forceparticipation rate can provide more information on this trend.6.Table 1 illustrates that in February 2015 the labor force participation rate andemployment-to-population ratio were estimated at 69.5% and 65.5% respectively. By August2015, the labor force participation rate had dropped to a historical low of 65.8% and theemployment-to-population ratio was estimated at 61.7%. While seasonal factors and economicperformance may influence labor market outcomes throughout the year, the great variation inthe labor force participation throughout the year is a concern. The combination of jobless growthand high number of workers exiting in the labor market throughout the year suggests that thegrowth process is both generating few jobs and is contributing to higher turnover in the labormarket.7.Outcomes are uneven across social group and regions. Different groups of workers,particularly men and women, youth and older workers, and urban and rural dwellers, havedisparate labor market outcomes. Table 2 presents selected statistics for these groups ofworkers. It shows that the labor force participation rate of women was estimated at 48.9% inAugust 2015, while the labor force participation rate of men was 82.7% in the same period.Similarly, youth unemployment was estimated at 22.6% in August 2015 while unemployment forthose aged 25 years and over was 2.9%. 41.3% of the rural employed population worked lessthan normal working hours in August 2015, while only 19.2% of the urban employed populationworked less than normal working hours in the same period. Uneven outcomes tend to be evenfurther concentrated among urban youth and women in rural areas. Trends related to high youthunemployment, the high rate of people working less than normal working hours in rural areasand the low labor force participation of women, highlight labor underutilization as a keyemployment challenge for Indonesia. Strategies to increase women's labor force participation,support youth to access employment, and the promotion of productive employment in ruralareas, are needed to promote a more inclusive growth process.Table 2: Selected key labor market indicators (2013-2015)Key indicatorLabor force participation rate 95
Unemployment rate (%)17.521.615-24 years3.53.025 yearsEmployed people with less than normal working hours 22.62.920.941.219.442.320.740.019.241.3Source: BPS (2015) SAKERNAS, Badan Pusat Statistik, Jakarta. *Based on revised population weights andbackcast.8.Slow job growth has been a persistent challenge for Indonesia. The governmenthas set targets to create as many as 2 million jobs per year. This would require measures toboth increase the employment intensiveness of growth and to grow the economy at a fasterpace. To provide further insight on this issue table 3 presents an overview of trends in GDPgrowth, employment growth and employment elasticities by sector between 2005 and 2014. Itcan be observed that GDP growth performance improved slightly over the period, whileemployment outcomes deteriorated. Subsequently, the employment elasticity of growth declinedover the period, largely influenced by trends in agriculture and mining. Parts of the servicesector also experienced a slowdown in employment growth and a decline in the employmentelasticity. This is particularly evident in both the trade sector and the transport sector. Thesedevelopments reflect technological innovation and increases in economies of scale, assupermarkets and mega malls have replaced traditional markets.2 This has decreased thedemand for unskilled labor within these sectors, particularly demand for unpaid family workers,and increased demand for workers with higher levels of education attainment.Table 3: Sector output growth and employment growth, 2005-20143VariableGDP growth rateAgriculture, Forestry, Hunting and FisheryMining and QuarryingManufacturingElectricity, Gas and WaterConstructionWholesale Trade, Retail Trade, Restaurant and HotelsTransportation, Storage and CommunicationFinancing, Insurance, Real Estate and Business ServicesCommunity, Social, and Personal ServicesTotalEmployment growth rateAgriculture, Forestry, Hunting and FisheryMining and QuarryingManufacturingElectricity, Gas and WaterConstructionWholesale Trade, Retail Trade, Restaurant and HotelsTransportation, Storage and CommunicationFinancing, Insurance, Real Estate and Business .0%4.3%5.4%2.0%-1.9%11.7%Aswicahyono, H., Hill, H. and Narjoko, D. (2012) Industrialization: Patterns, issues and constraints, in Hill, H., Khan, M andZhuang, J (eds) Diagnosing the Indonesian economy: Towards inclusive and green growth, Asian Development Bank, Manila.3 For previous years see Aswicahyono, H., Hill, H. and Narjoko, D. (2012) Industrialization: Patterns, issues and constraints, inHill, H., Khan, M and Zhuang, J (eds) Diagnosing the Indonesian economy: Towards inclusive and green growth, AsianDevelopment Bank, Manila. Calculations are based on CAGR; 2010-2014 GDP growth based on gross value added; 2011-2014employed data based on revised population weights; 2010-2014 GDP at 2010 constant prices; 2000-2009 GDP at 2000 constantprices.26
Community, Social, and Personal ServicesTotalEmployment elasticityAgriculture, Forestry, Hunting and FisheryMining and QuarryingManufacturingElectricity, Gas and WaterConstructionWholesale Trade, Retail Trade, Restaurant and HotelsTransportation, Storage and CommunicationFinancing, Insurance, Real Estate and Business ServicesCommunity, Social, and Personal 1.01.20.5-0.41.10.40.70.80.3-0.21.60.50.3Source: ADB staff calculations based on BPS (2015) National Accounts and SAKERNAS, Badan Pusat Statistik,Jakarta.9.Employment outcomes in manufacturing have been modest. Expanding productiveemployment in manufacturing has been a longstanding challenge for policy makers, given adesire to boost added-value in the commodity sectors and to diversify exports. Annual growth inmanufacturing output was 3.8% between 2005 and 2009, and accelerated to 5.2% between2010 and 2014. However, employment performance was not as robust, increasing marginallyover the period. Subsequently, the employment elasticity of the manufacturing sector declinedover the period. An important explanation for this trend relates to poor performance in exportoriented manufacturing, rising labor costs, the comparative advantage of PRC manufactures, aswell as congested ports and high logistic costs.4 The modest performance of the manufacturingsector over the last two decades has also hindered the overall modernization of the sector andallowed a dualistic industrial structure to persist. To illustrate, large manufacturing firms accountfor approximately 80% of value added and only 30% of employment within the sector.5 Thelarger firms are more likely to innovate, attract foreign direct investment, and become moreefficient over time. Micro and small firms account for 10% of value added and two thirds ofemployment within the sector. They use simple technologies, have low productivity, and areconstrained by limited access to finance.10.Linking economic and employment outcomes can support the expansion ofquality jobs. Employment growth in construction outpaced economic growth within the sector,resulting in gains in the employment elasticity. Some 90% of those working in the sector areemployed as construction laborers, many of whom are on casual contracts, have an educationattainment of junior high school or less, and receive comparatively low levels of remuneration.Increases in the employment elasticity within construction therefore coincides with higherdemand for low skilled labor, rather than structural changes that includes an upgrade oftechnologies and increased demand for workers with greater skills.11.Trends in the finance, real estate, insurance and business services sector contrast withtrends in the construction sector. Both economic and employment growth in the sector wasstrong, resulting in gains in the employment elasticity. Closer examination of the sector revealsthat demand for highly skilled workers has been increasing, while demand for unskilled workershas contracted. Most people employed in the finance and banking sector work on employeecontracts in skilled or semi-skilled positions and receive comparatively high levels ofTabor, S. (2015) Constraints to Indonesia’s economic growth, ADB Papers on Indonesia, No. 10 December 2915, AsianDevelopment Bank, Manila.5 BPS (2013) Profile of micro and small manufacturing enterprises, Badan Pusat Statistik, Jakarta; BPS (2013) Manufacturingindustry indicators, Badan Pusat Statistik, Jakarta.47
remuneration. Therefore the increase in the employment elasticity within the sector coincideswith increasing demand for workers with greater capacity, increasing productivity within thesector, and the expansion of quality jobs.12.Productivity gains need to accelerate at a faster pace. Figure 1 illustrates that gainsin labor productivity trends, broadly defined as GDP in purchasing power parity terms perperson employed, are lagging in comparison to both the global average and in comparison withneighboring countries such as Thailand and Malaysia. Trends in labor productivity in the mid1990s showed signs of convergence with global norms; however, this changed after the AsianFinancial Crisis. Recent trends point to a slight upturn in labor productivity growth, although thistrend likely reflects the slowing of job growth in recent years, rather than substantial gains ineconomic and labor market efficiency. On the demand side, the combined slower rates ofeconomic growth and job creation have limited the expansion of quality jobs and slowed thepace of structural transformation. On the supply side, weaknesses in the education and skillsprofile of the labor force have also hindered productivity gains and a more rapid convergencewith global productivity norms.Figure 1: GDP per person employed for Indonesia and selected countries(constant 1990 PPP )Source: World Bank (2015) World development indicators, World Bank, Washington D.C.8
13.Employment patterns have changed over time. In 1985, 54.7% of employed peopleworked in agriculture, 13.4% worked in industry and 31.8% worked in services. By 2015, thecomposition of employment had further developed, with 34.0% of employed people working inagriculture, 19.7% in industry and 44.8% in services. Changes in employment patterns mirroredchanges in economic activity, but with a lag, as the proportion of GDP accounted for by theagriculture sector fell from 23.2% in 1985 to 13.4% in 2015 and that in industry rose from 15.9%to 41.9% over the same period. Services share of GDP hovered at 42% across the period.14.By 2035 two thirds of the population will be living in urban areas. Table 4 highlightsthat in 2010 half the population lived in urban areas, and with the increasing pace ofurbanization it is expected that an additional 85 million people will be living in urban areas by2035. This shift will have profound implications for the labor market. In particular, rural laborforce participation tends to be higher than urban labor force participation, and urbanunemployment tends to be higher than rural unemployment. If these trends continue, there is arisk of lower labor force participation and higher unemployment in the years to come.Table 4: Population projections for urban and rural areas, 2010-2035Variable2010Number of people (millions)Urban118.8Rural119.7Total238.5Percentage of the population : BPS (2013) Indonesia population projection, 2010-2035, Badan Pusat Statistik, Jakarta.15.Demographic shifts will also influence the labor market. The workers that areentering the labor market today are better educated and have greater capacity for adopting newtechnology than the average worker of today. However, the share of younger groups (aged 1529) in the working age population is projected to decline from 40% to 34% between 2010 and2035, entailing an increase in the mature age population.6 As the labor force matures, thedemographic gains from a younger and better educated workforce will dissipate.B.Education and skills trends16.Increasing investment in education has expanded the pool of educated workers.Indonesia has dramatically increased rates of school enrollment and the average years ofschooling since its transition to democracy. The country is now close to achieving universalliteracy among the youth population and the government has made clear commitments tocontinuing education funding. Figure 2 provides an overview of education attainment by agegroup for the economically active population. It illustrates that the supply of workers with moreyears of schooling and higher levels of education is increasing; however, the composition of thelabor force continues to be dominated by workers with lower levels of education. In particular, itis more common for the population aged over 40 years to have primary school or below as theirhighest level of education. Those aged below 40 years are more likely to have completed juniorhigh school or senior high school. Those aged below 30 years have the highest rates of highschool completion and many have completed tertiary education. The figure illustrates that theJones, G. (2013) The 2010 – 2035 Indonesian Population Projection Understanding the Causes, Consequences and PolicyOptions for Population and Development, United Nations Population Fund, Jakarta.69
overall trends in education attainment for young people are largely positive, while the low levelsof education of the mature age population remain a challenge. In addition, there are still manyyoung people that report to have primary school as their highest level of education, entailing aneed for a continuing focus on school retention rates.Figure 2: Education attainment by age groups for the economically active population,August 2015 (millions of people)Source: BPS (2015) Labor force situation: August 2015, Badan Pusat Statistik, Jakarta.17.However, gains in the quality of education have not been forthcoming. ForIndonesia to continue along the path of structural transition, its workers will need to have moresophisticated and specialized skills if labor productivity is to improve. Challenges remain,particularly in terms of the quality of education outcomes. Indonesia’s performance in variousinternational education assessment programs has uncovered issues related to the quality ofmathematics, science and literacy education. In particular, Indonesia performs well below theOECD average in all assessment areas and there has been little progress in the quality ofeducation outcomes over time.7 There are also significant disparities in education servicesacross the country, with the eastern parts of Indonesia lagging even further behind. In addition,almost half of the country’s primary schools lack access to electricity, which has implications foraccess to technology and e-learning.8OECD and ADB (2015) Review of national policies for education: Education in Indonesia – Rising to the challenge, OECD,Paris.8 Tabor, S. (2015) Constraints to Indonesia’s economic growth, ADB Papers on Indonesia, No. 10 December 2915, AsianDevelopment Bank, Manila.710
18.Building a critical mass of educated workers is a priority. Building a critical mass ofhighly educated and skilled workers provides increased returns to economic growth, especiallyin times of structural transformation.9 This is because highly educated workers tend to havepositive spillovers effects for those with lower levels of education. The challenge for Indonesia istherefore related not only to improving the quality of primary and secondary education, but alsoto building a tertiary education system that allows the labor force to develop high qualitycognitive and technical skills that are relevant for supporting economic development.19.Skill gaps. There are now more than 30 million senior secondary graduates and morethan 10 million tertiary education graduates in Indonesia’s labor force. From 2010 to 2015, thenumber of workers with a tertiary education has increased by more than 1 million annually andthose with a senior secondary education by more than 2 million annually. However, the qualityof tertiary education is low and the learning achievement of most students is inadequate. In a2008 World Bank survey of employers, two-thirds complained that finding employees forprofessional and management positions was difficult or highly difficult. In some sectors, theeducation system is not providing enough graduates, while in other sectors those who aregraduating do not have the right skills. Consequently, a large number of individuals with postsecondary qualifications work in low-skill occupations, which suggests that despite holdingdegrees, they lack the right skills.10 In 2015, 52% of the employed population was underqualified for their positions. McKinsey estimated that demand for semi-skilled and skilledworkers may rise to 113 million by 2030, which is likely to see skills shortages and skillsmismatches worsen throughout the economy.1120.Demand for students with quality vocational and technical skills outstrips supply. Of the5.2 million students enrolled in more than 3,000 Indonesian higher education institutions, just110,000 receive polytechnic education– less than 3%–which is extremely low compared to othercountries. The quality of polytechnic education is also generally poor. Polytechnic managementtends to be rigid, work placements badly organized, financing support low, and links with theprivate sector weak. In addition, society tends to view polytechnic education as a second–classalternative to university education.1221.Variable quality of university graduates. State-run universities dominate the highereducation system but receive low levels of government funding (some 0.3% of GDP) and aretightly regulated. Private funding has come to dominate higher education, but without credibleaccreditation and quality control mechanisms in place. The quality of tertiary institutions is highlyvariable, with small pockets of excellence alongside large numbers that provide training of sub–standard quality. Funding support mechanisms, particularly for able but needy students, arelimited. None of Indonesia’s tertiary institutions rank prominently in international comparisons.Moreover, almost 40% of unemployed people with post-secondary qualifications are stillunemployed 12 months later. This highlights serious challenges associated with the skills ofgraduates and labor market information systems.ADB (2015) A Smarter Future: Skills, Education, and Growth in Asia— Key indicators for Asia and the Pacific 2015 specialchapter, Asian Development Bank, Manila.10 World Bank (2014) Development Policy Review: Indonesia: Avoiding the Trap. Jakarta.11 McKinsey Global Institute. 2012. The archipelago economy: Unleashing Indonesia’s Potential. Washington D.C.12 ADB (2012) Polytechnic Education Development Project. Sector Assessment: Polytechnic Education. Manila.911
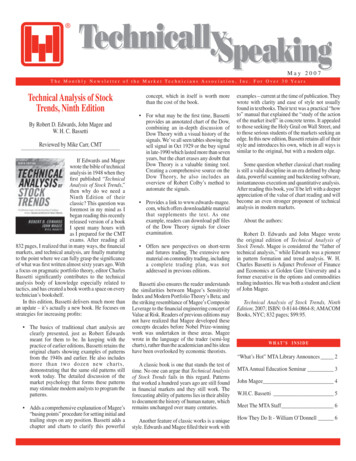
22.Skills shortages are prevalent, with under-qualified workers filling many positions.Figure 3 presents an analysis of the share of workers who are under-qualified, well-matched,and over-qualified for their occupations.13 It is estimated that 51.5 % of workers are underqualified, 40.0 % are well-matched, and 8.5 % are over-qualified for their occupations.Occupation mismatch in Indonesia tends to be associated with the low education levels ofproduction workers and agriculture laborers, as well as a large number of clerks that are overqualified for their jobs. Under-qualification is also a challenge in higher level occupations. Highlevels of under-qualification and lower levels of over-qualification point towards an issue of skillshortages. This is an important issue, as high levels of skill and qualification mismatch aretypically associated with lower levels of labor productivity.14 The high proportion of underquali
2015, the labor force participation rate had dropped to a historical low of 65.8% and the employment-to-population ratio was estimated at 61.7%. While seasonal factors and economic performance may influence labor market outcomes throughout the year, the great variation in the labor force participation throughout the year is a concern. .