Transcription
LABORMARKETPROFILEThe PhilippineLabor MarketThe Philippine economy was significantlyaffected by the COVID-19 pandemic with theGross Domestic Product (GDP) contracting by-6.2% in the fourth quarter of 2020 from 7.0% inthe same period in 2019 and -9.6 percent full-yeargrowth for 2020. The main contributors to thedecline of the GDP growth for the fourth quarterof 2020 were Construction at -25.3 percent; OtherServices at -45.2 percent; and Accommodationand Food Service Activities at -42.7 percent.AUGUST 2021THE 2020ISSUESimilar to the GDP, the country’s improvement inemployment was hampered by the pandemic with theunemployment rate reported at 10.3% (4.5 millionunemployed persons) in 2020 – far from the target ofthe Philippine Development Plan (PDP) set at 4.7%-5.3%.Moreover, the youth unemployment (21.5% or 1.529million unemployed youth) and underemployment(16.2% or 6.4 million unemployed workers) postedsignificant increase in the midst of pandemic.With the continuous rollout of the vaccination program,the government is anticipating less road bumps towardsthe country’s road to recovery. The signing of ExecutiveOrder No. 140 officially adopting the NationalDEPARTMENT OF LABOR AND EMPLOYMENTBureau of Local EmploymentEmployment Recovery Strategy (NERS) as the Philippinegovernment’s master plan for the recovery of thecountry’s labor market, and institutionalizing the20-agency strong NERS Task Force (TF) is also a boostin our efforts to mitigate the effects of the COVID-19pandemic. The convergence of key agencies in theNERS Task Force is expected to contribute at least220,000 jobs and assist over 1.4 million Filipinosstruggling with unemployment and income losses.Moreover, the private sector has committed the creationof 1 million jobs for 2021 which is a welcomecontribution in our effort to recover lost employmentbecause of this pandemic.The Labor Market Profile, or LMP, is an annual publication of the Bureau of Local Employment presentingthe overall scenario of the Philippine labor market using primary and secondary sources of labor marketinformation from national surveys and administrative data.
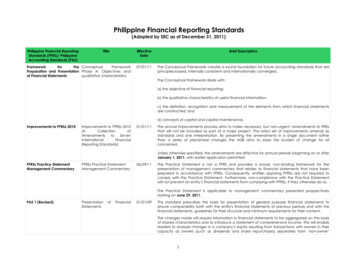
LABOR MARKET PROFILEThe PhilippineEconomyThe Philippine Statistics Authority (PSA) reportedthat the country’s fourth quarter GDP slowed down to-6.2% from 7.0% in the same period in 2019. In a PSAstatement issued on 28 January 2021, the declinemay be attributed to Construction (-25.3%), OtherServices (-45.2%) and Accommodation and FoodService Activities (-42.7 percent).In terms of employment, majority of the sectorsreported employment loss except for agriculture,hunting and forestry ( 192,000 or 2.3%), activities ofextraterritorial organization and bodies ( 1,000 or226.4%) mining and quarrying and education – bothsame as in the previous year. On the other hand, thedecline in employment were most observed in transportation and storage (-500,000 or -14.6%), accommodation and food service activities (-454,000 or-23.6%), and construction (-449,000 or -10.8%)sectors.Table 1. Employed Persons by Major Industry Group, Philippines: 2019 vs 2020(in ‘000s except rates)MAJOR INDUSTRY GROUPS2019ALL INDUSTRIES2019 vs 2020202042,42739,406AgricultureINCREMENTGROWTH RATE(3,021)(7.1%)9,6949,764700.7%Agriculture and Forestry8,3918,5841922.3%Fishing and .1%)IndustryMining and 2.0%)Electricity, Gas, Steam and Airconditioning Supply9081(9)(10.5%)Water Supply; Sewerage, Waste Management andRemediation 322,409(449)(10.8%)(2,204)(9.0%)Wholesale and Retail Trade; Repair of MotorVehicles and Motorcycles8,4528,079(373)(4.4%)Transportation and )425349(76)(17.9%)Financial and Insurance Activities579555(24)(4.1%)Real Estate Activities230192(39)(16.8%)ServicesAccommodation and Food Service ActivitiesInformation and CommunicationProfessional, Scientific and Technical Activities304261(44)(14.3%)Administrative and Support Service Activities1,6551,607(47)(2.9%)Public Administration and Defense; CompulsorySocial .0%Human Health and Social Work Activities545542(3)(0.5%)Arts, Entertainment and 121226.4%Other Service ActivitiesActivities of Extraterritorial Orgs and BodiesSource: Annual Estimates Labor Force Survey, Philippine Statistics AuthorityLabor and Employment SituationThe employment rate in the Philippines increasedfrom 94.5% in 2016 to 94.9% in 2019. However, due tothe imposed travel restrictions and lockdowns afterthe government implemented the Enhanced Community Quarantine in Luzon (and subsequently nationwide) to limit the transmission of COVID-19, theemployment rate lowered to 89.7% (-3.021 million) in2020 while the unemployment rate increased from5.1% (1.103 million) in 2019 to 10.2% (1.529 million)in 2020. Similarly, underemployment rate increasedfrom 14.0% in 2019 to 16.2%.The 2020 Labor Force Survey annual estimate showsthat the country’s total labor force decreased from44.691 million to 43.907 million year-on-year (seeTable 2).PAGE 2
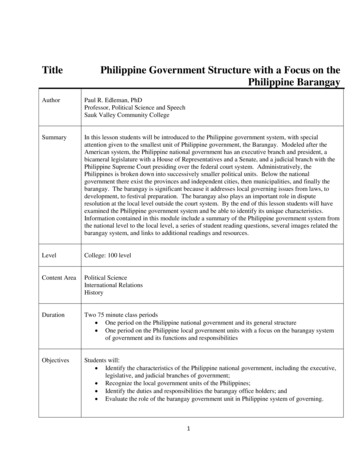
THE 2020 ISSUE/AUGUST 2021Table 2. Key Employment Indicators, Philippines: 68,30869,89671,33972,93173,722Labor Force 77743,46144,69143,907Employed Persons 33541,16042,42739,406Working age population 15 yearsold and over (000)Underemployed Persons 5,9326,400Unemployed Persons 1,1031,529Labor Force Participation Rate loyment Rate eremployment Rate mployment Rate (%)7.477.17.16.66.35.55.75.35.110.3Source: Labor Force Survey, PSANotes: P Preliminarylaborers and unskilled workers (572,336 or 35.6%),followed by clerks (256,261 or 15.9%), serviceworkers and shop and market sales workers (241,692or 15%) and professionals (172,304 or 10.7%).Labor Supply andDemand SituationLABOR DEMANDA total of 1,608,220 vacancies were posted in thePESO Employment Information System (PEIS) in2020 (see Figure 1). Most of the vacancies areFor vacancies, most of the vacancies are from otherservice activities (238,167 or 14.8%), administrativeand support service activities (136,395 or 8.5%),agriculture, hunting and forestry (123,743 or 7.7%),and transport, storage and communication (123,148or 7.7%).Figure 1. PEIS Job Vacancy Postings: Distribution by Occupation, January to December 2020Figure 2. PEIS Job Vacancy Postings: Distribution by Industry, January to December 2020PAGE 3
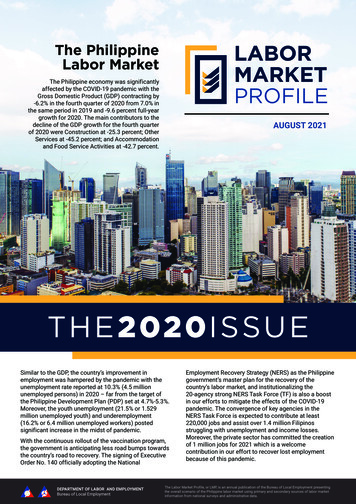
LABOR MARKET PROFILELABOR SUPPLYLabor supply in this report focuses on graduates informal education and training institutions, andlicensure examination passers.Based on the Commission on Higher Education(CHED) enrollment data, Business Administrationand Related Discipline had the highest number ofenrollees in both 2018 and 2019, followed byEducation Science and Teacher Training, Engineeringand Technology, and Information Technology RelatedDisciplines.There are few enrollees in Trade, Craft, and IndustrialDisciplines but it reported the highest completion rateof 68%. A range of 12% to 68% completion rate wasobserved.Table 3. Higher Education Institution Enrollment andGraduates: Total Number by Academic Discipline GroupDISCIPLINE GROUPENROLLEES(A.Y. 2018-2019)GRADUATES(A.Y. 2018-2019)COMPLETIONRATEa/ (%)ENROLLEES(A.Y. 554093,408,425Agricultural, Forestry, Fisheries, Vet Med.Architectural and Town PlanningBusiness Administration and RelatedEducation and Teacher TrainingEngineering and TechnologyFine and Applied ArtsGeneralHome EconomicsHumanitiesInformation TechnologyLaw and JurisprudenceMaritimeMass Communication and DocumentationMathematicsMedical and AlliedNatural ScienceOther DisciplinesReligion and TheologyService TradesSocial and Behavioral ScienceTrade, Craft and IndustrialGRAND TOTALSource: CHED Administrative Data 2019 enrollment data and 2018 & 2019 graduate data as of 8 October 2020Note: a/ Completion Rate is the percentage of graduate students per number of enrollees.PESO Employment Information System(PEIS)Figure 3. PEIS Registered Applicants: Total Numberby Sex and Age Group, Philippines, 2020A total of 960,087 new registrants wererecorded in the PEIS for 2020 (see Figure 3).Most of the registered applicants are 25-34years old (320,712 or 33.4%), followed by 20-24years old (254,313 or 26.5%), and 35-44 yearsold (165,281 or 17.2%).For 2020, the number of female applicants(497,435 or 51.8%) exceeds the number ofmale applicants (462,652 or 48.2%).Figure 4. PEIS Registered Applicants: Total 20Preferred Positions, Philippines, 2020The top occupations of registered applicants inPEIS for 2020 (Figure 4) are Cashier with 8,922,followed by Service Crew with 6,684,Production Worker with 5,686, and Sales Clerkwith 3,865.PRCMajority of licensure examinations scheduledfor 2020 has been cancelled pursuant toPresidential Proclamation No. 922 dated 8March 2020 declaring a state of public healthemergency throughout the country and therecommendations of the Department of Health(DOH) and the Inter-agency Task Force for thePAGE 4
THE 2020 ISSUE/AUGUST 2021Management of Emerging Infectious Disease (IATF)to prohibit gatherings, and to ensure the safety of theexaminees and employees of the ProfessionalRegulation Commission.In 2020, the PRC reported a total of 8,529 examineesof which 8,529 (57.9%) passed the examinations. Dueto restrictions, PRC was only able to holdexaminations for eight (8) occupations (see Table 4).TESDAFor 2020, the Technical Education and SkillsDevelopment Authority (TESDA) has issuedcertification to a total of 462,189 skilled workers outof 493,018 assessed applicants for the year (seeTable 5.) The highest number of certified skilledworkers was observed in NCR (81,047 or 17.5%),followed by Region 3 (50,703 or 11%). Region 4-A(40,902 or 8.8%) and Region 7 (28,889 or 6.3%).PASSERSThe Labor Market Profile, or LMP, is an annualpublication of the Bureau of Local Employmentpresenting the overall scenario of the Philippinelabor market using primary and secondarysources of labor market information fromnational surveys and administrative data.EDITORIAL BOARDTEXT & ertified Plant MechanicMaster PlumbersMechanical EngineersOccupational TherapistsPhysical TherapistsPhysiciansSanitary EngineersTOTALTHE 2020 ISSUE/AUGUST 2021Asec. Dominique Rubia-TutayGrace BaldozaMyka TronoTable 4. LicensureExaminations Passers byProfession, Philippines: 2020PROFESSIONLABORMARKETPROFILELor AlfonsoAnna Klariza LangitanTable 5. Number of Assessed and CertifiedSkilled Workers by Region, Philippines: VIIVIIIIXXXIXIICARAGABARMMPortfolio tment of Laborand EmploymentBureau of LocalEmployment6F First IntramurosBF Condominium,Solana St. cor. A. Soriano Ave.,Intramuros, Manila(02) 8528-0087ble.dole.gov.phfacebook.com/BLEinfoAugust 2021Source: TESDA, 2020Other LMIPublications bythe DOLE BLEavailable atble.dole.gov.ph:Labor Market TendsMay 2021 IssueJob Summit: AWhole-of-SocietyApproach TowardsEmployment RecoveryJobsFit Covid-19 LMIReport: How thePandemic is Reshapingthe Philippine LaborMarketPAGE 5Labor Market TendsMay 2020 IssueUnderstandingRecession andUnemployment
Labor Supply and Demand Situation LABOR DEMAND A total of 1,608,220 vacancies were posted in the PESO Employment Information System (PEIS) in 2020 (see Figure 1). Most of the vacancies are workers and shop and market sales workers (241,692 For vacancies, most of the vacancies are from other and transport, storage and communication (123,148 or 7 .