Transcription
D’Esposito et al. BMC Plant Biology (2017) 17:66DOI 10.1186/s12870-017-1008-4RESEARCH ARTICLEOpen AccessUnraveling the complexity oftranscriptomic, metabolomic and qualityenvironmental response of tomato fruitDaniela D’Esposito1, Francesca Ferriello1, Alessandra Dal Molin2, Gianfranco Diretto3, Adriana Sacco1,Andrea Minio2, Amalia Barone1, Rossella Di Monaco1, Silvana Cavella1, Luca Tardella4, Giovanni Giuliano3,Massimo Delledonne2, Luigi Frusciante1 and Maria Raffaella Ercolano1*AbstractBackground: The environment has a profound influence on the organoleptic quality of tomato (Solanumlycopersicum) fruit, the extent of which depends on a well-regulated and dynamic interplay among genes,metabolites and sensorial attributes. We used a systems biology approach to elucidate the complex interactingmechanisms regulating the plasticity of sensorial traits. To investigate environmentally challenged transcriptomicand metabolomic remodeling and evaluate the organoleptic consequences of such variations we grown threetomato varieties, Heinz 1706, whose genome was sequenced as reference and two “local” ones, San Marzano andVesuviano in two different locations of Campania region (Italy).Results: Responses to environment were more pronounced in the two “local” genotypes, rather than in the Heinz 1706.The overall genetic composition of each genotype, acting in trans, modulated the specific response to environment.Duplicated genes and transcription factors, establishing different number of network connections by gaining or losinglinks, play a dominant role in shaping organoleptic profile. The fundamental role of cell wall metabolism in tuning all thequality attributes, including the sensorial perception, was also highlighted.Conclusions: Although similar fruit-related quality processes are activated in the same environment, different tomatogenotypes follow distinct transcriptomic, metabolomic and sensorial trajectories depending on their own geneticmakeup.Keywords: Environment, Fruit quality, Metabolome, Network, Plasticity, Sensorial attributes, Solanum lycopersicum,TranscriptomeBackgroundTomato (Solanum lycopersicum) is one of the mostpopular and widely consumed vegetable crops worldwideand its peculiar fruit quality properties can be strongmodified by environmental conditions. The response todifferent environmental conditions depends on severalfactors, including the genetic diversity and genome plasticity of individual genotypes. Both the occurrence andmagnitude of phenotypic plasticity for any trait arethemselves characteristics that are under genetic control,* Correspondence: ercolano@unina.it1Department of Agricultural Sciences, University of Naples Federico II, Portici80055, ItalyFull list of author information is available at the end of the articlewith levels varying between traits, individuals and populations [1–5]. Thus, differences in functional traits arepredictive of differences in individual genomic responsesto environmental changes, albeit this has rarely been experimentally tested in the field [6]. Trait variation amongindividuals must be considered when evaluating the importance of functional traits as a predictor of how agenotype will respond to environmental change [7]. Indeed, the role of such plasticity could be crucial for buffering the detrimental effects of environmental changes[8, 9]. A proposed hypothesis is that phenotypic plasticity can be favored by gene duplication events, whichgenerate redundant genomic functions that may divergeover time [10]. The Author(s). 2017 Open Access This article is distributed under the terms of the Creative Commons Attribution 4.0International License (http://creativecommons.org/licenses/by/4.0/), which permits unrestricted use, distribution, andreproduction in any medium, provided you give appropriate credit to the original author(s) and the source, provide a link tothe Creative Commons license, and indicate if changes were made. The Creative Commons Public Domain Dedication o/1.0/) applies to the data made available in this article, unless otherwise stated.
D’Esposito et al. BMC Plant Biology (2017) 17:66The organoleptic properties of tomato fruit are definedby a set of sensory attributes, such as flavor, fruit appearance and texture. Flavor is defined as the combination oftaste and odor. Intense taste is the result of an increasein gluconeogenesis, hydrolysis of polysaccharides, a decrease in acidity and accumulation of sugars and organicacids [11], while aroma is produced by a complex mixture of volatile compounds and degradation of bitterprinciples, flavonoids, tannins and related compounds[11, 12]. Fruit color is mainly determined by carotenoidsand flavonoids [13, 14], while textural characteristics areprimary controlled by the cell wall structure in additionto cuticle properties, cellular turgor and fruit morphology [15]. In last years, tomato fruit organoleptic qualityhas been investigated both at the genetic and biochemical levels in order to obtain new varieties with improvedtaste [16–19]. Recently, the genomes of traditional tomato cultivars such as San Marzano (SM) and Vesuviano (RSV), considered important models for fruitquality parameters, have been sequenced [20]. SM, originating from the Agro Sarnese-Nocerino area in southern Italy, produces elongated fruits with a peculiarbittersweet flavor [21]. RSV, originating from the volcanic slopes of Vesuvius in the same region, producessmall sweet pear-shaped fruits that are suitable for longterm storage thanks to their texture [22].The ability to dissect genomic and metabolic responsesto environmental cues is key to understanding the molecular basis of plasticity of fruit quality traits. In spite ofthe large amount of information on the genomic andmetabolomic components controlling fruit quality traits,very little is known to date regarding the transcriptionaldynamics (plasticity) controlling such traits. A systemsbiology approach, integrating different –omics datasets,is instrumental for elucidating complex mechanismscontrolling organoleptic properties [23].The aim of this work was to quantify the extent of thetranscriptional response to environmental cues, to measure the metabolic activity and to evaluate the organoleptic consequences of the genome variation identified. Weused a multilevel (system biology) approach combininggenome, transcriptome, metabolome and sensorial dataof three tomato varieties, Heinz 1706 (H), SM and RSV,grown in two different localities.MethodsPlant material and growth conditionsH, SM and RSV tomato (Solanum lycopersisum) plantswere cultivated in two locations in southern Italy, Sarno(province of Salerno, SA) and Acerra (province ofNaples, NA) characterized by Mediterranean climatewith lower average air temperature (T) and humidity (U)and slight higher average number of rainy days (R) inAcerra (T 22.7C ; U 63.8%; R 6.6 days) than inPage 2 of 18Sarno (T 23.8C ; U 72.9%; R 4.5 days) during thegrowing season (http://www.ilmeteo.it/portale/archiviometeo). Differences between the two locations alsoregarded soil texture, characterized by predominance ofsilt and clay in Acerra (Ac) limestone and sand in Sarno(Sa). In addition, differences in chemical parameters suchas pH (7.3 in Acerra, 8.3 in Sarno), limestone (absent inAcerra, 10 g/Kg in Sarno) exchangeable magnesium(0,94 meq/100 g in Acerra, 2.16 meq/100 g in Sarno)exchangeable potassium, (4.55 meq/100 g in Acerra,1.93 meq/100 g in Sarno), ratio C/N (8.2 g/Kg in Acerra,11.1 g/Kg in Sarno) and electrical conductivity (1:5) (0.07dS/m in Acerra, 0.237 dS/m in Sarno) were found between the two fields.The genotypes were grown in a randomized designduring the summer of 2012 following the tomato fieldprocedures used for the area. Young seedlings ( onemonth old) were planted at the end of April in twoblocks, divided into three plots. In each plot 3–4 plantsof any variety were allocated.At mature ripe stage (according to the full appearance ofred color on the fruit surface, Additional file 1: Figure S1)fruits were collected from the intermediate trusses of theplant. In each plot fruits belonging to the same variety werepooled. The six samples obtained for each variety was usedto conduct the sensory evaluation. The rest was chopped,divided into replica aliquots and immediately frozen underliquid nitrogen and then stored at 80 .RNA sequencing and differential expression analysisTotal RNA used for downstream RNA sequencing andqPCR validation was extracted from frozen, homogenized, and powdered fruit tomato samples following theprotocol previously described [24]. RNA quality waschecked with an Agilent Bioanalyzer 2100. Six RNA-seqlibraries were prepared starting from 2.5 μg of totalRNA using the TruSeq RNA Sample Prep Kit v2(Illumina Inc., San Diego, CA, USA). The libraries werethen size-selected with a Pippin Prep (Sage Science Inc.,Beverly, MA, USA) resulting in a selected range of about250–350 bp. The cDNA libraries were sequenced withTruSeq Sequencing by means of a Synthesis Kit v3-HSand TruSeq Paired End Cluster Kit v3-cBot-HS (IlluminaInc., San Diego, CA, USA) using an HiSeq 1000(Illumina Inc., San Diego, CA, USA) sequencer accordingto the manufacturer’s instructions to generate 100-bppaired-end reads. Sequencing reads were analyzed withCASAVA software (Illumina Inc., San Diego, CA, USA)for demultiplexing and FASTQ file generation. The qualityof reads was checked using RseQC software [25].RNAseq reads were aligned on S. lycopersicum cv.Heinz 1706 version 2.40 genome, San Marzano andVesuviano [20] respective genome using TopHat (ver.2.0.6). Transcriptome reconstruction and identification
D’Esposito et al. BMC Plant Biology (2017) 17:66of differentially expressed genes (DEGs) and isoforms(DEI) for module of log in base 2 fold change (FC)values were performed with Cufflinks (ver2.1.1) usingmulti-read correction. This pipeline was followed foreach cultivar and with respective reference annotation toguide a Reference Annotation Based Assembly (RABT)to allow the detection of novel genes/isoforms [26, 27].Real-time quantitative RT-PCR was performed using1 μg of total RNA reverse transcribed with the Transcriptor High Fidelity cDNA Synthesis Kit, Roche. Amplification was carried out with a 7900HT Fast Real-Time PCRSystem (Applied Biosystems) using Power SYBR GreenMaster Mix (Applied Biosystems). There were 25 μl of reaction mixture containing: 0.5 μM of each primer and12.5 μl of SYBR GreenPCR master mix. Relative quantification was achieved by the ΔΔCT method [28]. The list ofprimers used is reported in Additional file 1: Table S1.DEG functional classification, GO enrichment analysis andgene copy number detectionFunctional annotation of novel genes was performed viaBlast2GO [29]. Plant MetGenMAP [30] was used to perform GO enrichment analysis at p-value cut-off of 0.05after Bonferroni correction. MapMan software [31] wasused for the pathway visualization of the DEGs andDEIs. Fold changes (FC) of the genes in the enrichedGO categories of interest were plotted in a frequencydistribution table, based on the frequency with whichthey were detected in each GO category. Genes with FCfalling outside the 90% boundaries of this frequency distribution were considered “outliers”. In order to identifymulty copy gene families a local blast database of allHeinz 1706, San Marzano and Vesuviano genes wasbuilt and the DEGs between the two locations for eachgenotype were subjected to a BLASTN search on the respective database to identify homologous genes using a1e-30 e-value threshold and nucleotide identity greaterthan 72%. The analysis was refined to keep blast resultsfor which the query coverage per subject was greaterthan 50%.Metabolome analysisLiquid chromatography-electrospray ionization- massspectrometry (LC-ESI-MS) analysis of the fruit semipolar metabolome was performed as previously described[32, 33] with slight modifications: 25 mg of freeze-dried,homogenized tomato fruit powder were extracted with0.75 ml cold 75% (v/v) methanol, 0.1% (v/v) formic acid,spiked with 10 μg ml-1 formononetin. After shaking for40 min at 20 Hz using a Mixer Mill 300 (Qiagen), sampleswere centrifuged for 15 min at 20,000 g at 4 C; 0.6 ml ofsupernatant were removed and transferred to HPLCtubes. For each genotype, at least two independent extractions from three independent pools were performed. LC-Page 3 of 18MS analyses were carried out using a LTQ-Orbitrap Discovery mass spectrometry system (Thermo Fisher Scientific) operating in positive electrospray ionization (ESI),coupled to an Accela U-HPLC system (Thermo FisherScientific, Waltham, MA). Liquid chromatography wascarried out using a Phenomenex C18 Luna column (150 2.0 mm, 3 μm). The mobile phase was composed by water 0.1% formic acid (A) and acetonitrile 0.1% formic acid(B). The gradient was: 95%A:5%B (one minute), a lineargradient to 25%A:75%B over 40 min, 2 min isocratic, before going back to the initial LC conditions in 18 min.Ten μl of each sample were injected and a flow of 0.2 mlwas used throughout the LC runs. Detection was carriedout continuously from 230 to 800 nm with an onlineAccela Surveyor photodiode array detector (PDA, ThermoFisher Scientific, Waltham, MA). Metabolites were quantified in a relative way by normalization on the internalstandard amounts. ESI-MS ionization was performedusing the following parameters: capillary voltage andtemperature were set at 25 V and 300 C; sheath and auxgas flow rate at, respectively, 40 and 25. Spray voltage wasset to 4 kV and tube lens at 90 V. Metabolite identificationwas performed by comparing chromatographic and spectral properties with standards and reference spectra at thePubchem database (http://pubchem.ncbi.nlm.nih.gov/) orthe Metabolomics Fiehn Lab Mass Spectrometry AdductCalculator cs/MS-Adduct-Calculator/). Liquid chromatography-Atmospheric pressure chemical ionization- mass spectrometry (LC-APCI-MS) analysis of fruit isoprenoids wasperformed as previously described [34].Sensorial analysisSensorial analyses were performed by a trained panel ofsix judges. For each variety in the two environments,twelve attributes were evaluated: two related to appearance (red color, color uniformity), five to flavor (sourness,saltiness, sweetness, flavor, odor), five to texture (flouriness, hardness, turgidity, juiciness, and skin resistance).Each panelist received three samples; then the panel ratedthe different parameters on a 0–10 scale. Analysis of variance (ANOVA) was used to identify significant variationin quality attributes between environments. Principalcomponent analysis (PCA) was used to explore the relationship between sensorial attributes and to ascertain thevariability of the sensory characteristics of Acerra andSarno. Sensory profiles were analyzed to assess the effectsof genotype, environment, and their interactions by twoway ANOVA.Network analysisPearson’s correlation coefficients were calculated for selected SM and RSV data points represented by all thesensorial attributes, DEGs related to fruit quality and
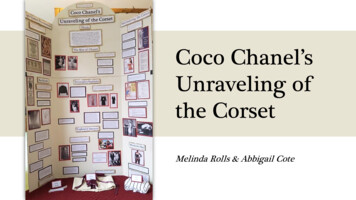
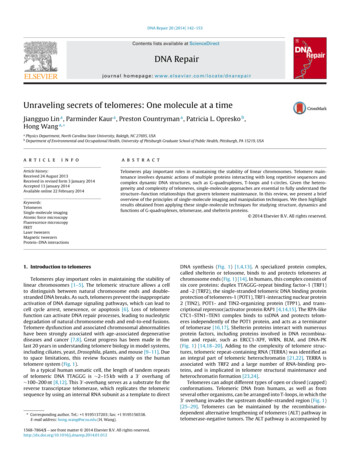
D’Esposito et al. BMC Plant Biology (2017) 17:66Page 4 of 18changed metabolites between the two environments(Additional file 2: Dataset S1-S4). All the data were normalized against the control represented by Heinz1706.Positive and negative correlations 0.8 and 0.8 wereconsidered for the construction of a dynamic networkand visualized with Cytoscape version 3.2.1 [35].ResultsTranscriptome sequencing and assemblyRNA-Seq libraries from three tomato (Solanum lycopersicum) varieties (H, SM and RSV), grown in two locationsin the southern Italian region Campania, namely at Sarno(Sa) and Acerra (Ac), were sequenced using Illumina technology, obtaining an average of 39.7 millions of fragmentsper sample (Additional file 1: Table S2). H, SM and RSVreads were mapped to the respective genome assemblies.The three varieties showed more than 19,000 expressedgenes on average, 17,382 of which were previously annotated and shared among the three plus an average of 2,255novel loci for variety (Table 1). Overall, the transcripts obtained showed a mean length of 1,852 base pairs (bp) anda mean N50 of 2,475 bp (Table 1). Functional annotationof novel genes allowed at least one Gene Ontology (GO)term to be assigned to 20% of the novel genes identified inthe reference genome SL2.40, to 8% of SM novel genesand to 10% of RSV novel genes (Additional file 2: DatasetS5, S6 and S7).Extent of gene expression variation in three tomatocultivarsThe three varieties, H, SM and RSV, expressed, respectively, a total of 20,164, 19,680 and 19,590 transcripts inboth localities. The H variety specifically expressed acore set of 993 genes, instead 615 and 669 genes wereexpressed in SM and in RSV respectively (Additional file1: Figure S2). Differentially expressed genes (DEGs) foreach genotype (H, SM and RSV) were computed comparing the expression levels in the two different environments (Ac and Sa). Figure 1a reports the number ofgenes that showed differential expression in H (595), inSM (801) and RSV (864). Interestingly, most of thehighly expressed DEGs were related to fruit quality in allTable 1 Transcriptome reconstruction statistics for Heinz 1706,San Marzano and Vesuviano cultivarsHeinz1706SanMarzanoVesuvianoKnown genes 4,724(38,243)Novel loci aximum length of transcripts242,963243,000243,266N50 length of transcripts2,3942,5112,522Mean length of transcripts1,784.851,864.371,883.92genotypes (Fig. 1b, c, and d). Fruit quality genes showingstructural variants in SM and RSV [20] were also investigated. Of 2,051 genes showing variants both in RSV andSM in comparison to H, 78 and 89 genes were differentiallyexpressed in SM and RSV, respectively, including a largenumber of genes encoding transcription factors/regulators.Of 626 and 184 genotype-specific genes with variants inSM and RSV, 24 and 9 genes proved to be differentiallyexpressed in the two genotypes. The DEGs with variants inSM were predominantly represented by cell wall enzymes(xyloglucan endotransglucosylase/hydrolase, glycosyltransferase, etc.) while in RSV by transcription factors (bZIP,MYB etc., Additional file 1: Table S3).Investigations of DEGs involved in fruit qualitydeterminationAn enrichment analysis was performed to identify GeneOntology (GO) terms over-represented in each genotypeirrespective of the environment (G), in each environment irrespective of the genotype (E) and in specificgenotype environment combinations (G E), followingthe scheme shown in Fig. 2a. The complete lists of GOterms enriched in the three comparisons are reported inAdditional file 2: Dataset S8-S13.Over-represented GO terms related to the environment areshown in Fig. 2b. Acerra-specific enriched GO terms were related to cell wall, ethylene and aspartate family amino acidswhile in Sarno to carbohydrate catabolism, serine familyamino acid metabolism and amine metabolism.Figure 2c and Additional file 1: Figure S5 show SM,SM Ac and SM Sa enriched GO terms related to fruitquality. Most of the SM enriched GO terms were relatedto amino acid and organic acid metabolism. It was noteworthy that although the two environments sharedenriched GO terms, specific sections within the generalmetabolism were mobilized in each G E interaction.For instance, SM Ac over-represented GO terms referring to amino acid metabolism were related to aromaticand aspartate amino acid families, while SM Sa GOpertained to serine family.Additional file 1: Figures S3, S4 and S5 show H andRSV enriched GO terms related to amino acid, ethylenemetabolism and cell wall and carbohydrate metabolism.Within each enriched GO term category, approximately10% of genes with fold change (FC) values falling in thetail of frequency distribution, were labeled as “outliers”between the two locations (Fig. 3a and b, right). This occurrence allowed us to identify and catalogue genotypeplastic genes (Additional file 1: Tables S4, S5 and S6).SM outlier genes included cell wall genes, mainly xyloglucan endotransglycosylase hydrolases (XTHs) andpectinesterases, and amino acid related genes such asdecarboxylases and chlorophyll-binding proteins(Fig. 3a and b, left).
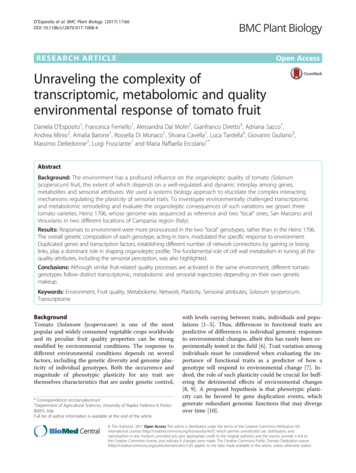
D’Esposito et al. BMC Plant Biology (2017) 17:66Page 5 of 18ABCDFig. 1 Changes in gene expression profiles. a Letters in figure legends should be in uppercase Number of up-regulated genes identified in the twolocations (Ac and Sa) for the three genotypes analyzed (H, SM and RSV). b, c and d List of top 10 up-regulated genes in both locations in H, SM andRSV, respectively. ACS: 1-aminocyclopropane-1-carboxylate synthase, PAL: Phenylalanine ammonia-lyase, MLP: Major latex-like protein, LOX: Lipoxygenase,MSP: Male sterility 5 family protein PPase: Pyrophosphate-energized proton pump, GASA2: Gibberellin-regulated protein 2, LHC: Chlorophyll a/b bindingprotein, ERF9: Ethylene-responsive transcription factor 9, EXO: Exocyst complex protein EXO70, PUB: U-box domain-containing protein, MORC: MORC familyCW-type zinc finger 3, Ole e 1: Pollen Ole e 1 allergen and extensin, XPR1: Xenotropic and polytropic retrovirus receptor, PUB15: U-box domain-containingprotein 15. Asterisks indicate genes absent in one location. To avoid an infinite fold-change of transcripts that did not express in one location,transcripts were augmented with small fragments per million of mapped reads (FPKM, 0,0001) prior to binary logarithmic transformation add apoint at end od each legendTranscription-regulated processes and gene copy numbervariationThe number of DEGs involved in the transcriptionaland post-translation was higher in Acerra for allthree genotypes, with SM showing the highest number of genes (Fig. 4a and b). Differentially expressednovel isoforms (DEIs) and alternative splicing (AS)events between the two locations were also identified(Fig. 4c and d, Additional file 1: Figure S6). In particular, differentially expressed isoforms related tocellulose biosynthesis were evidenced both in SMand RSV (Fig. 4d). Moreover in H 232 DEGs (39%)were members of multi-copy gene families, in SM,269 (33%), and in RSV, 316 (36%) (Additional file 1:Figure S7A). Most multi-copy families contained twoto three copies with up to 13 copies in H and SMand up to 23 copies in RSV (Additional file 1: FigureS7B). GO categories related to fruit quality included155, 145 and 140 DE genes, present in at least twocopies, in SM, RSV and H, respectively. Genes belonging to XTH family such as Solyc03g093110 andSolyc03g093120 displayed six copies with high similarity while Solyc03g093080 and Solyc03g093130 fivecopies (Additional file 1: Figure S7C).Environmental effects on metabolomics profileThe metabolite composition of H, SM and RSV wasclearly modulated by the environment and genotype(Fig. 5a). Fifty-eight, 105 and 93 metabolites showed significant differences between the two environments in H,SM and RSV respectively (Fig. 5b, Additional file 2:Dataset S14-S15). H produced 14 metabolites at higherlevel in Acerra and 44 in Sarno, SM showed a pronounced metabolite abundance in Sarno (101) whileRSV revealed 32 and 61 metabolites synthesized athigher level in Acerra and Sarno, respectively (Fig. 5b).The number of differentially regulated metabolites between genotypes (H vs. SM, H vs. RSV and RSV vs. SM)in each location is shown in Additional file 1: Figure S8.In SM, secondary metabolites (alkaloids, phenylpropanoids, some carotenoids such as lutein, β- and δcarotene), vitamins and many amino acids exhibited asignificant increase in Sarno (Fig. 6). In H a higher levelof sugars and of nucleic acid precursor metabolites(adenine, adenosine, guanine) in Acerra and of some alkaloids (tomatidine, hydroxy-tomatine, kukoamine C, etc.)in Sarno was noticed (Additional file 1: Figure S9). In RSV,sugars and most of organic acids were increased in Acerraand amino acids, most of alkaloids, phenylpropanoids and
D’Esposito et al. BMC Plant Biology (2017) 17:66Page 6 of 18Fig. 2 Gene ontology enrichment analysis. a Scheme for classifying over-represented gene classes. For each genotype Acerra-specific (Ac) andSarno-specific (Sa) enriched GO terms were identified. Enriched GO terms common to both environments (G) in each genotype (H, SM and RSV)were also identified. By crossing enriched GO terms in Acerra from all three genotypes, Acerra-specific and Acerra Genotype interactions wereidentified. The same scheme was used to identify Sarno-specific enriched GO terms as well as Sarno Genotype interactions. b Environmentspecific enriched GO categories. Left) Acerra-specific enriched GO terms. Right) Sarno-specific enriched GO terms. c San Marzano GO EnrichmentAnalysis. The Venn diagram shows common and specific enriched GO terms. Bar plots reflect the percentage of genes in the enriched categories ofthe San Marzano Acerra (left), Sarno (right) and common (below), as well as the percentage of genes belonging to the same categories in tomatogenome. Common enriched GO categories are reported for both environments because some categories, although enriched in both conditions, havea different percentage of genes. m.p. metabolic process, b.p. biological process, c.p. catabolic processearly carotenoids (phytoene, phytofluene and ζ-carotene)in Sarno (Additional file 1: Figure S10). Metabolite responses to the two environments were even moregenotype-specific than transcriptional ones: of the 41 metabolites up-regulated in Acerra with respect to Sarno, 33(80.5%) were genotype specific (Fig. 5c, left). This trendwas evident, albeit to a lesser extent, for metabolites upregulated in Sarno with respect to Acerra: of the 132 metabolites up-regulated in this location, 76 (57.6%), weregenotype-specific (Fig. 5c, right). We also attempted toidentify the major metabolites responsible for the separation of the two environments. Principal component analysis (PCA, Fig. 5d) revealed that for H, adenosine,anthranilic acid and sucrose were responsible for themajor difference between Acerra and Sarno; for SM, glutamic acid, glutamine, 5-oxoproline and tryptophan werethe main drivers of the separation between the two environments; for RSV, phenylalanine, 5-oxoproline, sucrose,aconitic acid and leucine have discrimination power between the two environments.Assessment of fruit sensory profilesIn order to gain further insight into the mechanisms thatregulate fruit organoleptic quality traits in tomato, a sensory analysis on ripe fruits harvested in the two fieldswas performed through descriptive profiling. Two wayanalysis of variance (ANOVA, Additional file 1: Table S7)
D’Esposito et al. BMC Plant Biology (2017) 17:66Page 7 of 18ABFig. 3 Outliers gene detection. Frequency distribution of fold change (FC) classes between locations in each enriched GO category in SM Acerra(a) and Sarno (b). Right: heat map of FPKM (Fragments per million of mapped reads) values for outlier genes in SM Acerra and SM Sarno. Green,yellow and blue indicate medium, low and high FPKM levels, respectivelyshowed significant differences according to the environment (E) or genotype (G) effect.The PCA plot for each genotype is reported in Fig. 7.For H, the main contributors to total variance betweenthe two environments were tomato flavor, color, juiciness, flouriness and hardness. For SM sensorial attributes contributing to the variance between the twoenvironments were color, color uniformity, odor, turgidity, sourness and saltiness. For RSV, 32.8% of the totalvariance was explained by juiciness, flouriness, skin resistance, saltiness, odor and flavor.Correlation-based network analysisWe next integrated transcript, metabolite and sensorialdata in order to visualize the network of relationshipsbetween fields both for SM and RSV. Conserved andenvironment-specific regulatory paths as well as specificenvironment interactions were evidenced. Locationspecific hubs included important fruit quality categories,highlighting a strong correlation among different components of fruit metabolism.In SM, the top 10% of hubs evidenced in each environment are reported in Additional file 1: Fig. S11.Four common regulatory hubs (Solyc03g093130, Solyc03g094160, Solyc04g071480, Solyc08g007770) wereidentified (Additional file 1: Fig. S11). Solyc03g093130, anXTH located on chromosome 3, displayed in both environments a positive correlation with the textural attributehardness as well as with other common regulatory hubswhile in Acerra a specific positive correlation was established with turgidity, sourness and juiciness (Fig. 8a). Inboth environments, Solyc03g093130 showed positive correlations with three other XTHs on chromosome 3(Solyc03g093080, Solyc03g093110 and Solyc03g093120).By contrast, an XTH located on the chromosome 12 presented specific edges exclusively in Acerra. In Sarno therewas a positive correlation of the XTH hub Solyc03g93130with skin resistance and a negative correlation with juiciness (Fig. 8a). The level of conservation and innovation interms of edges of the XTH gene family is described inmore detail in Fig. 8b. Different genes/isoforms and transcription factors involved in the ethylene biosynthesis alsoshowed to have a dominant role in shaping environment
D’Esposito et al. BMC Plant Biology (2017) 17:66Page 8 of 18ABCDFig. 4 Molecular regulation of gene expression in SM. a DEGs mapped to the transcriptional regulation process (left). SM DE Transcription factorclassification (right). b DEGs mapped to post-translational regulation process (left). SM DEGs mapped to ubiquitin dependent degradation process.c Number of up-regulated isoforms identified in the three genotypes in both locations. d DEI assigned to fruit quality metabolic pathways ineach genotyperesponse. Solyc08g081540, an 1-Aminocyclopropane-1carboxylic acid synthase 6 (ACS6), in Acerra wa
Real-time quantitative RT-PCR was performed using 1 μg of total RNA reverse transcribed with the Transcrip-tor High Fidelity cDNA Synthesis Kit, Roche. Amplifica-tion was carried out with a 7900HT Fast Real-Time PCR System (Applied Biosystems) using Power SYBR Green Master Mix (Applied Biosystems). There were 25 μlofre-