Transcription
July 2019Economic ProfileJuly 2019Business Intelligence Service1
July 2019Introduction and BackgroundThe economic profile considers a wide range of factors that affect the people of Warrington.The objective is to use the most recently available data to provide a view of the currenteconomic situation within the borough. The majority of information is provided via the ONS(Office for National Statistics) and is licenced under the terms of the Open GovernmentLicence v3.0. The population figures from the ONS are rounded to the nearest hundred andtherefore they may not sum correctly and percentages may not equal 100%. 1Summary: Warrington’s resident population estimate for mid-2018 was 209,500; of these104,000 are male and 105,500 are female.Warrington’s 0-15 population is 39,700 (19% of the total); Warrington’s 16-64population is 131,000 (63% of the total) and Warrington’s 65 and overpopulation is 38,900 (19% of the total). These figures and percentages arerounded and don’t add up to 100%. Warrington’s broad age percentages arevery similar to those in the North West as a whole and nationally (England andWales).15 and under: 39, 70016 to 64: 131, 00065 and over: 38, 900NB: Percentages rounded and don’t equal 100% 1The latest employment levels (January to December 2018) for the 16 to 64population is 77.1%, a slight fall from previous quarters.Unemployment levels in Warrington remain fairly stable, but have seen a recentincrease from 3.7% to 4.0% in 2018.The largest areas for employment in Warrington are Professional, scientific andtechnical services, as well as Wholesale and Retail Trade, Repair of MotorVehicles services.The population figures from the ONS are rounded to the nearest hundred and therefore they may not sum correctly andpercentages may not equal 100%.2
July 2019 Warrington (at 40.5%) has a higher rate of the population with a NVQ level 4qualification than the North West (35.5%) and England (39.0%).The main occupations in Warrington are professional occupations and associateprofessional & technical.Regional Gross Value Added (GVA) is a measure of the increase in the value of theeconomy due to the production of goods and services. In Warrington the GVA wasworth 6,848 million in 2017, with the largest area being Administrative &support services and Wholesale & retail and motor vehicle repair.The number of businesses active at any stage in 2017 was 11,245, significantlymore than in 2016 (27% increase). Over 90% of businesses have nine or feweremployees.The average gross wage for people who reside in Warrington ( 569.50) is higherthan the North West ( 529.60) but lower than England overall ( 574.90). Thedifference in Warrington in wages between males and females who reside in theborough is 18.5% (Male: 632.40; Female: 515.70).The average gross wage for people who work in Warrington ( 546.80) is higherthan the North West ( 529.60) but lower than England overall ( 574.90). Thedifference in Warrington in wages between males and females who work in theborough is 10.3% (Male: 567.50; Female: 509.40).Population and Demographics:The following information summarises the population of Warrington. Where possible, 2018mid-year population estimates are used. The resident population of Warrington for mid-year 2018 is estimated at 209,500,lower than the mid-year 2017 estimate (of 209,700).There are an estimated 96,030 residential properties and 9,572 commercialproperties in Warrington (as at September 2018).The population of children aged 0-15 in Warrington is estimated at 39,700 (19% ofWarrington’s population). Of the 0-15 year-olds in Warrington, 51.5% are male and48.5% are female.The working age population (16 to 64) is estimated at 131,000 (63% of Warrington’spopulation. Of the 16-64 year olds in Warrington, 50.3% are male and 49.7% arefemale.The population of older people (65 and over) is estimated at 38,900 (19% ofWarrington’s population). Of the 65 and over in Warrington, 45.7% are male and54.3% are female.The median age is 42, and the largest age group, by 5-year band, is the 50-54 agegroup (16,300) accounting for 7.8% of the total Warrington population.There are 11.5 residents per hectare in 2018; this is an increase from the 2011census figure of 11.2 residents per hectare.There are an estimated 104,000 males (49.7%) and 105,500 females (50.3%).3
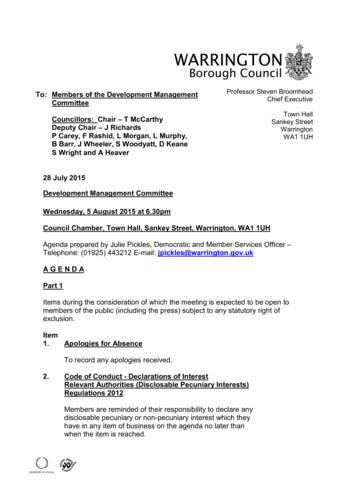
July 2019The breakdown by broad age band for Warrington by males and females is as follows:Table 1: Warrington Resident Population Mid-2017, by Broad Age Group and GenderAge0 to 1516 to 6465 and overTotalMalesNo. People% 0%FemalesNo. People% 0%PersonsNo. People% .0%Source: ONS population estimates mid-2018, Crown copyright reserved. This information is licensed under the terms of the OpenGovernment Licence v3.0. Figures rounded to the nearest hundred and may not sum exactly due to rounding.Each ward within Warrington has a differing breakdown of the Broad Age Groups, forexample Poplars and Hulme has a larger percentage of its population in the 0-15 age groupwhile Penketh and Cuerdley has a larger percentage of its population in the 65 and over agegroup. Ward level data for mid-year 2018 estimates isn’t available until late 2019. Chart 1below shows the differences in Broad Age Group:Chart 1: Resident Warrington Ward Population by Broad Age Group, Mid-2017Source: ONS population estimates mid-2017, Crown copyright reserved. This information is licensed under the terms of the OpenGovernment Licence v3.0.4
July 2019Warrington is projected to increase population over the next twenty years (between 2016and 2036) by over 16,000. In the shorter term Warrington’s population is estimated toincrease by 4.6% (between 2016 and 2026) and the working age population increasing by0.5% during the same period. The table on the following page shows the projected increasein population:Table 2: Projected Population Change in Warrington from 2016 to 2026Aged 65 To 20181.3%0.2%3.4%To 20202.5%0.3%7.2%To 20223.5%0.5%10.9%To 20243.5%0.5%15.6%To 20263.0%0.5%20.7%All Ages1.0%2.0%3.0%3.8%4.6%Aged 0 to 15Aged 16 to 64Source: ONS Interim Population Projections mid-2016 to 2026 licensed under the terms of the Open Government Licence v3.0.Warrington’s life expectancy at birth has increased for males from 75.7 in 2001-2003 to 78.9in 2015-2017 (a percentage increase 4.3%). The life expectancy of females in Warringtonduring the same period has increased from 80.0 to 82.4 (a percentage increase of 3.0%). Theages are rounded and therefore the percentage increases may not sum correctly.Employment and Unemployment:Local employment and the types of jobs provided can be established with the AnnualPopulation Survey and the Business Register and Employment Survey (BRES). Warrington’semployment has seen slight falls in the last couple of years (see Chart 2 on the followingpage). Latest data relates to January 2018 to December 2018.5
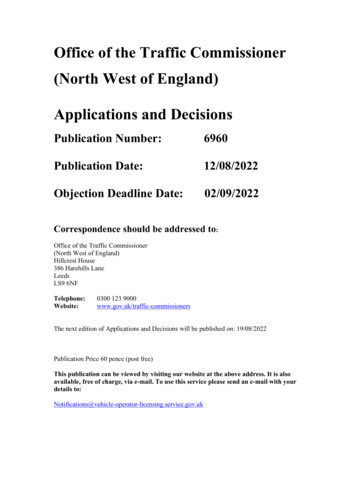
July 2019Chart 2: Warrington’s 16-64 population in employment is slightly fallingSource: ONS Annual Population Survey, Crown copyright reserved. This information is licensed under the terms of the OpenGovernment Licence v3.0.Warrington’s population (16 to 64) in employment has remained fairly stable, though thelatest figures (January to December 2018) continues a recent trend of falling percentage inemployment. As a percentage of the overall population Warrington currently has 48.4% inemployment.The largest areas of employment in Warrington are Professional, scientific and technicalservices (approximately 22,000 employees) and Wholesale and Retail Trade, Repair ofMotor Vehicles services (approximately 21,000 employees).Professional, scientificand technical servicesWholesale & Retail;Motor Vehicle Repair16%16%These two areas represent nearly a third of the workforce in Warrington. Chart 3 (on thefollowing page) shows the percentage in employment in all industry types.6
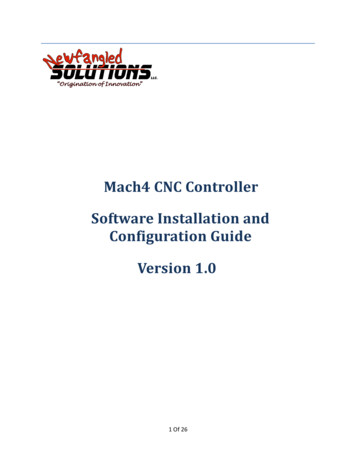
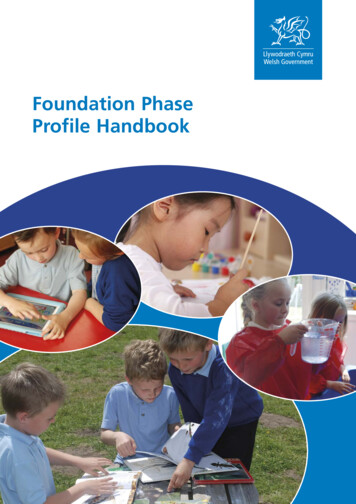
July 2019Chart 3: Warrington’s employee jobs by Industry typeSource: ONS Business Register and Employment Survey, Crown copyright reserved. This information is licensed underthe terms of the Open Government Licence v3.0.The total number of employed has increased over the last five years with the percentageworking in the private sector increasing from 84% to 86%. Private sector employment hasincreased from 101,300 in 2013 to 118,100 in 2017 (conversely public sector employmenthas fell from 20,000 to 18,700 during the same period). During the last year (between 2016and 2017) total employment has fell (see Chart 4 below).Chart 4: Over 86% of Warrington’s employment is in the private sectorSource: ONS Business Register and Employment Survey, Crown copyright reserved. This information is licensed underthe terms of the Open Government Licence v3.0.7
July 2019In terms of Warrington’s economically inactive (during 2018) there’s 27,100, or 21.0% ofthose aged 16-64, which is lower than both the North West and Great Britain overall. Themain categories of inactivity are Students (7,000), Looking after Family/Home (5,800) andRetired (5,600). The Retired percentage in Warrington (at 20.7% of those economicallyinactive) is considerably higher than the North West (13.5%) and Great Britain (13.2%).The ONS Regional Labour Market has shown that Warrington’s unemployment rate has fellin all years from 2011 up to 2017, though latest figures show a slight increase to 4.0%, seeChart 5.Chart 5: Warrington’s unemployment rate remains stableSource: ONS Regional Labour Market, Crown copyright reserved. This information is licensed under the terms of the Open GovernmentLicence v3.0.Skills and Qualifications:Warrington has a higher percentage of residents with and NVQ level 4 (Higher EducationCertificate/BTEC) or above qualification when compared with the North West and Englandoverall. Warrington has 40.5% of residents at NVQ4 and above compared to 39.0% inEngland and 35.5% in the North West. Over the last decade Warrington has nearly alwaysbeen above the North West and England averages for residents having an NVQ4 or abovequalification. The general trend has seen increases over the last ten years in Warrington, theNorth West and England (see Chart 6 on the following page).8
July 2019Chart 6: More than 40% of Warrington residents have a qualification at NVQ4 and aboveSource: ONS Annual Population Survey, Crown copyright reserved. This information is licensed under the terms of the OpenGovernment Licence v3.0.In terms of all levels of education, Warrington is above both the North West (84.8%) andEngland (85.6%) with 87.3% having any qualification at NVQ1 and above. The chart below(Chart 7) shows that Warrington compares favourably at all levels.Chart 7: Warrington is higher than comparators at all qualification levelsSource: ONS Annual Population Survey, Crown copyright reserved. This information is licensed under the terms of the OpenGovernment Licence v3.0.In terms of occupations (Standard Occupational Classification) in Warrington the largestareas are professional occupations and associate professional and technical. Warrington haslower numbers working in process plant and machine operatives. Chart 8, on the followingpage, shows how Warrington compares against the North West and Great Britain overall.9
July 2019Chart 8: Warrington’s main occupations are Professional and Associate ProfessionalSource: ONS Annual Population Survey, Crown copyright reserved. This information is licensed under the terms of the OpenGovernment Licence v3.0.Nearly half of Warrington’s employment (48.2%) is in the top three categories, again this ishigher than both comparators.Gross Value Added:Regional Gross Value Added (GVA) is the value generated by any unit engaged in theproduction of goods and services, it relates to where people work rather than where theylive. The total Gross Value Added for Warrington was 6,848 million in 2017, an increase of28% in the ten year from the 2008 figure of 5,358 million. See Chart 9 on the followingpage.The main business sectors which contribute to Warrington’s GVA figure are Administrativeand support services and Wholesale and retail trade; repair of motor vehicles. These twobusiness sectors makes up almost a quarter of the total GVA (24.5%).10
July 2019Administrative andSupport ServicesWholesale & Retail;Motor Vehicle RepairManufacturing 884 million 794 million 646 millionChart 9: Warrington’s GVA has increased by 28% in the last 10 yearsSource: ONS Regional economic activity, Crown copyright reserved. This information is licensed under the terms of the OpenGovernment Licence v3.0.11
July 2019In terms of GVA per head, in 2017, Warrington’s figure was 32,654, an increase of 21% inthe ten years from the 2008 figure of 27,033. The 2017 figure is higher than the overall UKfigure of 27,298 per head, see Chart 10 below.Chart 10: Warrington’s GVA per head is consistently higher than the UK averageSource: ONS Regional economic activity, Crown copyright reserved. This information is licensed under the terms of the OpenGovernment Licence v3.0.Business and Enterprise:The number of business enterprises active in Warrington during 2017 was 11,245,significantly more (a 27% increase) on the 2016 figure. The number of enterprises had beensteadily increasing in previous years but to a lesser extent (See Chart 11 on the followingpage). Warrington’s increase in active enterprises is much higher than the North West (7.7%increase) and England (3.3%).12
July 2019Chart 11: Warrington’s active enterprises have increased significantly from 2016 to 2017Source: ONS Business demography, Crown copyright reserved. This information is licensed under the terms of the Open GovernmentLicence v3.0.In terms of the size, Warrington has a higher percentage of micro enterprises (those with 9or fewer employees) than the North West and England. Warrington has over 90% in thiscategory (90.7% in Warrington compared with 88.9% in the North West and 89.5% inEngland). Conversely, Warrington has a lower percentage in small enterprises (thoseemploying between 10 and 49 people) with 7.2% in Warrington compared with 9.1% in theNorth West and 8.6% in England. Combining the micro and small enterprises Warrington(97.9%) and the North West (98.0%) and England (98.1%) are all very similar. See chart 12on the following page.13
July 2019Chart 12: Warrington has a higher percentage of micro enterprises than comparatorsSource: ONS Inter Departmental Business Register, Crown copyright reserved. This information is licensed under the terms of the OpenGovernment Licence v3.0.The one-year survival rate for new enterprises in Warrington over the last five years hasbeen around the 90% mark with a high of 93.6% for businesses started in 2011 and 2013;the lowest survival rate was for businesses born in 2010 at 87.2%, see chart 13 below.Warrington has had a slightly higher average survival rate when compared with the NorthWest and England over this time period.Chart 13: Most recently over 90% of enterprises last for longer than one year.Source: ONS Inter Departmental Business Register, Crown copyright reserved. This information is licensed under the terms of the OpenGovernment Licence v3.0.14
July 2019Taking a longer term view, after three years Warrington has a survival rate at 60.1% - slightlybetter than the comparators, but after five years the survival rate is 42.6% - slightly worsethan the comparators, see chart 14.Chart 14: Warrington’s enterprise survival is worse than comparators over five yearsSource: ONS Inter Departmental Business Register, Crown copyright reserved. This information is licensed under the terms of the OpenGovernment Licence v3.0.Wages and Earnings:The average gross wage for people who reside in Warrington was 569.50 in 2018. Theaverage male wage was 632.40 compared with a female average of 515.70 – a differenceof 116.70 (18.5% lower). Warrington’s average gross wage is 7.0% higher than the NorthWest average ( 529.60) but is 0.9% lower than the England average ( 574.90). Over the lastten years Warrington has remained fairly similar to the England average and has beenconsistently above the North West average, see Chart 15 on the following page.15
July 2019Chart 15: Warrington’s weekly pay remains above the North West averageSource: ONS annual survey of hours and earnings, Crown copyright reserved. This information is licensed under the terms of the OpenGovernment Licence v3.0.The average gross wage for people who work in Warrington was 546.30 in 2018. Theaverage male wage was 567.60 compared with a female average of 509.40 – a differenceof 58.20 (10.3% lower). Warrington’s average gross wage is 3.1% higher than the NorthWest average ( 529.60) but is 5.2% lower than the England average ( 574.90). Over the lastten years Warrington has consistently been between the England and North West averagefigures, see Chart 16 below.Chart 16: Warrington’s weekly pay remains between England and North West averagesSource: ONS annual survey of hours and earnings, Crown copyright reserved. This information is licensed under the terms of the OpenGovernment Licence v3.0.Produced by the Business Intelligence Service businessintelligence@warrington.gov.uk16
July 2019ReferencesOffice for National Statistics (2018) Mid Year tes[Accessed: June 2019]Office for National Statistics, (2018) Mid-2017 Population Estimates for 2017 Wards InEngland and Wales by Single Year of Age and ental[Accessed: June 2019]Office for National Statistics, (2018) Life expectancy at birth and at age 65 years by localareas, easuk[Accessed: June 2019]Icons made by Freepik from www.flaticon.comNomisweb Labour Market Profile - WarringtonOffice for National Statistics, (2019) Model-based estimates of 1[Accessed: June 2019]17
The working age population (16 to 64) is estimated at 131,000 (63% of Warrington's population. Of the 16-64 year olds in Warrington, 50.3% are male and 49.7% are female. The population of older people (65 and over) is estimated at 38,900 (19% of Warrington's population). Of the 65 and over in Warrington, 45.7% are male and