Transcription
Final ReportEconomic Impacts of theSan Diego Unified Port District in2017Prepared for:San Diego Unified Port DistrictPrepared by:Economic & Planning Systems, Inc.February 28, 2019EPS #171158
Table of Contents1.INTRODUCTION AND KEY FINDINGS . 1Introduction . 1Background. 1Scope of the Analysis . 3Summary of Methodology . 5Key Findings . 72.PORT DISTRICT OVERVIEW . 14Port District Tidelands and Submerged Lands . 143.THE BLUE ECONOMY . 164.ECONOMIC IMPACTS METHODOLOGY . 20Description of Economic Impacts . 20Data Collection and Analysis . 21Overview of Input-Output Methodology . 215.ANALYSIS OF DIRECT ECONOMIC ACTIVITY . 22Economic Impact by Port Planning Districts . 256.TAX REVENUE EFFECTS. 30
List of FiguresFigure 1San Diego Unified Port District Jurisdiction Map . 4Figure 2Economic Impact of the District in San Diego County in 2017 . 8Figure 3Employment Impacts by Industry Group . 9Figure 4Economic Output Impacts by Industry Group. 9Figure 5Visitor Volume in San Diego County 2007-2017 . 10Figure 6Manufacturing Employment in San Diego County 2007-2017 . 10Figure 7Direct Employment Attributable to the District in 2013, 2015, and 2017 . 11Figure 8Direct Economic Output Attributable to the District in 2013, 2015, and 2017. 11Figure 9Distribution of Total Economic Impact by Port Planning District . 13Figure 10 Port Master Plan Land and Water Use Allocation Summary . 15Figure 11 Summary of Direct Effects by Economic Activity . 22Figure 12 San Diego Cruise Passengers and Cruise Calls 2000-2017 . 24Figure 13 Map of Port District’s Planning Districts . 27Figure 14 Economic Impact of the District in San Diego County in 2017 by Geography . 29Figure 15 Summary of 2017 Tax Revenues from District Tenants . 31Figure 16 Tax Revenue Estimate Comparisons . 31
1.INTRODUCTION AND KEY FINDINGSIntroductionThe San Diego Unified Port District (District) retained Economic & Planning Systems (EPS) toprepare an updated economic impact analysis of operations on District property. 1 This studyreflects economic activity during calendar year 2017 and relies on a methodological approachthat is generally consistent with previous studies of the District. Economic impact estimates relyon EPS analysis of Port leasing and GIS data, interviews with key employers, and considerationof regional economic conditions and trends. As was the case in prior economic impact studies,the results contained in this study reflect a significant level of Port District staff involvement. Inassessing the economic impact of the cruise industry and maritime cargo activities, this 2017update extrapolates data from expert studies conducted in 2015, based on Port-reported cruiseship and cargo volumes. 2, 3 The study also provides a review of the District’s recent efforts topromote new “Blue Economy” business opportunities in and around San Diego Bay.The key outputs of this study are quantitative estimates of spending and employmentattributable to the District. In addition to capturing the “direct” economic activities supported bythe District, the analysis estimates “ripple” or “multiplier” effects. Ripple effects include “indirect”and “induced” spending that stems from economic activity on District property. 4 For example,businesses operating on District land commonly purchase inputs to production from within theCounty. In addition, household spending by employees whose jobs are attributable to the Districtis considered.BackgroundThe District is a public benefit corporation and regional government agency. It controls about2,400 acres of land and about 3,500 acres of water spread across its five member cityjurisdictions of Chula Vista, Coronado, Imperial Beach, National City, and San Diego. With controlof more than 34 of the 54 total miles along the San Diego Bay, the District plays an important1See prior studies including (1) Economic Impacts of the San Diego Unified Port District in 2015,Economic & Planning Systems, December 20, 2016; (2) Economic Impacts of the San Diego UnifiedPort District, Economic & Planning Systems, February 25, 2015; and (3) San Diego Unified PortDistrict: Economic Impact on San Diego County and the State of California, Economic & PlanningSystems in association with Martin Associates, and BREA, September 9, 2013.2The Local and Regional Economic Impacts of the Port of San Diego Marine Terminals, MartinAssociates, August 1, 2016.3Economic Impact Analysis of the San Diego Cruise Sector 2015, Business Research & EconomicAdvisors (BREA), June 2016.4See Overview of Input-Output Methodology for a detailed description of “indirect” and “induced”effects.Economic & Planning Systems, Inc.1P:\171000s\171158 SanDiegoPort Impact\Deliverables\171158 Report 2.28.19.docx
Economic Impacts of the San Diego Unified Port District in 2017Final Report – February 2019role in administering a unique maritime, visitor-serving,environmental, and recreational asset, while alsoprotecting the Tidelands of San Diego Bay for the peoplewho live, work, and visit there. 5 The bay and itswaterfront are essential elements of the San Diegogeography, economy, and culture, serving as: A strategically located harbor for trade, cruise, andmilitary uses; A workplace for marine cargo, shipbuilding and repair,commercial fishing, boat tours and other waterdependent industries; An important recreational and environmental asset forurban residents; A national and international destination for visitorsand convention attendees; and A venue for special events, drawing hundreds ofthousands of people to the waterfront for the July 4thBig Bay Boom, San Diego Bay Parade of Lights, andthe San Diego Summer Pops series, among others.This study measuresjobs and economicactivity: Originating onDistrict property in2017 Categorized intotwo industrygroups:(1) Tourism andCommercialActivity(2) Industrial andMaritimeCommerce Within the SanBy virtue of its size and responsibility for administeringDiego Countythe scenic, strategic, and economically crucial San Diegoeconomy.bayfront, the District plays an important role in theregional economy and as a provider of recreationalopportunities and environmental stewardship. Throughthe San Diego Harbor Police Department, the Districtserves as a key public safety agency and partner to local,state and federal entities in the security of San Diego Bay and high-value assets that includemaritime cargo terminals, major shipyards, military installations, San Diego International Airport,a convention center, and prominent visitor-serving establishments. To balance competingdemands for scarce space along the bayfront, the District must allocate its resources amongcommerce, industry, navigation, fisheries, tourism, environmental needs, and recreationaldemands, responding to changing requirements on an ongoing basis.As part of its effort to understand how the District can best utilize its assets for the benefit of theregion, the District retained EPS to analyze the impacts businesses and other entities locatedwithin the District’s jurisdiction have on the regional economy. The District commissioned similarstudies in 2015, 2014, 2013, 2007, 2003, 1999, and 1992.5Current estimates of acreage and shoreline under District control provided to EPS by Port staff.Economic & Planning Systems, Inc.2P:\171000s\171158 SanDiegoPort Impact\Deliverables\171158 Report 2.28.19.docx
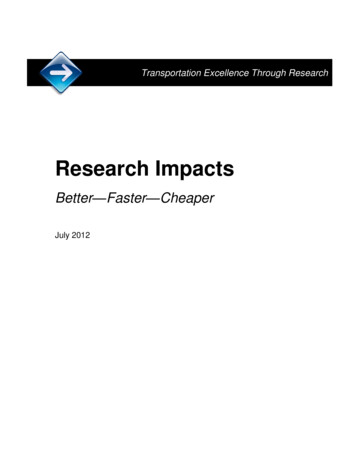
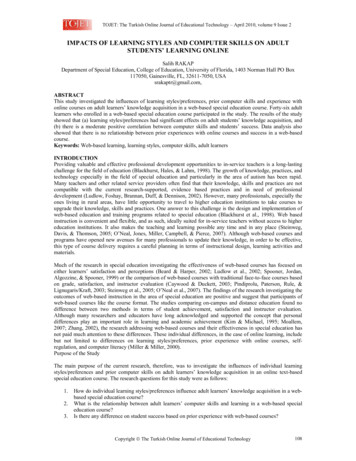
Economic Impacts of the San Diego Unified Port District in 2017Final Report – February 2019Scope of the AnalysisThe study analyzes impacts by geographic area for a specific point in time and assesses impactsby type of establishment. The categorization of establishments is consistent with those used inprevious Port District analyses. These categories have been continued in this report forcomparability.GeographicAreaFigure 1 provides a map of the land and water within the District’sjurisdiction. The analysis examines all of the economic activity (revenues andjobs) that take place on, or are directly attributable to, land and water areasadministered by the District, with the exception of military installations andthe San Diego International Airport. 6TimeframeThe report focuses on economic activity in 2017, the last complete calendaryear for which data was available at the start of the analysis.BusinessCategoriesPrevious District economic analyses have reported results for two categories ofestablishments: (1) Tourism and Commercial and (2) Industrial and Maritime.The Tourism and Commercial category includes retail, recreation andhospitality establishments, as well as most convention and cruise industryspending. 7 The Industrial and Maritime category includes maritime cargooperations, manufacturing, ship repair, marine terminal and cargo-relatedfirms, and wholesalers.6As a federal entity, military uses are not subject to local controls. Accordingly, the District haslimited influence over economic activities on those lands. Furthermore, the military’s role in theregional economy is frequently examined by many sources, including a periodic report called the SanDiego Military Economic Impact Study published by the San Diego Military Advisory Council (SDMAC).Also, San Diego International Airport is not part of the analysis as it is governed by the San DiegoCounty Regional Airport Authority, an agency that was created when the airport was separated fromthe Port District in 2003.7Some cruise industry spending occurring on District land is categorized as Industrial and Maritime,depending on the business type at which the spending occurs.Economic & Planning Systems, Inc.3P:\171000s\171158 SanDiegoPort Impact\Deliverables\171158 Report 2.28.19.docx
Economic Impacts of the San Diego Unified Port District in 2017Final Report – February 2019Figure 1San Diego Unified Port District Jurisdiction MapSource: Port of San Diego (Note that San Diego International Airport and military establishments are not analyzed in this report.)Economic & Planning Systems, Inc.4P:\171000s\171158 SanDiegoPort Impact\Deliverables\171158 Report 2.28.19.docx
Economic Impacts of the San Diego Unified Port District in 2017Final Report – February 2019Summary of MethodologyEconomic Impacts Analysis OverviewThe core economic impact of the District derives from the economic activities—sales andemployment—that occur on District property. The analysis of these activities includes estimatesof economic activity at private businesses, public sector entities, and other organizations locatedon District property. This on-site economic activity and associated employment on District land isa direct effect of the District. In addition, spending by cruise passengers, cruise ship crews, andconvention center attendees that occurs off of District property also is a direct effect of theDistrict. These off-site effects are attributable to the cruise ship terminal and the conventioncenter, facilities sited on District property. 8The analysis relies on estimates of direct effects of the District to determine the total economiceffect countywide. The analysis uses IMPLAN, a highly regarded “Input-Output” modelencompassing up-to-date economic information for San Diego County. IMPLAN analysis revealsindustry-specific multiplier effects. These effects are categorized as indirect or induced effects. Indirect Effects: economic impacts on upstream businesses that supply inputs (goods andservices) to production. Induced Effects: economic impacts that are generated by household expenditures made byemployees.Summary of TasksThe research effort supporting this report included extensive data collection and analysis.Analytical methods were based on the approach developed in earlier impact analyses (2011,2013, and 2015). This 2017 analysis relies on updated District data and an updated economicmodel. The procedures for the analysis are described below.Data Collection Review District data. The District provided tenant databases, information on gross sales(for tenants operating under leases that require sales reporting), and information about itsstaffing. In addition, publicly available docume
The core economic impact of the District derives from the economic activities—sales and employment—that occur on District property. The analysis of these activities includes estimates of economic activity at private businesses, public sector entities, and other organizations located on District property. This on-site economic activity and associated employment on District land is a direct .