Transcription
INDEX METHODOLOGYMSCI TOTALSHAREHOLDER YIELDINDEXES METHODOLOGYApril 2015APRIL 2015
MSCI TOTAL SHAREHOLDER YIELD INDEXES METHODOLOGY APRIL 2015CONTENTS1Introduction . 32Index Construction Methodology . 432.1Defining the Eligible Universe . 42.2Determination of Total Shareholder Yield Score . 42.2.1Winsorizing Buyback Yield, Dividend Yield and Debt Reduction Yield .42.2.2Calculating the Z-Scores .52.2.3Calculating the Total Shareholder Yield Score .52.3Security Inclusion . 62.4Weighting Scheme . 6Maintaining MSCI Total Shareholder Yield Indexes . 73.1Annual Index Reviews . 73.1.13.2Buffer Rules:.7Ongoing Event Related changes. 73.2.1IPOs and other early inclusions .73.2.2Additions and Deletions due to corporate events .7Appendix I: Calculation of Fundamental Variables . 9Appendix II: Rules to Determine Fixed Number of Securities at InitialConstruction and in Ongoing Rebalancing . 10Appendix III: Corporate Events Treatment . 12 2015 MSCI Inc. All rights reserved. Please refer to the disclaimer at the end of this document.MSCI.COM PAGE 2 OF 15
MSCI TOTAL SHAREHOLDER YIELD INDEXES METHODOLOGY APRIL 20151INTRODUCTIONThe MSCI Total Shareholder Yield Indexes aim to reflect performance of companies thatreturn cash to shareholders either through buybacks or by paying dividends. These Indexestarget companies that have returned capital directly to the equity shareholders (as opposedto the debt holders) and seek to minimize their exposure to the companies that have raiseddebt levels to support inter alia these capital repayments.MSCI categorizes the MSCI Total Shareholder Yield Indexes as Factor Indexes (Risk Premia),which reflect the systematic elements of particular investment styles or strategies. Whilecapitalization weighted indexes represent the broad market beta, investors increasinglyrecognize that there are additional sources of systematic return associated with particularinvestment styles and strategies, such as value, momentum, volatility, etc., that could berepresented through alternatively weighted indexes. 2015 MSCI Inc. All rights reserved. Please refer to the disclaimer at the end of this document.MSCI.COM PAGE 3 OF 15
MSCI TOTAL SHAREHOLDER YIELD INDEXES METHODOLOGY APRIL 20152INDEX CONSTRUCTION METHODOLOGY2.1DEFINING THE ELIGIBLE UNIVERSEThe applicable universe includes all the existing constituents of an underlying MSCI ParentIndex (herein, a “Parent Index”). MSCI Total Shareholder Yield Indexes also employ thefollowing screens to define the eligible universe with an aim to achieve a betterrepresentation of Total Shareholder Yield opportunity set.2.2 Securities from the Parent Index that have Dividend Yield greater than zero or BuybackYield greater than 10 bps are included to form the eligible universe. A buyback yieldcutoff of 10 bps is used in order to avoid companies buying shares to offset othersources of issuance, for e.g. Employee Stock Options Program. Real Estate Investment Trusts (REITS) are excluded. REITs have structurally very highdividend yield and, if included, would represent a disproportionate share of the MSCITotal Shareholder Yield Index. Also, typically, regulatory constraints restrict the inclusionof REITs in meaningful proportions in many institutional portfolios. Securities with negative Enterprise Value are excluded.DETERMINATION OF TOTAL SHAREHOLDER YIELD SCOREThe Total Shareholder Yield Score is determined for each security in the eligible universe.The Total Shareholder Yield score for each security is calculated by combining Z scores oftwo fundamental variables, namely the Total Yield (Dividend Yield Buyback Yield) and theDebt Reduction Yield. Please refer to Appendix I for further details on the calculation of theunderlying fundamental variables.2.2.1WINSORIZING BUYBACK YIELD, DIVIDEND YIELD AND DEBT REDUCTION YIELDAs part of the standardization process, securities with extremely high Dividend Yield orBuyback Yield values are excluded from the eligible universe to ensure that the averagevalues used to standardize the variables are less affected by extreme values. To do this, for agiven variable, the values for all the securities are first ranked in ascending order within theeligible universe. Missing values are excluded from the ranking. Then, the securities withvalues that lie in the top 99th percentile rank are excluded provided buyback yield ordividend yield values are greater than 15%. Securities whose buyback yield or dividend yieldvalues is less than 15% but still lie in top 99th percentile are not excluded. Debt ReductionYield values are also winsorized to ensure that the average values used to standardize thevariables are less affected by extreme values. To do this, the debt reduction yield values forall securities are first ranked in ascending order within the eligible universe. Missing values 2015 MSCI Inc. All rights reserved. Please refer to the disclaimer at the end of this document.MSCI.COM PAGE 4 OF 15
MSCI TOTAL SHAREHOLDER YIELD INDEXES METHODOLOGY APRIL 2015are excluded from the ranking. Then, for values that lie in the bottom 1st percentile rank orin the top 99th percentile rank, their value is set equal to the value of the 1st percentileranked or 99th percentile ranked security, as applicable.2.2.2CALCULATING THE Z-SCORESThe z-score for the two variables for each security is calculated using the mean and standarddeviation of the relevant variable within eligible universe as described below. The variablesused are as follows:1. Total Yield Winsorized Dividend Yield Winsorized Buyback Yield2. Winsorized Debt Reduction Yield𝑧 (𝑥 µ)𝜎Where: 𝑥 is the variable for a given security µ is the mean of the variable in the eligible universe, excluding missing values 𝜎 is the standard deviation of the variable in the eligible universe, excluding missingvaluesThe Z scores are winsorized at /-3.2.2.3CALCULATING THE TOTAL SHAREHOLDER YIELD SCORETotal Shareholder Yield Z-Score is then computed by equal weighting the Total Yield Z Scoreand the Debt Reduction Yield Z Score. The Debt Reduction Yield Z Score is only consideredfor companies which have a higher debt compared with the previous fiscal year (a negativeDebt Reduction Yield) and have a negative Debt Reduction Yield Z-score.Composite Total Shareholder Yield Z Score Mean (Total Yield Z Score, max (Debt Reduction Yield Z Score, 0))The Composite Total Shareholder Yield Z Score is then translated into a Total ShareholderYield Score. Total Shareholder Yield Score is computed from the Composite Z Score using theformula mentioned below:𝑇𝑜𝑡𝑎𝑙 𝑆ℎ𝑎𝑟𝑒ℎ𝑜𝑙𝑑𝑒𝑟 𝑌𝑖𝑒𝑙𝑑 𝑆𝑐𝑜𝑟𝑒 {(1 𝑍) 𝑓𝑜𝑟 𝑍 0(1 𝑍) 1 𝑓𝑜𝑟 𝑍 0Where Z is Composite Z Score calculated in the previous step. 2015 MSCI Inc. All rights reserved. Please refer to the disclaimer at the end of this document.MSCI.COM PAGE 5 OF 15
MSCI TOTAL SHAREHOLDER YIELD INDEXES METHODOLOGY APRIL 20152.3SECURITY INCLUSIONThe MSCI Total Shareholder Yield Index is constructed with a fixed number of securitiesapproach. All the existing constituents of the relevant MSCI Parent Index are ranked basedon their Total Shareholder Yield Scores. If multiple securities have the same TotalShareholder Yield Score, then the security having a higher weight in the Parent Index is givena higher rank. A fixed number of securities with the highest positive Total Shareholder YieldScores are predetermined for every MSCI Total Shareholder Yield Index at initialconstruction. Rules for arriving at a fixed number of constituents at initial construction areexplained in Appendix II. The fixed number for security inclusion determined at initialconstruction is evaluated at every Index Review to ensure that the Total Shareholder Yielduniverse has sufficient index market capitalization coverage. Rules for evaluating the fixednumber of constituents at every May Annual Index Review are explained in Appendix II.2.4WEIGHTING SCHEMEFor a given rebalancing effective date, all the securities eligible for inclusion in the MSCITotal Shareholder Yield Indexes are weighted by the product of their market capitalizationweight in the Parent Index and the Total Shareholder Yield Score.Total Shareholder Yield Weight Total Shareholder Yield Score * Market Capitalization Weight in the Parent IndexThe above weights are then normalized to 100%.Additionally, constituent weights are capped at issuer level to mitigate concentration risk:1. Issuers in the MSCI Total Shareholder Yield Indexes based on broad parent MSCI Indexes(e.g. MSCI World Index, MSCI Emerging Markets Index etc.) will be capped at 5%2. Issuers in the MSCI Total Shareholder Yield Indexes based on narrow parent MSCIIndexes will be capped at the maximum weight in the Parent Index.Narrow parent MSCI Indexes are defined as those indexes for which the maximum marketcapitalization weight in the Parent Index is more than 10%. 2015 MSCI Inc. All rights reserved. Please refer to the disclaimer at the end of this document.MSCI.COM PAGE 6 OF 15
MSCI TOTAL SHAREHOLDER YIELD INDEXES METHODOLOGY APRIL 20153MAINTAINING MSCI TOTAL SHAREHOLDER YIELD INDEXES3.1ANNUAL INDEX REVIEWSThe MSCI Total Shareholder Yield Indexes are rebalanced on an annual basis, usually as ofthe close of the last business day of May, coinciding with May Semi Annual Index Review ofthe MSCI Global Investable Market Indexes. Fundamental variables as of the end of the Aprilare used. The pro forma MSCI Total Shareholder Yield Indexes are announced nine businessdays before the effective date.3.1.1BUFFER RULES:To reduce Index turnover and enhance index stability, buffer rules are applied. A securityselection buffer of 50% is applied during the on-going index review.For example, the MSCI World Total Shareholder Yield Index targets 350 securities and thebuffers are applied between rank 176 and 525. The securities in the Parent Index with aTotal Shareholder Yield rank at or above 175 will be added to the MSCI World TotalShareholder Yield Index on a priority basis. The existing constituents that have a TotalShareholder Yield rank between 176 and 525 are then successively added until the numberof securities in the MSCI World Total Shareholder Yield Index reaches 350. If the number ofsecurities is below 350 after this step, the remaining securities in the Parent Index with thehighest Total Shareholder Yield score are added until the number of securities in the MSCIWorld Total Shareholder Yield Index reaches 350.3.2ONGOING EVENT RELATED CHANGESIn general, the MSCI Total Shareholder Yield Indexes follow the event maintenance of theParent Index.3.2.1IPOS AND OTHER EARLY INCLUSIONSIPOs and other newly listed securities will only be considered for inclusion at the next annualIndex review in the MSCI Total Shareholder Yield Index, even if they qualify for earlyinclusion in the Parent Index.3.2.2ADDITIONS AND DELETIONS DUE TO CORPORATE EVENTSThe general treatment of additions and deletions due to corporate events aims atminimizing the turnover in the MSCI Total Shareholder Yield Indexes. A constituent deletedfrom the Parent Index following a corporate event or during the Quarterly Index Review of 2015 MSCI Inc. All rights reserved. Please refer to the disclaimer at the end of this document.MSCI.COM PAGE 7 OF 15
MSCI TOTAL SHAREHOLDER YIELD INDEXES METHODOLOGY APRIL 2015the Parent Index will be simultaneously deleted from the MSCI Total Shareholder YieldIndex.Please refer to Appendix III for more details on the treatment of corporate events. 2015 MSCI Inc. All rights reserved. Please refer to the disclaimer at the end of this document.MSCI.COM PAGE 8 OF 15
MSCI TOTAL SHAREHOLDER YIELD INDEXES METHODOLOGY APRIL 2015APPENDIX I: CALCULATION OF FUNDAMENTAL VARIABLESFundamentalVariableCalculation DetailsDividend Yield is calculated using the trailing 12 month dividend per share figure andthe current security price as per the standard MSCI methodology.Dividend Yield𝐷𝑖𝑣𝑖𝑑𝑒𝑛𝑑 𝑌𝑖𝑒𝑙𝑑 𝑇𝑟𝑎𝑖𝑙𝑖𝑛𝑔 12 𝑀𝑜𝑛𝑡ℎ 𝐷𝑖𝑣𝑖𝑑𝑒𝑛𝑑 𝑃𝑒𝑟 𝑆ℎ𝑎𝑟𝑒𝐶𝑢𝑟𝑟𝑒𝑛𝑡 𝑆𝑒𝑐𝑢𝑟𝑖𝑡𝑦 𝑃𝑟𝑖𝑐𝑒Please refer to MSCI Fundamental Data Methodology books for more detailshttp://www.msci.com/eqb/methodology/meth docs/MSCI Nov13 Fundamental Data.pdfBuyback Yield is calculated at issuer level using trailing 12 month (TTM) number ofcommon shares (NOS) outstanding adjusted for relevant corporate events and thecurrent common number of shares outstanding. Preferred stocks and other sharetypessuch as units, warrants etc. are excluded from the buyback yield calculation.Buyback Yield𝑁𝑒𝑡 𝐵𝑢𝑦𝑏𝑎𝑐𝑘 𝑌𝑖𝑒𝑙𝑑 𝐶ℎ𝑎𝑛𝑔𝑒 𝑖𝑛 𝑇𝑇𝑀 𝑁𝑂𝑆𝐶𝑢𝑟𝑟𝑒𝑛𝑡 𝑁𝑂𝑆Debt Reduction Yield is calculated using reduction in debt over the last one fiscal yearand the latest Enterprise ValueDebt ReductionYield𝐷𝑒𝑏𝑡 𝑅𝑒𝑑𝑢𝑐𝑡𝑖𝑜𝑛 𝑌𝑖𝑒𝑙𝑑 𝐿𝑎𝑠𝑡 𝐹𝑖𝑠𝑐𝑎𝑙 𝑌𝑒𝑎𝑟 𝐷𝑒𝑏𝑡 ��𝑟𝑝𝑟𝑖𝑠𝑒 𝑉𝑎𝑙𝑢𝑒Total debt is utilized for all the sectors except for the financials GICS sector incalculating debt reduction. Long term debt is used for calculating debt reduction forthe securities in the financials GICS sector. 2015 MSCI Inc. All rights reserved. Please refer to the disclaimer at the end of this document.MSCI.COM PAGE 9 OF 15
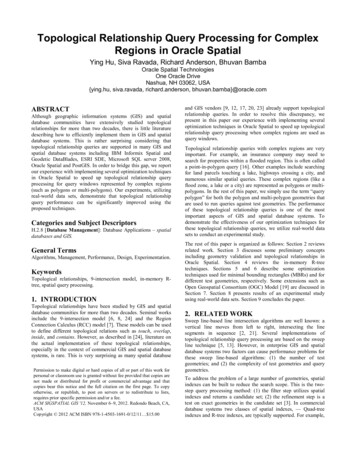
MSCI TOTAL SHAREHOLDER YIELD INDEXES METHODOLOGY APRIL 2015APPENDIX II: RULES TO DETERMINE FIXED NUMBER OF SECURITIESAT INITIAL CONSTRUCTION AND IN ONGOING REBALANCINGAlgorithm to Determine Fixed Number of Securities at Initial ConstructionRank the securities in the proforma parent universe in the descending order of TotalShareholder Yield Score 2015 MSCI Inc. All rights reserved. Please refer to the disclaimer at the end of this document.MSCI.COM PAGE 10 OF 15
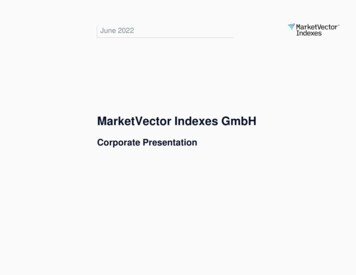
MSCI TOTAL SHAREHOLDER YIELD INDEXES METHODOLOGY APRIL 2015Rounding Off Rules:Upward rounding off is done depending on NumSec Obtained in the Previous Box Step If NumSec in Previous Step 100, Nearest Rounding 10 Securities If NumSec in Previous Step 100 but 300, Nearest Rounding 25 Securities If NumSec in Previous Step 300, Nearest Rounding 50 SecuritiesAlgorithm to reevaluate Fixed Number of Securities at Annual Rebalancing 2015 MSCI Inc. All rights reserved. Please refer to the disclaimer at the end of this document.MSCI.COM PAGE 11 OF 15
MSCI TOTAL SHAREHOLDER YIELD INDEXES METHODOLOGY APRIL 2015APPENDIX III: CORPORATE EVENTS TREATMENTThis appendix describes the treatment of the most common corporate events in the MSCIIndexes. Details regarding the treatment of all other corporate events not covered in thisappendix can be found in the MSCI Corporate Events Methodology book, available rd/methodology.htmlEvent TypeAcquisitionMergerEvent detailsActionTotal Shareholder Yield Indexconstituent acquires another TotalShareholder Yield Index constituentMaintain acquiring company andremove acquired companyTotal Shareholder Yield Indexconstituent acquires non TotalShareholder Yield Index constituentMaintain acquiring companyNon Total Shareholder Yield Indexconstituent acquires Total ShareholderYield Index constituentRemove acquired company withoutadding acquiring companyTotal Shareholder Yield Indexconstituent merges with TotalShareholder Yield Index constituentAdd new company with a constraintfactor that is the weighted average ofthe two constituentsTotal Shareholder Yield Indexconstituent merges with non TotalShareholder Yield Index constituentAdd new company if MSCI links its pricehistory to the Total Shareholder YieldIndex constituent. New company notadded if price history is linked to thenon Total Shareholder Yield IndexconstituentIPO added to Parent IndexSecurity will be considered for inclusionin the Total Shareholder Yield Index atthe next AnnualIPOIndex ReviewTotal Shareholder Yield Indexconstituent spins off securitySpin-offAdd spun-off security to the TotalShareholder Yield Index with theconstraint factor of the spinningsecurity, if it is included in the ParentIndex 2015 MSCI Inc. All rights reserved. Please refer to the disclaimer at the end of this document.MSCI.COM PAGE 12 OF 15
MSCI TOTAL SHAREHOLDER YIELD INDEXES METHODOLOGY APRIL 2015Event TypeEvent detailsActionConversionSecurity A converted to B, A deletedfrom Parent Index, B addedB inherits constraint factors from ACountryReclassificationDomicile of company reviewed: SecurityA deleted from country A, security Badded to country BB inherits constraint factors from A if itis added to the Parent IndexStock exchangereclassificationStock exchange (price source) ofcompany reviewed: Security A deleted,security B addedB inherits constraint factors from A if itis added to the Parent IndexOther EventsResulting inChanges in Numberof Shares and FIFsChanges in number of shares andsubsequent FIF resulting from otherevents such as share placements andofferings, and debt-to-equity-swapsNo change in Constraint Factor 2015 MSCI Inc. All rights reserved. Please refer to the disclaimer at the end of this document.MSCI.COM PAGE 13 OF 15
MSCI TOTAL SHAREHOLDER YIELD INDEXES METHODOLOGY APRIL 2015CONTACT tonChicagoMonterreyNew YorkSan FranciscoSao PauloTorontoABOUT MSCI1 888 588 4567 * 1 404 551 3212 1 617 532 0920 1 312 675 0545 52 81 1253 4020 1 212 804 3901 1 415 836 8800 55 11 3706 1360 1 416 628 1007EUROPE, MIDDLE EAST & AFRICACape TownFrankfurtGenevaLondonMilanParis 27 21 673 0100 49 69 133 859 00 41 22 817 9777 44 20 7618 2222 39 02 5849 04150800 91 59 17 *For more than 40 years, MSCI’s researchbased indexes and analytics have helpedthe world’s leading investors build andmanage better portfolios. Clients rely onour offerings for deeper insights into thedrivers of performance and risk in theirportfolios, broad asset class coverage andinnovative research.Our line of products and services includesindexes, analytical models, data, real estatebenchmarks and ESG research.MSCI serves 98 of the top 100 largestmoney managers, according to the mostrecent P&I ranking.For more information, visit us atwww.msci.com.ASIA PACIFICChina NorthChina SouthHong KongMumbaiSeoulSingaporeSydneyTaipeiTokyo10800 852 1032 *10800 152 1032 * 852 2844 9333 91 22 6784 916000798 8521 3392 *800 852 3749 * 61 2 9033 9333008 0112 7513 * 81 3 5290 1555* toll free 2015 MSCI Inc. All rights reserved. Please refer to the disclaimer at the end of this document.MSCI.COM PAGE 14 OF 15
MSCI TOTAL SHAREHOLDER YIELD INDEXES METHODOLOGY APRIL 2015NOTICE ANDDISCLAIMERThis document and all of the information contained in it, including without limitation all text, data, graphs, charts (collectively, the “Information”) isthe property of MSCI Inc. or its subsidiaries (collectively, “MSCI”), or MSCI’s licensors, direct or indirect suppliers or any third party involved in makingor compiling any Information (collectively, with MSCI, the “Information Providers”) and is provided for informational purposes only. The Informationmay not be modified, reverse-engineered, reproduced or redisseminated in whole or in part without prior written permission from MSCI.The Information may not be used to create derivative works or to verify or correct other data or information. For example (but without limitation),the Information may not be used to create indexes, databases, risk models, analytics, software, or in connection with the issuing, offering,sponsoring, managing or marketing of any securities, portfolios, financial products or other investment vehicles utilizing or based on, linked to,tracking or otherwise derived from the Information or any other MSCI data, information, products or services.The user of the Information assumes the entire risk of any use it may make or permit to be made of the Information. NONE OF THE INFORMATIONPROVIDERS MAKES ANY EXPRESS OR IMPLIED WARRANTIES OR REPRESENTATIONS WITH RESPECT TO THE INFORMATION (OR THE RESULTS TO BEOBTAINED BY THE USE THEREOF), AND TO THE MAXIMUM EXTENT PERMITTED BY APPLICABLE LAW, EACH INFORMATION PROVIDER EXPRESSLYDISCLAIMS ALL IMPLIED WARRANTIES (INCLUDING, WITHOUT LIMITATION, ANY IMPLIED WARRANTIES OF ORIGINALITY, ACCURACY, TIMELINESS,NON-INFRINGEMENT, COMPLETENESS, MERCHANTABILITY AND FITNESS FOR A PARTICULAR PURPOSE) WITH RESPECT TO ANY OF THEINFORMATION.Without limiting any of the foregoing and to the maximum extent permitted by applicable law, in no event shall any Information Provider have anyliability regarding any of the Information for any direct, indirect, special, punitive, consequential (including lost profits) or any other damages even ifnotified of the possibility of such damages. The foregoing shall not exclude or limit any liability that may not by applicable law be excluded or limited,including without limitation (as applicable), any liability for death or personal injury to the extent that such injury results from the negligence orwillful default of itself, its servants, agents or sub-contractors.Information containing any historical information, data or analysis should not be taken as an indication or guarantee of any future performance,analysis, forecast or prediction. Past performance does not guarantee future results.The Information should not be relied on and is not a substitute for the skill, judgment and experience of the user, its management, employees,advisors and/or clients when making investment and other business decisions. All Information is impersonal and not tailored to the needs of anyperson, entity or group of persons.None of the Information constitutes an offer to sell (or a solicitation of an offer to buy), any security, financial product or other investment vehicle orany trading strategy.It is not possible to invest directly in an index. Exposure to an asset class or trading strategy or other category represented by an index is onlyavailable through third party investable instruments (if any) based on that index. MSCI does not issue, sponsor, endorse, market, offer, review orotherwise express any opinion regarding any fund, ETF, derivative or other security, investment, financial product or trading strategy that is based on,linked to or seeks to provide an investment return related to the performance of any MSCI index (collectively, “Index Linked Investments”). MSCImakes no assurance that any Index Linked Investments will accurately track index performance or provide positive investment returns. MSCI Inc. isnot an investment adviser or fiduciary and MSCI makes no representation regarding the advisability of investing in any Index Linked Investments.Index returns do not represent the results of actual trading of investible assets/securities. MSCI maintains and calculates indexes, but does notmanage actual assets. Index returns do not reflect payment of any sales charges or fees an investor may pay to purchase the securities underlying theindex or Index Linked Investments. The imposition of these fees and charges would cause the performance of an Index Linked Investment to bedifferent than the MSCI index performance.The Information may contain back tested data. Back-tested performance is not actual performance, but is hypothetical. There are frequentlymaterial differences between back tested performance results and actual results subsequently achieved by any investment strategy.Constituents of MSCI equity indexes are listed companies, which are included in or excluded from the indexes according to the application of therelevant index methodologies. Accordingly, constituents in MSCI equity indexes may include MSCI Inc., clients of MSCI or suppliers to MSCI. Inclusionof a security within an MSCI index is not a recommendation by MSCI to buy, sell, or hold such security, nor is it considered to be investment advice.Data and information produced by various affiliates of MSCI Inc., including MSCI ESG Research Inc. and Barra LLC, may be used in calculating certainMSCI indexes. More information can be found in the relevant index methodologies on www.msci.com.MSCI receives compensation in connection with licensing its indexes to third parties. MSCI Inc.’s revenue includes fees based on assets in IndexLinked Investments. Information can be found in MSCI Inc.’s company filings on the Investor Relations section of www.msci.com.MSCI ESG Research Inc. is a Registered Investment Adviser under the Investment Advisers Act of 1940 and a subsidiary of MSCI Inc. Except withrespect to any applicable products or services from MSCI ESG Research, neither MSCI nor any of its products or services recommends, endorses,approves or otherwise expresses any opinion regarding any issuer, securities, financial products or instruments or trading strategies and MSCI’sproducts or services are not intended to constitute investment advice or a recommendation to make (or refrain from making) any kind of investmentdecision and may not be relied on as such. Issuers mentioned or included in any MSCI ESG Research materials may include MSCI Inc., clients of MSCIor suppliers to MSCI, and may also purchase research or other products or services from MSCI ESG Research. MSCI ESG Research materials, includingmaterials utilized in any MSCI ESG Indexes or other products, have not been submitted to, nor received approval from, the United States Securitiesand Exchange Commission or any other regulatory body.Any use of or access to products, services or information of MSCI requires a license from MSCI. MSCI, Barra, RiskMetrics, IPD, FEA, InvestorForce, andother MSCI brands and product names are the trademarks, service marks, or registered trademarks of MSCI or its subsidiaries in the United Statesand other jurisdictions. The Global Industry Classification Standard (GICS) was developed by and is the exclusive property of MSCI and Standard &Poor’s. “Global Industry Classification Standard (GICS)” is a service mark of MSCI and Standard & Poor’s. 2015 MSCI Inc. All rights reserved.MSCI.COM PAGE 15 OF 15
Total Shareholder Yield Z-Score is then computed by equal weighting the Total Yield Z Score and the Debt Reduction Yield Z Score. The Debt Reduction Yield Z Score is only considered for companies which have a higher debt compared with the previous fiscal year (a negative Debt Reduction Yield) and have a negative Debt Reduction Yield Z-score.