Transcription
Marketing MaterialMarch 2019 / Research ReportALTERNATIVE INDICES PRIMERThe brand DWS represents DWS Group GmbH & Co. KGaA and any of its subsidiaries, such as DWS Distributors, Inc., which offers investmentproducts, or DWS Investment Management Americas Inc. and RREEF America L.L.C., which offer advisory services. There may be references in thisdocument which do not yet reflect the DWS Brand.Due to various risks, uncertainties and assumptions made in our analysis, actual events or results or the actual performance of the markets covered bythis presentation report may differ materially from those described. The information herein reflects our current views only, is subject to change, and isnot intended to be promissory or relied upon by the reader. There can be no certainty that events will turn out as we have opined herein.For Professional Clients (MiFID Directive 2014/65/EU Annex II) only. For Qualified Investors (Art. 10 Para. 3 of the Swiss Federal CollectiveInvestment Schemes Act (CISA)). For Qualified Clients (Israeli Regulation of Investment Advice, Investment Marketing and Portfolio Management Law5755-1995). Outside the U.S. for Institutional investors only. In the United States and Canada, for institutional client and registered representative useonly. Not for retail distribution. Further distribution of this material is strictly prohibited. In Australia, for professional investors only.
Alternatives Indices Primer March 2019Table of ContentsTable of Contents1/ Executive Summary2/ Introduction3/ Matrix of Alternatives Indices4/ List of Alternative Indices5/ Index Briefings2345675.1Global Real Estate Fund Index (GREFI)5.2MSCI Global Quarterly Property Fund Index105.3NCREIF Property Index (NPI)135.4NCREIF Fund Index – Open-End Equity (NFI-OE)155.5NCREIF Fund Index – Open End Diversified Core Equity (NFI-ODCE)175.6MSCI U.S. Quarterly Property Index195.7MSCI/PREA U.S. AFOE Quarterly Property Fund Index (All Funds)215.8MSCI Continental Europe Property Level Index235.9MSCI Pan-European Quarterly Property Fund Index (PEPFI)255.10INREV Quarterly Index275.11ANREV Index295.12MSCI Asia Annual Property Index315.13MSCI Asia Pacific Annual Property Index335.14FTSE EPRA Nareit Index Series355.15MSCI US REIT Total Return Index375.16Wilshire U.S. REIT Index395.17Bloomberg Barclays Investment Grade REITs Total Return Index415.18Bloomberg Barclays CMBS Investment Grade Total Return Index435.19Giliberto-Levy Commercial Mortgage Performance Index (G-L 1)455.20Giliberto-Levy High Yield CRE Debt Index (G-L 2)475.21MSCI Global Quarterly Private Infrastructure Index495.22Dow Jones Brookfield Global Infrastructure Index515.23Markit iBoxx Infrastructure Investment Grade Bond Indices535.24Markit iBoxx USD Liquid High Yield Infrastructure Bond Index575.25Bloomberg Commodity Index (BCOM)596/ Summary of Indices7/ Performance during Different Economic Conditions8/ Correlation to GDP and CPI9/ Asset Class Correlations10/ Historical Return vs. Risk11/ AppendixImportant InformationResearch & Strategy—Alternatives762646869717275792The opinions and forecasts contained herein sets forth our views as of this date of this report. The underlying assumptions and these viewsare subject to change without notice. Past performance may not be indicative of future results.
Alternatives Indices Primer March 20191 / Executive SummaryAlternatives are becoming an important asset class for many investors who seek diversification from traditional equities andfixed income. Although there are a number of alternative asset classes (among them hedge funds, private equity, commodities,real estate and infrastructure), for purposes of this report, our focus is primarily on three of the alternative asset classes, realestate, infrastructure and commodities. Therefore, for purposes of this report, we define the alternatives investment space asnon-listed and listed real estate equity and debt, non-listed and listed infrastructure equity and debt, and commodities. Manyinvestors find it difficult to benchmark alternatives in contrast to traditional equities and fixed income. This report aims toprovide an overview of available indices that track the performance of the various alternative asset classes. Some of theseindices may be suitable for benchmarking depending on an investor’s objective, while others may be useful as signals to trackperformance.We gathered a list of indices to represent the various alternative asset classes in the regions of U.S., Europe and Asia Pacific.Please refer to the Matrix and List of Alternative Indices sections for a summary by asset class and region. We have alsoprepared two- or three-page tear sheets for each index featured, which explores the methodologies. We also included aperformance attribute analysis to show returns over varying historical performance periods (5-years, 10-years and 20-years),standard deviations, and correlations to equity and fixed income markets as well as inflation and gross domestic product(GDP) growth. In addition, we have also prepared performance analysis sections to explore asset class behavior during different economic conditions, correlations to GDP, consumer price index (CPI) and between asset classes, and historical assetclass risk and return profiles.3The opinions and forecasts contained herein sets forth our views as of this date of this report. The underlying assumptions and these viewsare subject to change without notice. Past performance may not be indicative of future results.
Alternatives Indices Primer March 20192 / IntroductionAlternatives are becoming more important for many investors who seek diversification from traditional equities and fixed income. While equity investors have benefitted from a good rally over the past few years 1, many equity markets have displayedvolatility more recently2. Fixed income markets on the other hand, have experienced lower returns,3 albeit with lower volatility.As quantitative easing turns to quantitative tightening, alternative asset classes may look more interesting.In this report, we define the alternative asset classes as non-listed and listed real estate equity and debt, non-listed and listedinfrastructure equity and debt and commodities. We gathered a list of commonly-used indices in the alternative space andprepared summaries of each index. This report is meant as a guide to indices and benchmarks in alternatives. Towards theback section of the report, we prepared some analysis to summarize performance of the various asset classes during differenteconomic scenarios, correlations, and historical risk and returns.Benchmarks vs. IndicesNot all indices may be viewed as benchmarks. Benchmarks help investors create and achieve objectives and offer a framework.They also help investors and fund managers with performance attribution to understand the drivers of investment performance.A relevant benchmark ideally should be investable with a large sample size that is reflective of the industry. It should also betransparent in construction so users understand the composition, weighting methodology, currency, and other technical attributes, and should be supported by independent measurements.Finding relevant benchmarks for liquid asset classes is not difficult since the underlying investments are in most cases readilytradable. This is especially true for listed equities and somewhat less so for listed bonds. Finding benchmarks for non-liquidasset classes such as non-listed real estate and infrastructure is more difficult because it may be impractical to replicate theholdings of a defined basket and different strategies might result in very different outcomes.Indices may track performance of an asset class but may not be appropriate to use to compare performance if they are notinvestable. Using U.S. non-listed real estate as an example, the property-level index, the NCREIF NPI, is a useful measure ofperformance of various U.S. markets and property sectors. However, it is not investable. In contrast, the NCREIF Open-EndDiversified Core Equity (ODCE) funds index tracks the performance of open-end core funds which are investable, and includesthe effect of cash balances, debt and fees.While there are key differences between indices that can and cannot use as benchmarks, we recognize that benchmarks maybe difficult to determine for some alternative asset classes such as private equity. Most private equity funds are closed endedand returns are reported at cost for the first few years, instead of through an appraisal or mark-to-market process. In this case,it is difficult to fully benchmark performance, and for that reason, many default to using absolute return hurdles.Another alternative is to add a premium to a well-known traditional publicly-available index. For example, a method of benchmarking for some private infrastructure debt funds is to use a listed infrastructure debt index with a specific rating and duration,such as BBB and 7 years, and add an illiquidity premium.Past performance may not be indicative of future results. There can be no assurance that the desired results will be achieved.The opinions and forecasts contained herein sets forth our views as of this date of this report. The underlying assumptions and these views are subject tochange without notice.Credit quality represents the lower rating of either Moody's Investors Services, Inc. or Standard &Poor's Corporation and is their opinions as to the quality of thesecurities they rate. Credit quality does not remove market risk and is subject to change.123The S&P 500 returned between -4.4% to 32.4% from FY 2009 to FY 2018.The VIX Index was 25.4 as of 12/31/2018 vs. 11.04 a year earlier.The Bloomberg Barclays Global Aggregate Index has returned 3.0% on an annualized basis since 2009.4The opinions and forecasts contained herein sets forth our views as of this date of this report. The underlying assumptions and these viewsare subject to change without notice. Past performance may not be indicative of future results.
Alternatives Indices Primer March 20193 / Matrix of Alternatives IndicesEXHIBIT 1: ALTERNATIVE INDICES BY ASSET CLASS AND REGIONNon-Listed RealEstateGlobal1. Global Real Estate Fund Index (GREFI)2. MSCI Global Quarterly Property Fund IndexNon-Listed RealEstate DebtListed Real EstateEquity1. FTSE EPRA/NAREIT Developed Index2. FTSE EPRA/NAREIT Developed ex USListed Real EstateDebtNon-Listed InfrastructureListed Infrastructure EquityListed Infrastructure DebtCommoditiesU.S.1. NCREIF NPI2. NCREIF ODCE3. NCREIF OE4. MSCI U.S. Qtrly Property Index5. MSCI/PREA U.S. ACOEQtrly Property Fund Index1. Giliberto-Levy CommercialMortgage Performance Index(G-L 1)2. Giliberto-Levy High YieldCRE Debt Index (G-L 2)1. MSCI US REIT Total ReturnIndex2. Wilshire US REIT IndexEurope1. MSCI Continental EuropeProperty Level Index2. MSCI Pan-European Property Fund Index (PEPFI)3. INREVAsia Pacific1. ANREV All Funds Index2. MSCI Asia Annual PropertyIndex1. FTSE EPRA/NAREIT Developed Europe (NEPRA Index)2. FTSE EPRA NAREIT Europe Ex UK (NUXUK INDEX)3. FTSE EPRA NAREIT UK(NUPUK INDEX)1. FTSE EPRA/NAREIT AsiaIndex (TRGASU INDEX)2. FTSE EPRA/NAREIT Asiaex Australia Index (TRPAAUINDEX)1. Bbg Barclays IG Reits TR Index2. Bbg Barclays CMBS IG TR1. MSCI Global Quarterly Private Infrastructure Index1. DJ Brookfield Global Infrastructure1. Markit iBoxx USD Infrastructure Bond Index2. Markit iBoxx USD LiquidHigh Yield Infrastructure BondIndex3. Markit iBoxx EUR Infrastructure Bond Index4. Markit iBoxx GBP Infrastructure Bond Index1. Bloomberg Commodity IndexSource: DWS5The opinions and forecasts contained herein sets forth our views as of this date of this report. The underlying assumptions and these views are subject to change without notice. Pastperformance may not be indicative of future results.
Alternatives Indices Primer March 20194 / List of Alternative IndicesNon-Listed Real EstateGlobal1. Global Real Estate Fund Index (GREFI) fund level 5.1 (sub-section number)2. MSCI Global Quarterly Property Fund Index fund level and asset level 5.2U.S.3. NCREIF Property Index (NPI) asset level 5.34. NCREIF Fund Index- Open-End Equity (NFI-OE) fund level 5.45. NCREIF Fund Index – Open-End Diversified Core Equity Fund Index (NFI-ODCE) fund level 5.46. MSCI U.S. Quarterly Property Index asset level 5.67. MSCI/PREA U.S. ACOE Quarterly Property Fund Index fund level 5.7Europe8. MSCI Continental Europe Property Level Index asset level 5.89. MSCI Pan-European Quarterly Property Fund Index (PEPFI) fund level 5.910. INREV Quarterly Index fund level 5.10Asia Pacific11. ANREV Index fund level 5.1112. MSCI Asia Annual Property Index asset level 5.12Non-Listed Real Estate Debt13. Giliberto-Levy Commercial Mortgage Performance Index (G-L 1) asset level 5.1914. Giliberto-Levy High Yield CRE Debt Index (G-L 2) asset level 5.20Listed Real EstateGlobal15. FTSE EPRA/NAREIT Developed Index 5.1416. FTSE EPRA/NAREIT Developed ex US 5.14U.S.17. MSCI US REIT Total Return Index 5.1518. Wilshire U.S. REIT Index 5.16Europe19. FTSE EPRA/NAREIT Developed Europe 5.1420. FTSE EPRA NAREIT Europe Ex UK 5.1421. FTSE EPRA NAREIT UK 5.14Asia Pacific22. FTSE EPRA/NAREIT Asia Index 5.1423. FTSE EPRA/NAREIT Asia ex Australia Index 5.14Listed Real Estate Debt24. Bloomberg Barclays Investment Grade REITs Total Return Index asset level 5.1725. Bloomberg Barclays CMBS Investment Grade Total Return Index asset level 5.18Non-Listed Infrastructure26. MSCI Global Quarterly Private Infrastructure Index asset level 5.21Listed Infrastructure27. Dow Jones Brookfield Global Infrastructure Index asset level 5.22Listed Infrastructure Debt28.29.30.31.Markit iBoxx EUR Infrastructure Bond Index asset level 5.23Markit iBoxx GBP Infrastructure Bond Index asset level 5.23Markit iBoxx USD Infrastructure Bond Index asset level 5.23Markit iBoxx USD Liquid High Yield Infrastructure Bond Index asset level 5.24Commodities32. Bloomberg Commodity Index (BCOM) asset level 5.256The opinions and forecasts contained herein sets forth our views as of this date of this report. The underlying assumptions and these viewsare subject to change without notice. Past performance may not be indicative of future results.
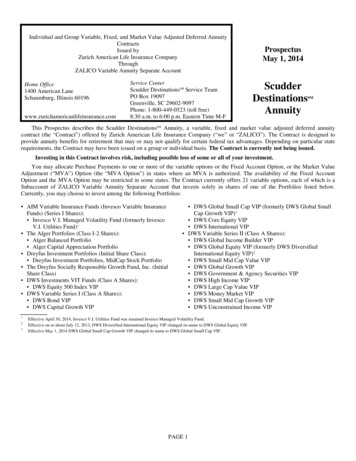
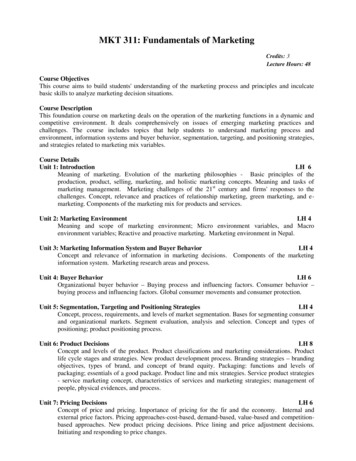
Alternatives Indices Primer March 20195 / Index BriefingsThe following pages contain brief descriptions and characteristics of the indices that we listed in the previous section. We alsoincluded performance attributes of each index, including historical total returns, volatility, Sharpe ratios, and correlations. Wedesigned the following pages as two- or three-page tear sheets for ease of the reader.5.1 Global Real Estate Fund Index (GREFI)EXHIBIT 2: GLOBAL REAL ESTATE FUND INDEX TOTAL RETURN AND OTHER STATISTICSTotal Return5Y8Y8Y9.4% 8.4% 8.4%Equities-23.1%Fixed Inc.-10.4%Long-term* CorrelationGDPCPI10Y Gov. Bond urce: Bloomberg, NCREIF, Oxford Economics, and DWS. As of September 30, 2018, latest data available.Note: Equities refer to the MSCI All Country World Index; Fixed Income refer to the Bloomberg Barclays Global Aggregate Index; GDP andCPI refers to a weighted average GDP growth and CPI of the U.S., Eurozone and Asia Pacific from Oxford Economics; and the 10-yeargovernment bond yield refers to the U.S. 10-Year Treasury.*The GREFI Index started in 2010 and therefore correlations, standard deviation and the Sharpe Ratio and some return data are calculatedusing quarterly data over the past 8 years.Description: The Global Real Estate Fund Index (GREFI) All Funds Index measures the net asset value performance of non-listed real estate funds on a quarterly basis and is jointly produced by National Council of RealEstate Investment Fiduciaries (NCREIF), European Association for Investors in Non-Listed Real Estate Vehicles (INREV) and the Asian Association for Investors in Non-Listed Real Estate Vehicles (ANREV).4 Performance is measured net of fees and other costs. 4 The GREFI is now published 12 weeks after quarter end. 4The returns are based on fund level data that is provided to ANREV, INREV and NCREIF directly from managers. 4 The GREFI is an unfrozen index, which means historical data can be revised. 4 NCREIF contributes theNFI-ODCE data for the GREFI index which is frozen as of this writing, whereas data from INREV and ANREVare unfrozen. As of September 30, 2018, GREFI comprised of 467 funds with a gross asset value of 734.8 billion and leverage of 21.7%.4Start date and release: The index was launched in 2014 with data history starting in 3/31/2010. The index isreleased 12 weeks after quarter-end. 4Access: The latest snapshot report is publicly available from the INREV website: -grefi-quarterly. The latest press release is also available from the NCREIF website:http://www.ncreif.org/news. The full report and time series is available to members through the NCREIF, INREVand ANREV websites.Return types: Total returnWeighting: Net asset value of the fundsUsage: Research on returns and allocations by region.Inclusion criteria: All funds included in the ANREV Quarterly Index (core, value added and opportunity) and allfunds included in the INREV Quarterly Index (core and value added). US core funds and non-core funds areincluded, where the US core funds consists of the NCREIF Fund Index Open End Diversified Core Equity (NFIODCE) and the US non-core funds consist of the NCREIF Fund Index Open End (NFI-OE). The NCREIF FundIndex Closed End Value Added (NFI – CEVA) data is no longer included as NCREIF has stopped releasingdata. 4Available indices: GREFI All Funds Index; regional indices include Asia Pacific, Europe and U.S.; GREFI Coreand Non-Core indices; Regional core and non-core indices for Asia Pacific, Europe and U.S.; Open End FundIndex; Regional open end fund indices for Asia Pacific, Europe and U.S. 44Global Real Estate Fund Index (Q3 2018 Report, latest available)7The opinions and forecasts contained herein sets forth our views as of this date of this report. The underlying assumptions and these viewsare subject to change without notice. Past performance may not be indicative of future results.
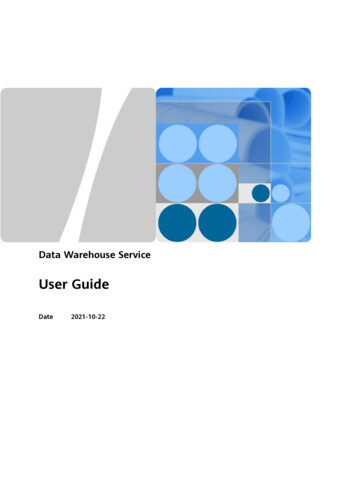
Alternatives Indices Primer March 2019EXHIBIT 3: GLOBAL REAL ESTATE FUND INDEX TOTAL RETURNS BY REGION AND FUND TYPEGREFI Core Returns by Region25.0%20.0%20.0%GREFI All Funds, Core and 1 2012 2013 2014 2015 2016 2017 20180.0%2011 2012 2013 2014 2015 2016 2017 2018GREFI All FundsGREFI CoreAsia Pacific CoreEurope CoreUS Core (ODCE)GREFI Non-CoreSource: NCREIF. As of September 30, 2018, latest available.Methodology: The GREFI is based on the contributions of fund-level data from NCREIF, ANREV and INREV.ANREV and INREV investment styles (core, non-core, and opportunity) are self-defined by the manager. 4While NCREIF ODCE index has strict inclusion criteria, INREV and ANREV inclusion appears similar based onleverage levels.The Modified Dietz methodology is used to calculate quarterly net asset value fund performance. The total return measures the performance over a specific period and does not include projections to the end of the fund’slife. 4EXHIBIT 4: GLOBAL REAL ESTATE FUND INDEX RETURNS BY REGION, FUND TYPE AND SECTORComposition by Geographic Category (%GAV)Global,4%AsiaPacific,17%Country Allocation (% GAV)Other,21%U.S., 47%Netherlands,5%U.S., 43%Europe,36%Germany,6%U.K.,8%Australia,13%8The opinions and forecasts contained herein sets forth our views as of this date of this report. The underlying assumptions and these viewsare subject to change without notice. Past performance may not be indicative of future results.
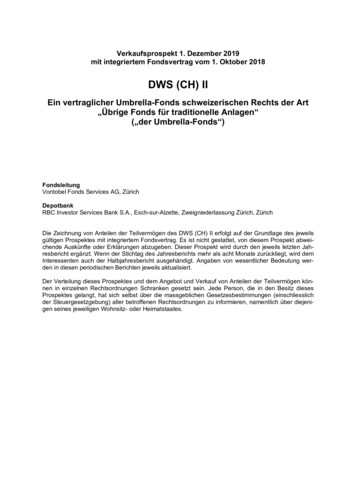
Alternatives Indices Primer March 2019Sector Allocation (% GAV)Composition by Number of FundsGlobal,4%U.S.,17%AsiaPacific,18%Other, 13%Office, idential,18%Retail,23%Source: NCREIF. As of September 30, 2018, latest data available.Issues and Limitations: The GREFI is NAV-weighted, therefore larger funds would have a bigger weight than smaller funds.The investment styles for funds reporting to ANREV and INREV are self-defined, which can lead to different definitions for core and non-core funds (value-add and opportunistic).The U.S. make up 47% of the country allocation by GAV, followed by Australia at 13%. This may not befully representative of a global investor’s allocation.Data history starts in 2010 which is limited since it does not capture a full economic cycle and only represents a recovery period. This results in a Sharpe ratio which in our view is likely too high and a standard deviation which is likely too low.9The opinions and forecasts contained herein sets forth our views as of this date of this report. The underlying assumptions and these viewsare subject to change without notice. Past performance may not be indicative of future results.
Alternatives Indices Primer March 20195.2 MSCI Global Quarterly Property Fund IndexEXHIBIT 5: MSCI GLOBAL QUARTERLY PROPERTY FUND INDEX TOTAL RETURN AND OTHER STATISTICSTotal Return5Y10Y10Y10.0% 6.5% 6.1%Equities30.1%Long-term* CorrelationFixed Inc.GDPCPI10Y Gov. Bnd Yld-32.4%86.9% 54.1%-53.8%Std.Dev.*9.3%SharpeRatio*0.66Source: Bloomberg, MSCI, Oxford Economics, and DWS. As of December 31, 2018, latest data available.Note: Equities refer to the MSCI All Country World Index; Fixed Income refer to the Bloomberg Barclays Global Aggregate Index; GDP andCPI refers to a weighted average GDP growth and CPI of the U.S., Eurozone and Asia Pacific from Oxford Economics; and the 10-yeargovernment bond yield refers to the U.S. 10-Year Treasury.*The MSCI Global Property Fund Index started in 4Q 2008 and therefore correlations, standard deviation and the Sharpe Ratio arecalculated using quarterly data over the past 10 years.Description: The MSCI Global Quarterly Property Fund Index is a quarterly, appraisal-based index thatmeasures the performance of unlisted funds.5 All funds included in the index are core (diversified and specialized), open-ended (or semi-open), and valued quarterly using international valuation standards, hold at leastUSD 100 million in GAV, at least 85% of which in real estate, maintain maximum leverage of 60%, and havetheir performance validated by MSCI5. The MSCI Global Quarterly Property Fund Index is unfrozen, and theuser can obtain fund-level and asset-level performance numbers. The fund-level index includes the effect of leverage, fund management fees and cash balances. The asset-level index performance is unlevered and deductproperty but not fund management fees. All returns are in local currency. As of December 31, 2018, the indexincluded 101 funds consisting of 8,323 properties with a Gross Asset Value of US 484.2 billion and Net AssetValue of US 384.1 billion6.Start date and release: The index has data history starting in 12/31/20086 and is released approximately 75days after year-end for Q4 results and 65 days after quarter-end for other quarters.7Access: Full history and sub-indices are available via subscription or license agreement. Headline numbers formost recent period publicly available at www.msci.com/real-estate-fact-sheet-search.Return types: Total return, Income return, and Capital returnWeighting: Fund Net Asset Value for the fund-level index, and Gross Asset Value for the asset-level indexUsage: internal research and strategy, utility in external research materials, as an unofficial benchmark (not directly cited in Fund Documents / Partnership Agreements, but used as a reference point internally and/or externally), as an official benchmark, and for performance attribution / risk management analytics. Some investorsand managers use the index in its standard form, while others require a customized version (re-weighted, localcurrency versus fixed currency, etc.). A license agreement with MSCI is needed to use as an official benchmark.Inclusion criteria: All funds are core (diversified and specialized), open-ended or semi-open, and valued quarterly; hold at least USD 100 million in GAV, at least 85% of which in real estate, and maintain maximum leverage of 60%.Available indices: Fund-level index is typically referenced (includes effects of leverage, fund managementfees and cash balances). Asset-level index is also available, which is unleveraged and gross of fund management fees. Further breakdown of returns is available at the asset-level, including by property type (office, retail,industrial, residential, other), and region (Asia Pacific, UK, Continental Europe and North America).567MSCI Global Quarterly Property Fund Index webinar presentation, Results to December 2018. March 27, 2019.MSCI Global Property Fund Index Digest (December 2018 Report, latest available).MSCI Indexes release schedule 201910The opinions and forecasts contained herein sets forth our views as of this date of this report. The underlying assumptions and these viewsare subject to change without notice. Past performance may not be indicative of future results.
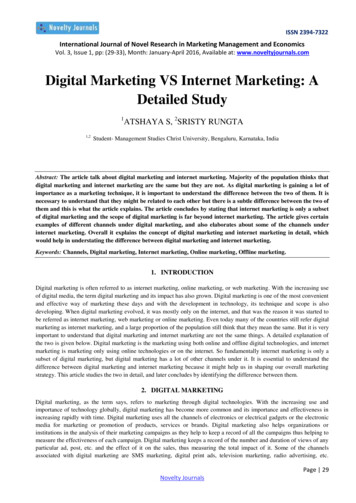
Alternatives Indices Primer March 2019EXHIBIT 6: MSCI GLOBAL QUARTERLY PROPERTY FUND INDEX TOTAL RETURN BY REGION AND PROPERTY TYPEMSCI Global Quarterly Property Fund Index byProperty TypeMSCI Global Quarterly Property Fund Index by 830.0%-20.0%Asia PacificEuropeGlobal-30.0%-40.0%UKNorth lSource: MSCI. As of December 31, 2018, latest data availableMethodology: The MSCI Global Quarterly Property Fund Index is based on the contributions of fund-level dataof participating funds.8 MSCI’s methodology is consistent across its real estate indices. Total returns are calculated on a monthly basis and time-weights (chain-links) them over longer periods. 9 Asset-level returns are computed at the building level and exclude properties held indirectly through investment funds, the impact of debt,fund management fees, taxation and cash.9 At the fund level, the effect of leverage, fund management fees andcash drag is included.9 Total returns are appraisal-based and is net of capital expenditures.9 MSCI runs an internal data quality assessment process during each data update period to identify errors that may have beenmissed by data contributors, as well as unusual or expected changes in values over the period.9 Exceptions include omitted data, illogical data, and data outside specified numerical changes. 9 Acceptable ranges are basedon local market conditions and previous results. MSCI may also collect publicly available data to increase coverage in certain markets, such as in Pan-Asian markets (China, Hong Kong, Indonesia, Malaysia, Singapore,Taiwan, and Thailand).9 As of Q4 2018, the index included 101 funds with GAV of 484.2 billion, with leveragelevels of 20.7% and cash holdings of 2.4%.6EXHIBIT 7: MSCI GLOBAL QUARTERLY PROPERTY FUND INDEX COMPOSITION BY REGION AND PROPERTY TYPEComposition by Region (% GAV)AsiaPacific17%Composition by Property Type (% a65%Cont.Europe7%Industrial21%Office35%Source: MSCI. As of December 31, 2018, latest data available.89For regulatory purposes, each organization lists the names of funds included in the index over the life of the index. However, because open-ended funds arealways in the market, the organization may be limited to show individual fund performance as that could be seen as advertising and pre-conditioning a saleMSCI Global Methodology Standards for Real Estate Investment. December 2018.11The opinions and forecasts contained herein sets forth our views as of this date of this report. The underlying assumptions and these viewsare subject to change without notice. Past performance may not be indicative of future results.
Alternatives Indices Primer March 2019Issues and Limitations: The MSCI Global Quarterly Property Fund Index is heavily weighted towards North America at 64%,making returns more skewed towards the U.S. and Canada The index is weighted by the NAV of the fund (for the fund-level index) or property gross asset value(asset-level index) The index starts in 4Q 2008, which means it only has history for the current business cycle.12The opinions and forecasts contained herein sets forth our views as of this date of this report. The underlying assumptions and these viewsare subject to change without notice. Past performance may not be indicative of future results.
Alternatives Indices Primer March 20195.3 NCREIF Property Index (NPI)EXHIBIT 8: NCREIF PROPERTY INDEX TOTAL RETURN AND OTHER STATISTICSTotal Return5Y10Y20Y9.7% 6.6% 9.1%Equities27.6%Long-term* CorrelationFixed Inc.GDPCPI10Y Gov. Bond Yld-18.1%66.5% 52.7%14.8%Std.Dev.*8.2%SharpeRatio*0.95Source: Bloomberg, NCREIF, Oxford Economics, and DWS. As of December 31, 2018, latest data available.Note: Equities refer to S&P 500 Index; Fixed Income refer to the Bloomberg Barclays U.S. Aggregate Index; GDP refers to U.S. GDPgrowth; CPI refers to the U.S. Headline CPI; and the 10-year government bond yield refers to the U.S. 10-Year Treasury.*The NCREIF Index started in 1978 and therefore correlations, standard deviation and the Sharpe Ratio are calculated using quarterly dataover the past 20 years.Description: The NCREIF Property Index (NPI) is a quarterly, unleveraged composite total return for privatecommercial real estate properties in the U.S. held for investment purposes only.10 All properties in the NPI havebeen acquired, at least in part, on behalf of tax-exempt institutional investors and held in a fiduciary environment.10 The NCREIF NPI is published by the National Council of Real Estate Investment Fiduciaries. Data issourced from NCREIF members who provide data on their assets. 10 As of 12/31/2018, the NPI consisted of7,883 properties valued at
5.12 MSCI Asia Annual Property Index 31 5.13 MSCI Asia Pacific Annual Property Index 33 5.14 FTSE EPRA Nareit Index Series 35 5.15 MSCI US REIT Total Return Index 37 5.16 Wilshire U.S. REIT Index 39 5.17 Bloomberg Barclays Investment Grade REITs Total Return Index 41 5.18 Bloomberg Barclays CMBS Investment Grade Total Return Index 43 5.19 .