Transcription
MARKET SUMMARIESM AY 2022ERS"Vo,EMPLOYEESSYSTEMRETI REMENTT EXAS
Table of ContentsDomestic Equity Market Summary . 2International Equity Market Summary. 3Public Real Estate Market Summary. 5Private Real Estate Market Summary. 5Private Equity Market Summary. 6Hedge Fund Market Summary . 7Private Infrastructure Market Summary . 8Fixed Income Market Summary. 81 Monthly Market Summary – May 2022
DOMESTIC EQUITY MARKET SUMMARYThe S&P 600 index was the best-performing index for the month as investors found attractive valuations afterrecent weakness, while the S&P 500 Growth index posted the largest decline for the month.US Nonfarm Payrolls were very strong for the month posting an increase of 390,000 jobs, surpassingestimates of 318,000. Consumer credit usage topped 38.1 billion, exceeding expectations of 35 billion asconsumer spending rebounds. Lastly, CPI data for the month came in at an annualized rate of 8.6%,exceeding estimates of 8.3%. A large portion of market participants expected weakening inflation data but foodand energy inflation were particularly. As a result, uncertainty around the level and timing of peak inflationcontinues to pressure equity markets as well as the threat of additional Fed rates hikes necessary to combat.In terms of S&P 500 sector performance, Energy was the best-performing performing sector for the month,while also continuing to lead year-to-date. Real Estate was the worst-performing sector for the month, whileConsumer Discretionary was the worst-performing on a year-to-date basis.About 43% of the S&P 500 reported first quarter earnings. Roughly 2.7% of companies reported a positivesales surprise, with 3.5% surprising on earnings. Utilities, followed by Materials and Financials, reported thehighest positive sales surprises for the month while Communications was the only sector to post a negativesurprise on sales. Materials and Health Care posted the highest positive earnings surprise, while the Financialsand Consumer Staples sectors posted the most negative surprise on earnings.In terms of S&P 500 stocks, Specialty Chemicals, Oil and Gas, and IT Services, stocks posted the strongestreturns. Albemarle Corp., Devon Energy Corp., NRG Energy Inc., EPAM Systems Inc., and Marathon Oil Corp.were the five best performers, up between 26% and 35%.Table 1: U.S. Equity Index Total ReturnsIndexCloseMay 2022 (%)Calendar Year to Date (%)S&P 500 Large Cap4,132.20.2-12.8S&P 500 Growth2,655.7-1.4-21.1S&P 500 Value1,481.61.6-3.5S&P 400 Mid Cap2,514.80.7-11.0S&P 600 Small Cap1,235.61.9-11.42 Monthly Market Summary – May 2022
Table 2: S&P 500 U.S. Economic Sector Index Total ReturnsSectorMay 2022 (%)Calendar Year to Date (%)Communication Services1.8-24.3Consumer Discretionary-4.9-24.7Consumer th Care1.4-5.8Industrials-0.5-10.1Information Technology-0.9-19.4Materials1.1-4.7Real Estate-5.0-14.1Utilities4.34.7INTERNATIONAL EQUITY MARKET SUMMARYInternational stock markets, as measured by the MSCI ACWI ex U.S. Index, rose slightly in the month of May(0.7%), after falling in April (-6.3%) and remaining flat in March (0.2%). Performance was varied, as investorsassessed the prospect of slower growth and inflation. Returns were mixed across sectors, as Energy (8.7%)and Info Tech (1.6%) led the index, while Staples (-1.9%) and Health Care (-1.6%) were the greatestdetractors.MSCI EAFE performance matched the broader international index in May (0.7%) after lagging the group inApril (-6.5%) and leading in March (0.6%). Energy was the best performing sector on the back of strongearnings, while defensively oriented Staples and Health Care were the worst performers. From a regionalstandpoint, Hong Kong and Japan were top performers, while Israel was one of the worst performers.MSCI Emerging Markets (EM) performance lagged the broader international index in May (0.4%) after leadingthe group in April (-5.6%) and lagging in March (-2.3%). Emerging Market returns moved into slightly positiveterritory for the first time in three months. Info Tech and Energy were the best performing sectors, while HealthCare was the worst performer. Latin American countries like Chile, Colombia and Brazil were the bestperformers, while Saudi Arabia and Turkey were the worst performers.Table 3: Global Equity Index Total ReturnsIndexMonthly (USD) (%)Year to Date (%)MSCI ACWI ex US0.7%-10.7%MSCI EAFE0.7%-11.3%MSCI Emerging Markets0.4%-11.8%3 Monthly Market Summary – May 2022
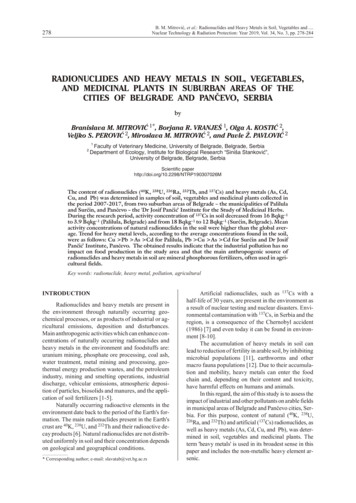
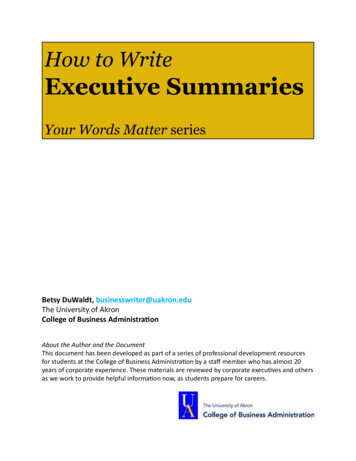
All World ex US Sector Performance8.7%1.6%I1.1%1.0%I --0.7%0.3% 0.2%0.1%!!!!!!!!!!I-1.6%I-1.9%The chart above shows sector returns for the MSCI ACWI ex US index in May, with Energy (8.7%) and InfoTech (1.6%) the top performing sectors, and Staples (-1.9%) and Health Care (-1.6%) the lowest.BloombergN OUEACWZ Index (MSCI ACWI ex USA Net Total Return USO Index)N OOUEAFE Index (MSCI EAFE Net Total Return USO Index)NOUEEGF Index (MSCI Emerging Net Total Return USO Index) -------------------------- .-------------------- ----------------------- ----------------- .' ----------------- ----------------------------·---'''''''102,00. . ., . , . . . . , . · · -·· · ·r·······-····· · · · �··-·····-·····-····· r···-·····-····· �·r ·····-·····-····· ''''I'''' --------- ------ ---- - -7y - .--- ------- ---------------- ----------------- ----- ----------- ----------------- !-----------------------!--------- --------------f- ----------------- ---------!----' --------- ------ ----------- ----''----------- ------ --- ------------ ----- ----------------- ------------------ ----------------- ·---------------- -------·--------- --------------c-- ----------------- ---------·----'' -------------- ----------- . ' ----------- ------ --- ---------------------- ''''''''''''''''''''iiii' ---------------- ----------------- ,' ,' �·-·····-··-r·-·\,·- -iNormaliz As Of 03/31/ 022!i MSCI EAfE Net Total Return USD Index (USD) MSCJ Eri,erging Net Tot l Return USD In ex (USD)i''''';--l---------------- -------I II , '''-''"92,00---- ---------·----90.00:.l ast Price.1···-····· · · -MSH·AEWI ·ex-USA·-NeH'-otat-Retum-l:JSf ·Index·fUSD)-·9i4.-393· -·····-·····-····· �·-·····- -········-····-i--------- l t t : ------------:98,00 .232I .853i· ··-·1···-····· ·····-·····-· ·····-·····-····· ·············-······ · ··········-···r·-·· 86,00Apr 8Apr 15Apr 22Apr 29May 9May 16M.iy 23M.iy 312022The chart above shows the performance of the MSCI ACWI ex US (-5.6%), MSCI EAFE (-5.8%) and MSCIEmerging Markets (-5.1%) indices for the months of April and May.4 Monthly Market Summary – May 2022
PUBLIC REAL ESTATE MARKET SUMMARYThe global real estate securities market as measured by the FTSE EPRA / NAREIT Developed Index wasdown 4.32% for May 2022. ERS’ composite Internal Public Real Estate portfolio was down 4.01%,outperforming its benchmark by 31 basis points.The Domestic REIT portfolio was down 5.46%, outperforming its benchmark the FTSE EPRA/NAREIT UnitedStates Index (-6.26%) by 80 basis points. Strong stock selection as well as overweight in Healthcare sectorand cash position added most relative value. The International REIT portfolio was down 1.74%,underperforming the FTSE EPRA/NAREIT Developed ex USA Index (-1.20%) by 54 basis points. Theunderweight in Hong Kong and overweight in Singapore and Israel were the major detractors.Table 4: Changes in REIT Portfolio Asset ValuePortfolioMonth Ending May (%)IndexPortfolioFiscal Year to Date (%)DifferenceIndexPortfolioDifferenceGlobal REIT onal tic REIT TE REAL ESTATE MARKET SUMMARYTable 5 below states the changes in NAV for the month and fiscal year to date. For the month, the private realestate portfolio increased in value by about 5% despite receiving net distributions of 10 million. The fiscal yearto date increases are a combination of the net capital called (about 11% of total increase) and appreciation(about 89% of total increase) of the Portfolio investments.Table 5: Changes in Private Real Estate Portfolio Net Asset ValueNet AssetValue(in billions)May 31, 2022April 30, 2022MonthlyChange (%)Fiscal YearChange (%) 3.647 3.4764.9%25.1%May 2022Fiscal Year to DateInception( 32) million( 611) million( 5.2) billion 42 million 529 million 4.0 billionTable 6: Capital Calls and DistributionsCallsDistributions5 Monthly Market Summary – May 2022
Net(Called)/DistributionsMay 2022Fiscal Year to DateInception 10 million( 82) million( 1.2) billionThe commitment target for Fiscal Year 2022 is 350 million, with an upper range of 700 million.In the month, ERS closed one deal (Wheelock LTVF – Tranche II) worth 100 million and has another potentialinvestment in the pipeline worth 100 million.To date, ERS has closed on six investments for a total of 300 million of commitments, 86% of the FY targetallocation. The ERS Private Real Estate Portfolio represents 10.6% of the overall System’s assets, 160bpsabove the 9% target.PRIVATE EQUITY MARKET SUMMARYERS Private Equity closed four new investments during May (Deals 9, 10, 11, and 12 in the below table).Private Equity’s target commitments for Fiscal Year 2022 are 800 million with a range of 600 million to 1.0billion. Private Equity’s target commitments for Fiscal Year 2023 are 600 million with a range of 450 millionto 750 million. As of May 31, 2022 the Private Equity Portfolio net asset value was 6.68 billion, or 19.4% ofthe System’s assets.From program inception through May, ERS has closed on 137 funds and 74 co-investments with commitmentstotaling 11.6 billion (adjusted for currency exchange rates). In addition, ERS holds LP Advisory Committeeseats on 88 active funds and five fund LP Advisory Observer seats.Table 7: ERS Private Equity – Deals Closed During Fiscal Year 2022Deal#Fund NameFiscalYearGeography /StrategyCommitment(LocalCurrency)Commitment(USD) (1)1TPG Growth V, LP2022Global - Growth 50,000,000 50,000,0002Co-Investment # 712022Europe - Buyout 14,000,000 14,863,8003Baring Asia VIII, LP2022Asia - Buyout 50,000,000 50,000,0004Industry Ventures Direct III, LP2022US - Venture 30,000,000 30,000,0005Co-Investment # 722022US - Buyout 10,400,000 10,400,0006Hg Saturn 32022Europe - Buyout 44,000,000 44,000,0007Cotton Creek IV LP2022US - Buyout 60,000,000 60,000,0008Advent International X, LP.2022Global - Buyout 85,000,000 85,000,0009LGT Crown Secondaries Special 2022Opportunities III PLCGlobal Secondaries 100,000,000 100,000,00010Brighton Park Capital Fund II,L.P.2022US - Growth 50,000,000 50,000,0006 Monthly Market Summary – May 2022
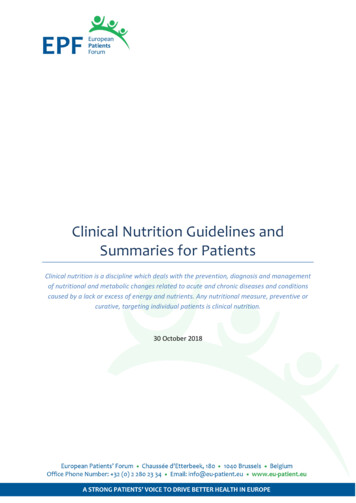
Deal#Fund NameFiscalYearGeography /StrategyCommitment(LocalCurrency)Commitment(USD) (1)11Avista Healthcare Partners VI,L.P.2022US - Buyout 40,000,000 40,000,00012Hg Genesis 10, L.P. (2)2023Europe - Buyout 45,000,000 48,321,000Total 582,584,800Footnotes:(1) Foreign exchange rates as of 04/30/2022EURO / USD: 1.0617(1) Foreign exchange rates as of 05/31/2022EURO / USD: 1.0738HEDGE FUND MARKET SUMMARYThe Absolute Return Portfolio generated an estimated return of -0.30% for the month of May. Please note thatthis return is still preliminary as several managers have less liquid holdings. The benchmark return of 90-day Tbills 350 bps was up 0.30% over the same period. For the fiscal year, the Absolute Return Portfolio hasgenerated an estimated return of 2.36%, while 90-day T-bills 350 bps has returned an estimated 2.69%.The portfolio’s secondary benchmark, the HFRI Fund of Fund Diversified Index, returned -1.05% for May and 2.53% for the fiscal year.The month of May exhibited some relief from an otherwise challenging 2022. The month opened with acontinuation of April’s negative market sentiment due to global growth concerns. The U.S. Federal Reserve(“Fed”) hiked rates by 50 bps at the beginning of the month and announced it will be reducing its balance sheetbeginning June 1st. Towards the end of the month, investor sentiment turned more positive as inflation numbersseemed to exhibit some stabilization. During the month, the April U.S. CPI Index figures were released displayinga year-over-year growth rate of 8.3%, which was down from 8.5% in March. Equity markets traded up on theshift in investor sentiment. Additionally, the European Central Bank’s (“ECB”) President, Christine Lagarde,announced expectations that the current -0.5% deposit rate in the Eurozone will return to neutral or even positiveby the end of 3Q 2022. Furthermore, the ECB’s asset purchasing program is expected to end in early 3Q 2022.In China, COVID-related lockdowns continued for the majority of the month. Towards the end of May,announcements of a lifting in restrictions proved to be a tailwind to market sentiment. In the fixed income space,the 10-year U.S. Treasury yield hit 3% before retreating back to 2.8% at month-end. In turn, yields in mostEuropean bond markets increased during the month, particularly during the back half when investors’ demandfor government bonds waned. For the month of May, the S&P 500 and the Dow Jones increased 0.18% and 0.33%; the FTSE 100 and the EuroStoxx 50 returned 1.13% and 1.28%; and the Hang Seng and the MSCIEM Index were up 2.15% and 0.47%, respectively.During the month, the ERS Absolute Return Portfolio (“Portfolio”) underperformed both on an absolute andrelative basis to its primary benchmark. The Portfolio outperformed its secondary benchmark. For the month ofMay, performance was mixed across the Portfolio’s underlying managers. In terms of attribution, the top twolargest contributors were both Relative Value managers. The largest detractors during the month included aGlobal Macro and an Equity Long/Short manager.The graphs below indicate current (left) and historical (right) strategy positioning of the Absolute Return Portfolioas of May 2022 month-end. The five strategies (and current positioning) include Relative Value (20.90%), EventDriven (32.81%), Global Macro (21.24%), Equity Long/Short (16.44%), and Opportunistic (8.62%). The ERSHedge Fund team is focused on maintaining its current portfolio exposures. The team saw one analyst departureduring May and will be looking to replace this employee over the coming months.7 Monthly Market Summary – May 2022
Strategy Exposures - Hedge Funds - Allocation,%May-2022 Equity Long/Short -16.44% Event Driven - 32.81% Global Macro 21.24% Relative Value 20.90%Opportunistic - 8.62%Strategy Exposures Hedge Funds Allocation, 4August 2012 to May-2022125100e75ee50Equity Long/ShortEvent OrlvenGlobal MacroOpportunisticRelative Value25020142016201820202022PRIVATE INFRASTRUCTURE MARKET SUMMARYERS Private Infrastructure closed one new transaction in the month of May, a 50 million commitment to KKRAsia Pacific Infrastructure Investors II. ERS Private Infrastructure’s target commitments for fiscal year 2022remains 450 million with a range of 315 million to 585 million.Since inception, Private Infrastructure has closed on twenty-nine co-investments and twenty-three funds withcommitments totaling 2,739 million (adjusted for currency exchange rates). ERS holds an LP AdvisoryCommittee seat on twenty-one funds and an observer seat on one fund. As of May 31, 2022 the Infrastructureportfolio Net Asset Value was 1,672 million, or 4.9% of system assets.FIXED INCOME MARKET SUMMARYThe U.S. economy remains in expansion though inflation headwinds continue to persist. The Federal Reserveplans to tackle inflation by increasing interest rates over the coming months; the market is currently pricing inabout 8 more Fed rate hikes of 25 bps in 2022. As the Fed continues to hike rates, the U.S. economy hasbegun slowing; this increases the risk that the Fed could push the U.S. into a recession. Treasury yields8 Monthly Market Summary – May 2022
modestly declined in May as investors became more optimistic that the Fed may not increase rates through theend of the year as much as anticipated. This provided some stability in risk assets.In May, the 10-year Treasury yield decreased 10 bps to 2.84% while the 2-year Treasury yield declined 16 bpsto 2.56%. Declining yields offered a reprieve for fixed income. The aggregate U.S. Treasury Index returned0.18% while the Investment Grade Corporate Index returned 0.93%. High Yield returned 0.23%, the firstpositive month of the calendar year. Domestic equities also had a positive month with the S&P 500 returning0.18% and Russell 2000 small cap stocks returning about 0.14%.Table 8: Index Total ReturnsMay 2022 (%)Calendar Year to Date (%)Intermediate Credit0.87-6.85Intermediate Treasury0.68-5.10U.S. Treasury0.18-8.33U.S. Agency0.49-5.31U.S. TIPS-0.99-5.95U.S. Investment Grade Corporate0.93-11.92Securitized1.04-7.28U.S. Corporate High Yield0.23-7.98Emerging Markets-0.02-13.17 Labor: The economy added 390,000 jobs during the month, beating expectations of 318,000 jobs added.The unemployment rate remained at 3.6%. Inflation: The Federal Reserve’s preferred measure of inflation, Core PCE, decreased from 5.2% to4.9% year over year. The market currently expects the Federal Reserve to increase interest rates 8 moretimes through the end of 2022 to stem the elevated levels of inflation. Housing: Existing home sales declined 2.4% month over month while new homes sales declined 16.6%month over month. Low inventories and supply chain issues have fueled large price increases in manymarkets. Rising interest rates also pose a significant headwind to affordability. Durable Goods: Durable goods orders increased 0.5% month over month. This measure signals thatbusinesses have continued to make investments even while the economy slows.9 Monthly Market Summary – May 2022
2s-10s U.S. Government Yield Spread. ::;;;I;.: t' - rl"'\l;e'llf"'l1!l ························· F'"'-·· ·:rW !f ········ l.50 ,, .,. . .,,. r l. oo0.500.00 US Generic Govt 10 Yr - t:6 Generic Govt 2 Yr 0.2876Moving 20152016201720182019202020212022The yield spread between 10-year and 2-year Treasuries increased from 22 basis points to 29 basis points.U.S. Government Yield Curve3.50 125 US Treasury Actives Curve 0S/ 31/22 Mid VTM I'- 125 US Treasury Actives Curve 04/?,0/ 22 Mid YTM .3.00/ 2.50I2.001.50 .1.000.50I-I/. /:'·/40C i, 5200Mid VTM h l/ 22-04/ 30/ 22 )-'-Ill II.-20I11H,III,.20Y30YI!SYTenorThe chart above shows the current shape of the yield curve versus one month ago.10 Monthly Market Summary – May 2022
The chart above shows sector returns for the MSCI ACWI ex US index in May, with Energy (8.7%) and Info Tech (1.6%) the top performing sectors, and Staples ( -1.9%) and Health Care ( -1.6%) the lowest. The chart above shows the performance of the MSCI ACWI ex US ( -5.6%), MSCI EAFE (-5.8%) and MSCI . The Domestic REIT portfolio was down 5.46% .