Transcription
Quarterly Investment PerformanceAnalysisMunicipality of Anchorage Trust FundPeriod Ended: March 31, 2018Agenda Item III. .D.(Detail)
Table Of Contents1234Capital Markets ReviewTotal PortfolioInvestment Manager ProfilesAddendum & GlossaryPage 3Page 10Page 29Page 50
Page 3
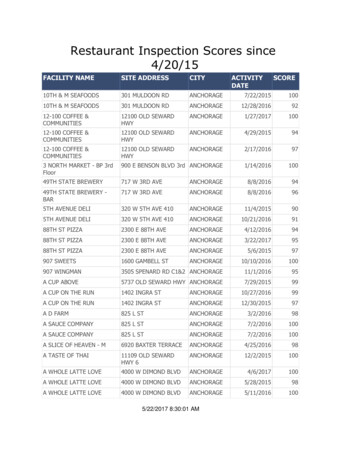
Capital Markets ReviewAs of March 31, 2018First Quarter Economic EnvironmentKey Economic IndicatorsThe quarter began with a substantial global equity market rally in January.Drivers of the rally included improving global economic fundamentals,continuation of generally accommodative monetary policies among globalcentral banks, and continued corporate earnings growth. The market rallyreversed sharply in February in response to an uptick in inflation expectations, arepricing of the yield curve, and a dramatic spike in equity market volatility. Thequarter ended with developed equity markets in negative territory, US durationsensitive assets down moderately, and global bond markets maintaining slightgains in part due to a weakening US Dollar. The Federal Open MarketCommittee set the federal funds target range at 1.50% to 1.75%, an increase of0.25%, and maintained guidance for two additional rate increases in 2018. USeconomic data continued to generally indicate a robust economic expansion.Non-farm payroll growth averaged in excess of 200,000 job gains per monthwhile Purchasing Manager’s data for both the US manufacturing and nonmanufacturing sectors indicated continued expansion.Economic IndicatorsFederal Funds Rate (%)Breakeven Infl. - 1 Yr (%)Breakeven Infl. - 10 Yr (%)CPI YoY (Headline) (%)Unemployment Rate (%)Real GDP YoY (%)PMI - ManufacturingUSD Total Wtd IdxWTI Crude Oil per Barrel ( )Gold Spot per Oz ( )Market Performance (%)S&P 500 (Cap Wtd)Russell 2000MSCI EAFE (Net)MSCI EAFE SC (Net)MSCI Emg Mkts (Net)Bloomberg US Agg BondBofA ML 3 Mo US T-BillNCREIF ODCE (Gross)Wilshire US REITHFRI FOF CompBloomberg Cmdty ec-17 Mar-17 .14.14.55.52.62.03.8 59.356.651.8 87.4793.9692.06 60.450.647.6 1,3031,2491,184 57-0.401 715 220 Yr2.29N/AN/A2.26.02.352.386.8956.479510 Yr9.499.842.746.483.023.630.345.116.221.58-7.71Key Economic mentRate (%)Since .44020CPI Year-overYear (% change)Since 1914US Govt Debt(% of GDP)Since 1940VIX Index(Volatility)Since 1990ConsumerConfidenceSince 1967Treasury Yield Curve ury data courtesy of the US Department of the Treasury. Economic data courtesy of Bloomberg Professional Service.Breakeven Inflation does not have 20 years of history; therefore, its 20-year average is shown as N/A.Page 41YDec-173Y5YMar-177Y10YMar-1620Y30YMar-15
US Equity ReviewAs of March 31, 2018First Quarter ReviewStyle and Capitalization Market Performance (%)Broad MarketDespite strong returns in January, US equity markets faltered during the finaltwo months of the quarter, delivering mixed results across market cap andstyle. The S&P 500 Index’s return of -0.76% marks the first negative quarterfor the index since Q3 2015. Declines were relatively widespread, with nine ofeleven sectors producing negative returns.R 3000-0.64S&P 500-0.76R 1000-0.69Style and SectorGrowth stocks led value stocks for the quarter as the Russell 1000 GrowthIndex outperformed its value counterpart by 4.25% for the quarter.Technology stocks led all other sectors posting 3.53% with consumerdiscretionary following close behind with 3.09% for the quarter.3530100R 1000 ValueR 2000 Value-2.6421.252.3018.63-102550804060US Large-CapEquityR1000 12M P/ESince 1995US Small-CapEquityR2000 12M P/ESince 19953010US Large-CapValue EquityR1000V 12M P/ESince 1995-5.02Real 6-3.30Valuation data courtesy of Bloomberg Professional Service and Robert J. Shiller, Irrational Exuberance, Second Edition.P/E metrics shown represent the 5th through 95th percentiles to minimize the effect of outliers.Page 518.0411.2713.953.53MaterialsUS Large-CapGrowth EquityR1000G 12M P/ESince 19951 Yr1.69Health CareInformation 20-7.12Energy510103.09Cons Discretion15150S&P 500 Index Sector Performance (%)15US Large-CapEquityShiller S&P 10Y P/ESince 19005.131.42R 2000 Growth202006.95Cons Staples25201011.79R 1000 Growth302513.98-0.08-2.83Valuations1 Yr13.99R 2000Market CapIncreased global macroeconomic uncertainty indirectly favored small capstocks, which tend to be more domestically-focused, providing greaterinsulation from global 40
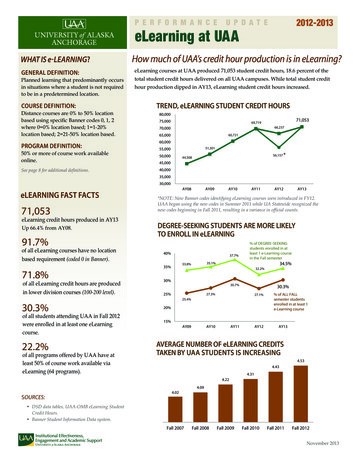
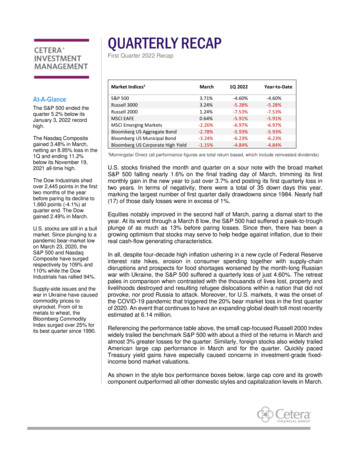
Non-US Equity ReviewAs of March 31, 2018First Quarter ReviewMSCI Style and Capitalization Market Performance (%)Developed MarketsDeveloped international markets lagged during the quarter, ending withnegative returns and underperforming their domestic counterparts. Marketmovements were affected by headlines related to global trade negotiations,however there were also significant political events within developedinternational markets.ACW Ex US-1.18EAFE-1.53Market Cap & StyleDeveloped international growth stocks continued to outperform value stocks,while small cap stocks outperformed large cap stocks, ending the quarter inslightly positive territory. Contrary to the rest of the world, emerging marketvalue outperformed growth.-2.0312.19-1.04EAFE Growth17.510.24EAFE SC23.49-1.98Europe14.49-0.68Pacific15.781.42Emg 100Intl EquityMSCI ACW x US12M P/ESince 199530200Developed IntlEquityMSCI EAFE12M P/ESince 199520100Developed IntlValue EquityMSCI EAFE Val12M P/ESince 19952030-1.25100Developed IntlGrowth EquityMSCI EAFE Grth12M P/ESince 199511.91-5.30-8.42-3.73Pacific ex ts EquityMSCI EM12M P/ESince 1995Valuation data courtesy of Bloomberg Professional Service.P/E metrics shown represent the 5th through 95th percentiles to minimize the effect of outliers.All returns are shown net of foreign taxes on dividends.Page 61 Yr-3.88Middle East20QTD15.51United Kingdom20302010MSCI Region Performance (%)Europe Ex UK501 Yr14.80EAFE ValueEmerging MarketsEmerging markets outperformed domestic and developed international forboth the quarter and the trailing one year period. MSCI Emerging MarketsIndex outpaced the MSCI EAFE Index by 295 basis points during the quarter.QTD16.534.911.42Emg Mkts24.93-15-55152535
Fixed Income ReviewAs of March 31, 2018Fixed Income Performance (%)First Quarter ReviewBroad MarketTreasury yields increased across all maturities leading to negative returnsacross rate-sensitive fixed income indices. The Bloomberg Barclays USAggregate Bond Index posted a return of -1.46% during the quarter. Longerduration bonds were hit the hardest with the Bloomberg Barclays US LongGovernment/Credit Index returning -3.58%.Credit MarketInvestment grade and high yield credit spreads widened modestly, ending anine-quarter streak of spread tightening.Emerging Market DebtNon-US dollar denominated emerging market debt was the best performingsub-asset class within fixed income over the quarter, returning 4.44%. Incontrast, hard currency and corporate emerging market debt ended thequarter with negative returns after four consecutive quarters of postingpositive returns.1.23.03.5121.02.53.020.20.50.500.00.00.0US CreditBondsBloomberg USCredit SpreadsSince 2000US High-YieldBondsBloomberg USCorp:HY SpreadsSince 20004US Treasury Bonds10-Yr US TreasuryYieldsSince 19532.00.61.5US AggregateBondsBloomberg USAgg SpreadsSince 2000US CorporateBondsBloomberg USCorp SpreadsSince 1989-0.79Bloomberg US Trsy: US TIPS0.92-1.20Bloomberg US CMBS Inv 1.00.62-0.86Bloomberg US Corp: Hi Yld1.060.80.43Bloomberg US MBS0.48Bloomberg US TrsyBloomberg US Agcy1098765432103.781.58CS Leveraged Loan4.641.37Bloomberg Global Agg Bond6.982.50FTSE Wrld Gov't Bond8.49-1.78JPM Emg Mkts Bond GlobalValuation data courtesy of Bloomberg Professional Service.Valuations shown represent the 5th through 95th percentiles to minimize the effect of outliers.Page 71 Yr-1.18Bloomberg US ABS14QTD1.20Bloomberg US Corp: CreditValuations10-1.46Bloomberg US Agg3.344.44JPM GBI-EM Glbl Dvf'd (USD)(Unhedged)12.99-1001020
Alternatives ReviewAs of March 31, 2018First Quarter Review - Absolute ReturnGeneral Market - Hedge FundsHedge funds produced modestly positive returns during the first quarter of2018, though heightened levels of market volatility created significantdispersion across strategies. FoHFs that outperformed benefitted frommanager selection within the discretionary macro space, where severalmanagers correctly bet on rising interest rates and produced near doubledigit returns or higher during the quarter. Managers within the multi-strategyspace produced negative returns on average according to HFR, but the firmsRVK tracks closely were modestly positive during the quarter, producingaverage returns near 1%.First Quarter Review - Real AssetsGeneral Market - Diversified Inflation Strategies (DIS)DIS managers posted weak returns despite increases in market-basedmeasures of future inflation and heightened press attention about thepotential for further acceleration of inflationary pressure. Marketexpectations of future inflation also increased modestly from 1.98% to2.06% based on 10 Year Treasury breakevens. Managers with greaterexposure to floating rate credit-sensitive fixed income and foreigncurrency performed toward the top of the peer group. Managers withsignificant MLP exposure within global listed infrastructure allocationslagged by the widest margins.General Market - Global Tactical Asset Allocation (GTAA)GTAA managers provided modestly positive performance and for the mostpart, tended to outperform traditional asset classes. Globally-orientedmanagers that rely on fundamental, value-based investment processes havecontinued to allocate to various exposures in emerging markets, which theybelieve to be undervalued.General Market - Real EstateThe Core private real estate index, NCREIF-ODCE, returned 2.2%during Q1, on a preliminary basis, comprised of 1.0% income and 1.2%appreciation. Investors in publicly traded real estate significantlyunderperformed their private market counterparts during the quarter asmeasured by Wilshire US REIT Index return of -7.48%.HFRI Hedge Fund Performance (%)HFRI FOF0.57Conv Arbitrage0.64Equity Hedge0.59Mkt Neutral Eq0.83Short Bias0.000.000.58Distressed-1.25MacroEvent DrivenMerger ArbCredit Arb-10QTD5.8602.19NCREIF ODCE (Gross)8.061 Yr4.814.475.33-7.48Wilshire US REIT-3.64-0.40Bloomberg Cmdty (TR)4.18103.71-1.65S&P Glbl Nat. Res. (TR)Alerian MLP17.21-11.12-20.07-0.79Bloomberg US Trsy: US TIPS200.92-30Page 8QTD1 Yr0.00NCREIF lative Value-20Real Asset Performance (%)-20-100102030
As of March 31, 2018Annual Asset Class PerformanceBestWorstS&P 500 US .48Bloombrg Bloombrg NCREIFR 2000 - MSCI EAFE MSCI EAFE MSCI EM Bloombrg BloombrgWilshireUS Trsy:USODCEUS Small (Net) - Int'l SC (Net) - (Net) - Int'l US AggUS Corp:US REIT US TIPS - Gov/Credit: (Gross) CapDev.Int'l SCEmg Mkts Bond - FI Hi Yield - FIREITsFILng - FI Real EstateNCREIF ODCE (Gross) performance is reported quarterly; performance is shown N/A in interim-quarter months.Page 9HFRI FOFICEBloombrgCompBofAML 3Cmdty (TR)Index Mo T-Bill - Commod.ARSCash Equiv
Page 10
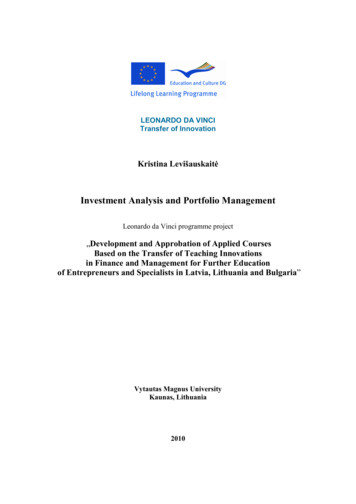
As of March 31, 2018Municipality of Anchorage Trust FundAsset Alloc. by Manager, Asset Allocation vs. Target & Schedule of Investable AssetsAsset Allocation by ManagerAsset Allocation vs. Target AllocationMarch 31, 2018 : 162,170,946Domestic EquityInternational EquityDomestic Fixed IncomeBank LoansEMDReal EstateCash EquivalentsTotal FundMarket Value( 0.010.00Asset Allocation vs. Target Allocation DifferencesVanguard Instl Indx;Inst (VINIX)FIAM Core Plus LLC (CF)Garcia Hamilton Core Agg (SA)American Funds EuPc;F3 (FEUPX)TIF:Internatl Equity;Prm (TFEQX)UBS Trumbull Property (CF)Western Asset Floating Rate High Income (CF)BlackRock:Adv SC Cr;Inst (BDSIX)Vanguard Md-Cp Idx;Adm (VIMAX)Wells Fargo 3017.5412.4812.4012.127.793.132.632.610.01Domestic Equity-0.46 %International Equity-0.48 %Domestic Fixed Income6.02%Bank LoansEMD0.13%-5.00 %Real Estate-0.21 %Cash Equivalents0.01%-6.00 %0.00%6.00%Allocation DifferencesSchedule of Investable AssetsPeriods EndingCYTDBeginningMarket Value ( )165,019,327NetCash Flow ( )-2,990,093Gain/Loss ( )141,712EndingMarket Value ( )162,170,946% ReturnUnit Value0.08100.08Allocations shown may not sum up to 100% exactly due to rounding. Performance shown is net of fees. Garcia Hamilton Core Agg (SA) was funded in January 2018.Page 11
As of March 31, 2018Municipality of Anchorage Trust FundTotal Fund Thematic and Liquidity AnalysisAsset Allocation by ThemeThematic Analysis - October 1, 1999 to March 31, 2018Asset Allocation by LiquidityCorrelation Matrix - 10 YearsA1.000.56-0.360.46ABCDABCDRVK Liquidity Rating BCD1.00-0.240.861.00-0.021.00HFRI EH: Eq Mkt Neut Index (Alpha)MSCI ACW Index (USD) (Gross) (Capital Appreciation)Bloomberg US Gov't Bond Index (Capital Preservation)Real Return Custom Index (Inflation)83Asset Allocation by Theme is based on dedicated manager allocations; as such, thematic allocations are approximations. The RVK Liquidity Rating is calculatedusing beginning of month investment weights applied to each corresponding asset class liquidity rating. Please see the Glossary for additional informationregarding liquidity, thematic and custom index descriptions.Page 12
1 Quarter Ending March 31, 2018Municipality of Anchorage Trust FundTotal Fund Composite vs. Target Allocation IndexTotal Fund AttributionTotal Fund PerformanceTotal Value Added: 0.62%Total Asset Allocation: 0.11%Total Manager Value Added: 0.50%Performance shown is net of fees. Calculation is based on monthly periodicity. Please see the Glossary for additional information regarding the Total FundAttribution calculation.Page 13
1 Year Ending March 31, 2018Municipality of Anchorage Trust FundTotal Fund Composite vs. Target Allocation IndexTotal Fund AttributionTotal Fund PerformanceTotal Value Added: 0.54%Total Asset Allocation: 0.23%Total Manager Value Added: 0.34%Performance shown is net of fees. Calculation is based on monthly periodicity. Please see the Glossary for additional information regarding the Total FundAttribution calculation.Page 14
As of March 31, 2018Municipality of Anchorage Trust FundAll Public Plans ( 250M)Plan Sponsor TF Asset 005.00-10.00-25.00Total Fund CompositeUS Equity34.54 (89)Intl. Equity24.52 (15)5th Percentile1st QuartileMedian3rd Quartile95th 2.58332310328106PopulationUS Fixed Income33.15 (34)Intl. Fixed IncomeN/AParentheses contain percentile ranks.Page 15Alternative Inv.0.00Real Estate7.79 (54)Cash0.01 5.732.121.310.620.1179177287
As of March 31, 2018Return (%)Municipality of Anchorage Trust FundAll Public Plans ( 250M)Plan Sponsor Peer Group Analysis3Years6.90 (23)6.64 (33)5Years8.36 (26)7.70 (58)7Years8.17 (23)7.54 (47)10Years6.93 (37)6.23 (78)2017201620150.16 (17)-0.54 (64)1Year11.27 (21)10.35 (44)16.76 (19)15.80 (42)6.58 (65)7.48 (40)0.76 (31)0.29 21QTDCYTDTotal Fund CompositeTarget Allocation Index0.16 (17)-0.54 (64)5th Percentile1st QuartileMedian3rd Quartile95th PercentilePopulationPerformance shown is gross of fees. Composite performance prior to January 2016 consists of gross performance for separate accounts and commingled fundinvestments, and net performance for mutual fund investments. Calculation is based on monthly periodicity. Parentheses contain percentile ranks.Page 16
As of March 31, 2018Return (%)Municipality of Anchorage Trust FundAll Endowments & Foundations ( 250M)Plan Sponsor Peer Group Analysis3Years6.90 (14)6.64 (20)5Years8.36 (9)7.70 (22)7Years8.17 (9)7.54 (19)10Years6.93 (13)6.23 (31)2017201620150.16 (15)-0.54 (62)1Year11.27 (19)10.35 (39)16.76 (26)15.80 (46)6.58 (56)7.48 (33)0.76 (13)0.29 27QTDCYTDTotal Fund CompositeTarget Allocation Index0.16 (15)-0.54 (62)5th Percentile1st QuartileMedian3rd Quartile95th PercentilePopulationPerformance shown is gross of fees. Composite performance prior to January 2016 consists of gross performance for separate accounts and commingled fundinvestments, and net performance for mutual fund investments. Calculation is based on monthly periodicity. Parentheses contain percentile ranks.Page 17
As of March 31, 2018Municipality of Anchorage Trust FundTotal Fund Composite vs. All Public Plans ( 250M)Plan Sponsor Scattergram - 7 YearsReturnTotal Fund CompositeTarget Allocation IndexMedian8.177.547.49Up/Down Markets - 7 YearsStandardDeviation7.297.107.44Plan Sponsor Peer Group Analysis - Multi Statistics (Beta vs. S&P 500)9.44StandardDeviation8.728.007.286.565.84Total Fund CompositeTarget Allocation Index7Years7.29 (58)7.10 (69)7Years1.08 (27)1.03 (42)7Years7.88 (24)7.28 (50)7Years4.26 (63)4.18 (71)7Years0.63 (59)0.61 27227Performance shown is gross of fees. Composite performance prior to January 2016 consists of gross performance for separate accounts and commingled fundinvestments, and net performance for mutual fund investments. Calculation is based on monthly periodicity. Parentheses contain percentile ranks.Page 18
As of March 31, 2018Municipality of Anchorage Trust FundTotal Fund Composite vs. All Public Plans ( 250M)Plan Sponsor Scattergram - 10 YearsReturnTotal Fund CompositeTarget Allocation IndexMedian6.936.236.70Up/Down Markets - 10 YearsStandardDeviation10.149.779.74Plan Sponsor Peer Group Analysis - Multi Statistics (Beta vs. S&P 500)12.00StandardDeviation10.008.006.00Total Fund CompositeTarget Allocation Index10Years10.14 (34)9.77 (49)10Years0.68 (51)0.63 (72)10Years6.91 (32)6.20 (78)10Years7.05 (30)6.75 (44)10Years0.65 (31)0.63 02202Performance shown is gross of fees. Composite performance prior to January 2016 consists of gross performance for separate accounts and commingled fundinvestments, and net performance for mutual fund investments. Calculation is based on monthly periodicity. Parentheses contain percentile ranks.Page 19
As of March 31, 2018Municipality of Anchorage Trust FundDomestic Equity Composite vs. All Public Plans-US Equity SegmentPlan Sponsor Scattergram - 10 YearsReturnDomestic Equity CompositeRussell 3000 IndexMedian9.659.629.28Up/Down Markets - 10 YearsStandardDeviation15.9215.4815.63Plan Sponsor Peer Group Analysis - Multi Statistics (Beta vs. S&P 500)Domestic Equity CompositeRussell 3000 Index10Years15.92 (29)15.48 (56)10Years0.64 (39)0.65 (32)Median15.630.622727Population10Years10.21 (31)10.11 (36)10Years11.02 (36)10.68 (71)10Years1.05 (25)1.03 (48)9.6810.911.02272727Performance shown is gross of fees. Composite performance prior to January 2016 consists of gross performance for separate accounts and commingled fundinvestments, and net performance for mutual fund investments. Calculation is based on monthly periodicity. Parentheses contain percentile ranks.Page 20
As of March 31, 2018Municipality of Anchorage Trust FundDomestic Equity Composite vs. Russell 3000 IndexPortfolio CharacteristicsTop Ten Equity HoldingsApple IncMicrosoft CorpAmazon.com IncFacebook IncJPMorgan Chase & CoBerkshire Hathaway IncJohnson & JohnsonExxon Mobil CorpAlphabet IncAlphabet Inc% of PortfolioPortfolio -1.33-1.49-6.60-6.05Wtd. Avg. Mkt. Cap ( M)Median Mkt. Cap ( M)Price/Earnings RatioPrice/Book Ratio5 Yr. EPS Growth Rate (%)Current Yield (%)Beta (5 Years, Monthly)Number of SecuritiesDistribution of Market Capitalization (%)Alphabet Inc. is shown twice in the Top Ten Equity Holdings to represent the Class A and Class C shares.Page Benchmark163,8821,70221.163.2214.271.871.002,958
As of March 31, 2018Municipality of Anchorage Trust FundInternational Equity Composite vs. All Public Plans-Intl. Equity SegmentPlan Sponsor Scattergram - 10 YearsReturnInternational Equity CompositeMSCI ACW Ex US Index (USD) (Net)Median3.872.704.04Up/Down Markets - 10 YearsStandardDeviation17.7518.7118.52Plan Sponsor Peer Group Analysis - Multi Statistics (Beta vs. S&P 0.203.6011.15International Equity CompositeMSCI ACW Ex US Index (USD) (Net)10Years17.75 (75)18.71 (35)10Years0.29 (58)0.22 (97)10Years5.07 (69)4.12 (97)10Years12.55 (79)13.48 (38)10Years1.06 (79)1.12 onPerformance shown is gross of fees. Composite performance prior to January 2016 consists of gross performance for separate accounts and commingled fundinvestments, and net performance for mutual fund investments. Calculation is based on monthly periodicity. Parentheses contain percentile ranks.Page 22
As of March 31, 2018Municipality of Anchorage Trust FundInternational Equity Composite vs. MSCI ACW Ex US Index (USD) (Net)Portfolio CharacteristicsTop Ten Equity HoldingsTaiwan Semiconductor MfgAIA Group LtdSoftbank Group CorpBP PLCAirbus SEBaidu IncBritish American Tobacco PLCAlibaba Group Holding LtdBNP PARIBASBarclays PLC% of PortfolioPortfolio -1.40-7.18-0.54Wtd. Avg. Mkt. Cap ( M)Median Mkt. Cap ( M)Price/Earnings RatioPrice/Book Ratio5 Yr. EPS Growth Rate (%)Current Yield (%)Beta (5 Years, Monthly)Number of SecuritiesDistribution of Market Capitalization (%)Page chmark67,4708,75514.452.1310.213.051.001,864
As of March 31, 2018Municipality of Anchorage Trust FundDomestic Fixed Income Composite vs. All Public Plans-US Fixed Income SegmentPlan Sponsor Scattergram - 10 YearsReturnDomestic Fixed Income CompositeBloomberg US Agg Bond IndexMedian5.303.634.45Up/Down Markets - 10 YearsStandardDeviation4.013.264.46Plan Sponsor Peer Group Analysis - Multi Statistics (Beta vs. S&P 500)Domestic Fixed Income CompositeBloomberg US Agg Bond Index10Years4.01 (63)3.26 (95)10Years1.21 (13)1.00 (38)10Years4.92 (25)3.28 (80)10Years2.43 (67)1.78 (95)10Years0.12 (41)0.01 Performance shown is gross of fees. Composite performance prior to January 2016 consists of gross performance for separate accounts and commingled fundinvestments, and net performance for mutual fund investments. Calculation is based on monthly periodicity. Parentheses contain percentile ranks.Page 24
As of March 31, 2018Municipality of Anchorage Trust FundDomestic Fixed Income Composite vs. Bloomberg US Agg Bond IndexPortfolio CharacteristicsPortfolio CharacteristicsEffective DurationConvexityYield To Maturity (%)Yield To Worst (%)Avg. MaturityAvg. QualityPortfolio4.500.353.553.587.06A1Sector Distribution (%)Allocation to "Other" consists of ETF holdings.Page 25Benchmark6.080.323.123.128.42Aa1/Aa2
As of March 31, 2018Municipality of Anchorage Trust FundComparative tic Large Cap Equity CompositeRussell 1000 .04Vanguard Instl Indx;Inst (VINIX)S&P 500 Index (Cap Wtd)DifferenceIM U.S. Large Cap Core Equity (MF) 2713.31-0.0412.0515Domestic Mid Cap Equity CompositeVanguard Spl Mid Cap 6-0.067.907.900.00Vanguard Md-Cp Idx;Adm (VIMAX)Vanguard Spl Mid Cap IndexDifferenceIM U.S. Mid Cap Core Equity (MF) 12.3112.36-0.059.2125Domestic Small Cap Equity CompositeSmall Cap Custom :Adv SC Cr;Inst (BDSIX)Russell 2000 IndexDifferenceIM U.S. Small Cap Core Equity (MF) QTDCYTDTotal Fund CompositeTarget Allocation IndexDifferenceConsumer Price Index 4.25%Difference0.08-0.540.622.29-2.21Domestic Equity CompositeRussell 3000 01/2016Performance shown is net of fees. Performance is annualized for periods greater than one year. Please see the Addendum for custom index definitions.Page 26
As of March 31, 2018Municipality of Anchorage Trust FundComparative 300.844.0047N/A2.10N/A2.54N/AAmerican Funds EuPc;F3 (FEUPX)MSCI ACW Ex US Grth Index (USD) (Net)DifferenceIM ACWI Ex US Growth (MF) .35256.565.171.396.1735Domestic Fixed Income CompositeBloomberg US Agg Bond 01.422.701.201.502.691.820.87FIAM Core Plus LLC (CF)Bloomberg US Agg Bond IndexDifferenceIM U.S. Broad Market Core Fixed Income (MF) 192.181.200.981.71282.621.201.421.6611Garcia Hamilton Core Agg (SA)Bloomberg US Agg Bond IndexDifferenceIM U.S. Broad Market Core Fixed Income (MF) A1.20N/A1.11N/AWestern Asset Floating Rate High Income (CF)S&P/LSTA Performing Loans IndexDifferenceIM U.S. Bank Loans (MF) 164.63-1.473.7577QTDCYTDInternational Equity CompositeMSCI ACW Ex US Index (USD) (Net)Difference-0.21-1.180.97TIF:Internatl Equity;Prm (TFEQX)MSCI ACW Ex US Val Index (USD) (Net)DifferenceIM ACWI Ex US Value (MF) 41.264.
MSCI ACW x US 12M P/E Since 1995. MSCI Style and Capitalization Market Performance (%) MSCI Region Performance (%) Emerging Markets Equity MSCI EM 12M P/E Since 1995 Developed Intl Growth Equity MSCI EAFE Grth 12M P/E Since 1995 Developed Intl Value Equity MSCI EAFE Val 12M P/E Since 1995. First Quarter Review Valuations. 24.93 15.78 14.49 23. .