Transcription
Advisor ServicesSchwab RIACompensationReportAn addendum to Schwab’s 2020RIA Benchmarking StudyMedia Contact:Meredith RichardCharles Schwab Public Relations646.343.7419Meredith.Richard@schwab.com
IntroductionSchwab’s RIA BenchmarkingStudy is the leading studyin the industry—761 firmsparticipated in the compensationportion of the study in 2020,representing three-quarters ofthose who participated in theoverall study (1,010 firms). Datawas collected on nearly 10,000employees across 27 roles. Schwab’s RIA Compensation Report reflects responsesfrom Schwab’s 2020 RIA Benchmarking Study, the largeststudy of its kind, and offers a comprehensive look atcompensation practices in the independent financial adviceindustry in 2019. The compensation findings enable firms to evaluatehow their approach to employee compensation, incentives,benefits, and firm ownership compares with that oftheir peers. Key report highlights: 2019 compensation costs are 74% of a firm’s expenses. The competition for talent is growing: 75% of firmshired staff in 2019, and 39% of firms recruitedemployees from other RIAs.1 Median total cash compensation across allroles increased 4% from 2018 to 2019. Over three-quarters (77%) of firms compensatedstaff with performance-based incentive pay in 2019. Firms are increasingly adding client team andspecialized roles to support strategic firm growthand deliver exceptional client experiences.1 The2020 Benchmarking Study from Charles Schwab was fielded from January to early April 2020. The study contains self-reported data from 1,010 RIA firms. Hiring data represents firms with 250 millionor more in AUM.2020 RIA Benchmarking Study from Charles Schwab11
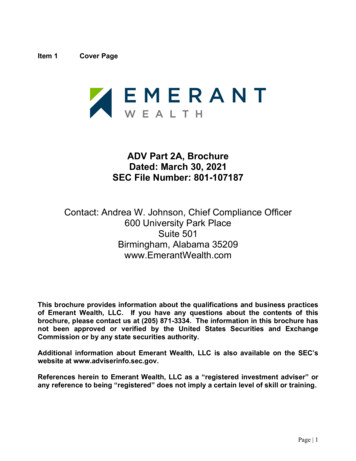
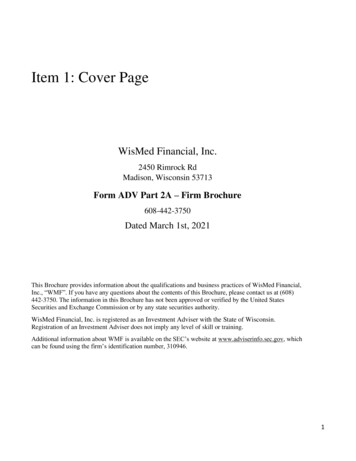
Key Compensation FindingsTalented employees help drivefirm growth, especially in a volatileenvironment. That’s why having ahigh-performing team, unlockingtheir potential and rewarding anddeveloping the next generation ofleadership is vital to RIA firmsuccess.Schwab’s 2020 RIA BenchmarkingStudy supports firms in developingsuccessful compensation strategiesto attract, motivate, and retainkey staff.Client Account Management, Sales, and Marketing Base salaries for client account management, sales, and marketing roles ranged from 60,000– 150,000 at the median. Total cash compensation ranged from 64,000– 204,000 at the median. Total cashcompensation, including owner profit distributions, ranged from 64,000– 240,000 atthe median. The majority of client account management, sales, and marketing roles receive performancebased incentive pay. Nearly a quarter (24%) of Senior Client Account Mangers / Relationship Managers havecompensation tied to revenue and 49% have some degree of firm ownership‒more than anyother non-executive management role.Investments Base salaries for investments roles ranged from 60,000– 125,000 at the median. Total cash compensation ranged from 65,000– 160,000 at the median. Total cash compensation, including owner profit distributions,ranged from 65,000– 170,000. More than 55% of all investments roles receive performance-based pay. 80% of Paraplanners collect performance-based incentivepay, followed by 78% of Portfolio Administrators, 76% of Traders, 73% of Research Analysts, 72% of Financial Planners, and 55% ofInvestment/Portfolio Managers. Nearly one-third (31%) of Investment/Portfolio managers and 13% of Financial Planners have some degree of firm ownership. Over aquarter (26%) of Financial Planners have 50% or more ownership in their firms, while 17% of Investment/Portfolio Managers have 50%or more ownership.Operations and Administration Base salaries for operations and administration roles ranged from 45,000– 97,000 at the median. Total cash compensation ranged from 48,000– 111,000 at the median. Total cash compensation, including owner profit distributions,ranged from 48,000– 113,000. More than eight in ten (83%) Human Resource Professionals receive performance-based incentive pay, followed by TechnologyProfessionals (80%), Internal Accountants / Bookkeepers (79%), and Operations Directors/Managers and Executive Assistants (76%). While operations and administrations staff are less likely to receive firm equity, 15% of Operations Directors/Managers hold somefirm ownership.2020 RIA Benchmarking Study from Charles Schwab1 Moreinformation on specific roles can be found in the Definitions section of the report.2
2020 RIA Benchmarking Study from Charles Schwab3
2020 RIA Benchmarking Study from Charles Schwab4
Talent & StaffingNearly four in ten firms recruit from other RIA firms, emphasizingthe need for a compelling compensation strategy and employeevalue proposition.Firms that hired in 201975%Median firm hired2 new staffin 2019Recruitment channels in 201939%RIAsColleges and universitiesFirms that planned to hire in 2020Bank or trustWirehouse73%IBD33%16%12%10%Median results for all firms with 250 million or more in AUM. Past performance is not an indicator of future results. 2020 RIA Benchmarking Study from Charles Schwab, fielded January to early April2020. Study contains self-reported data from 1,010 firms.2020 RIA Benchmarking Study from Charles Schwab5
Talent & StaffingPlanning for increased staff and more complex organizationalstructures is critical as firms grow.Total staff by AUM (median)552019 compensationcosts are74%of a firm’s expenses213Up to 100M57 100M– 250M 250M– 500M12 500M– 1B 1B– 2.5BOver 2.5BResults for firms by AUM peer group. Compensation costs include salaries, bonuses, benefits, payroll taxes, and profit distributions. Past performance is not an indicator of future results. 2020 RIABenchmarking Study from Charles Schwab, fielded January to early April 2020. Study contains self-reported data from 1,010 firms.2020 RIA Benchmarking Study from Charles Schwab6
CompensationAcross the RIA industry, total compensation ticked up yearover year. 4%Change in median totalcash compensation across allroles1 from 2018 to 20191 Medianpercent change for the 27 roles in the compensation portion of the RIA Benchmarking Study from Charles Schwab. Total cash compensation includes owner profit distributions.Past performance is not an indicator of future results. 2020 RIA Benchmarking Study from Charles Schwab, fielded January to early April 2020. Study contains self-reported data from 1,010 firms forthe main study and 761 firms for the compensation portion.2020 RIA Benchmarking Study from Charles Schwab7
CompensationClient team and specialized roles have seen a long-termincrease in compensation, some more than others.Total cash compensation including owner profit distributionsMedian, in thousands 202Senior Client Account/Relationship Manager 97 105Client Account/Relationship ManagerClient ServicesAssociate 57 64ParaplannerPortfolio AdministratorOperations Director/ManagerChief ComplianceOfficer 60 6519%8%13% 87 95Financial Planner 2409%8% 60 7220%2015 952019 11318% 140 15511%Past performance is not an indicator of future results. 2020 RIA Benchmarking Study from Charles Schwab, fielded January to early April 2020. Study contains self-reported data from 1,010 firms forthe main study and 761 firms for the compensation portion.2020 RIA Benchmarking Study from Charles Schwab8
CompensationAttractive compensation packages include more than basesalary, particularly for revenue-generating roles.Base salary as a percent of total cashcompensation1 in 2019 across all rolesBase salary as a percent of total cashcompensation1 in 2019 by role type2Revenue roles70%81%Non-Revenue roles90%1 Total2cash compensation includes base salary, performance-based incentive pay, compensation tied to revenue generation, and owner profit distributions.Role types exclude Executive Management roles.Past performance is not an indicator of future results. 2020 RIA Benchmarking Study from Charles Schwab, fielded January to early April 2020. Study contains self-reported data from 1,010 firms forthe main study and 761 firms for the compensation portion.2020 RIA Benchmarking Study from Charles Schwab9
CompensationMotivating staff with incentive compensation can impact thequality of talent, engage employees, and advance the firm’s goals.77% of firmscompensated staffwith performancebased incentive payin 2019.13 of 4 reportedroles receivedperformance-basedincentive payin 2019.21 Performance-based2 Medianincentive pay includes discretionary bonus and compensation resulting from firm goals, department or team goals, and business development results.result for firms that compensated staff with performance-based incentive pay in 2019.Past performance is not an indicator of future results. 2020 RIA Benchmarking Study from Charles Schwab, fielded January to early April 2020. Study contains self-reported data from 1,010 firms forthe main study and 761 firms for the compensation portion.2020 RIA Benchmarking Study from Charles Schwab10
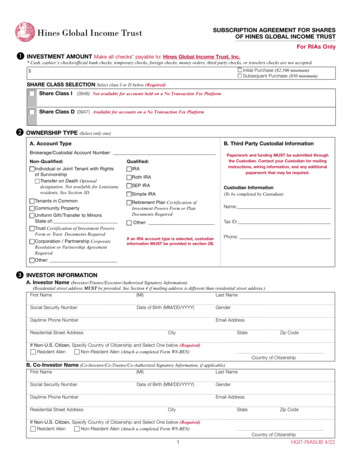
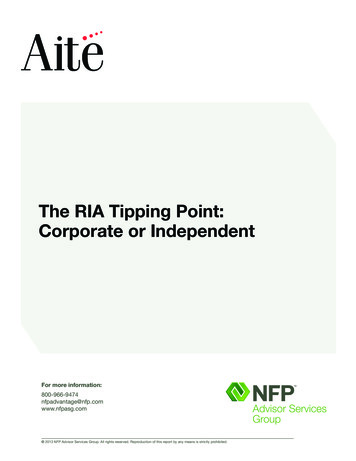
CompensationCompensation tied to revenue generation from new and existingclients can help ensure staff are aligned with the firm’s growthobjectives.Across the study,28% of firms tiedcompensation torevenue generationin 2019.At the median firm,1 in 4 rolestied compensationto revenue generationin 2019.Percent of reported roles that tie compensation to revenue generation includes only those firms that tie compensation to revenue generation. Past performance is not an indicator of future results. 2020RIA Benchmarking Study from Charles Schwab, fielded January to early April 2020. Study contains self-reported data from 1,010 firms for the main study and 761 firms for the compensation portion.2020 RIA Benchmarking Study from Charles Schwab11
Equity OwnershipEquity ownership is an important part of compensation, as ithelps to retain talent and support firms’ succession strategies.Working owners1 as a percent of total staff2015201933% 33%33%29%27%22% 100M– 250M1 Working 250M– 500M 500M– 1B22% 22%Over 1Bowners are staff that hold equity in the firm.Results from the 2016 and 2020 RIA Benchmarking Study from Charles Schwab. 2020 RIA Benchmarking Study from Charles Schwab, fielded January to early April 2020. Study contains self-reporteddata from 1,010 firms for the main study and 761 firms for the compensation portion.2020 RIA Benchmarking Study from Charles Schwab12
BenefitsHealth benefits are a key element of a competitivecompensation package.Percent of firms providing benefitHealth insuranceDental insurance99%97%Vision insuranceLife %29%11% 10%14%Up to 100M 100M– 250M 250M– 500M 500M– 1BOver 1BResults for firms by AUM peer group. Past performance is not an indicator of future results. 2020 RIA Benchmarking Study from Charles Schwab, fielded January to early April 2020. Study contains selfreported data from 1,010 firms for the main study and 761 firms for the compensation portion.2020 RIA Benchmarking Study from Charles Schwab13
Organizational StructureAn effective organizational structure can enable strategic growthby establishing the foundation for roles and responsibilities.Age of firm2019 AUM2019 totalstaffFirm with one advisor, possibly with administrativesupport.9 942Firm with two or more advisors–advisors retain their ownclients, are compensated on their own book of business,and share overhead costs.12 268521 482923 2,27137ModelDefinitionSoloSiloEnsembleFirm with multiple advisors–clients belong to the firmand are served by a team from a relationshipmanagement perspective.Fully centralized ensemble: Ensemble operationalprocesses are standardized, and staff operate as afunctional team.EnterpriseLarge firm with multiple locations and advisors–clientsbelong to the firm. Well-defined functionalteams/departments and multiple layers of leadership.Fully centralized enterprise: Enterprise operations arestandardized across all locations or processed in asingle location.Median results by organizational structure for those firms completing the compensation portion of the RIA Benchmarking Study from Charles Schwab. Past performance is not an indicator of futureresults. 2020 RIA Benchmarking Study from Charles Schwab, fielded January to early April 2020. Study contains self-reported data from 1,010 firms for the main study and 761 firms for thecompensation portion.2020 RIA Benchmarking Study from Charles Schwab14
Organizational StructureFirms most often identify with the ensemble model, whereclients belong to the firm and are served by a team.100%50%SoloSiloEnsembleFully centralized ensembleEnterpriseFully centralized enterprise0%Up to 100M 100M- 250M 250M- 500M 500M- 1BOver 1BPast performance is not an indicator of future results. 2020 RIA Benchmarking Study from Charles Schwab, fielded January to early April 2020. Study contains self-reported data from 1,010 firms forthe main study and 761 firms for the compensation portion.2020 RIA Benchmarking Study from Charles Schwab15
Organizational StructureAs organizational structures become more complex, client teamand specialized roles are more prevalent.Percent of firms with roleSoloSiloEnsembleEnterpriseSenior Client Account/Relationship Manager14%34%60%86%Client Account/Relationship Manager12%34%51%81%Client Services Associate12%34%56%84%Financial Planner6%15%31%42%Paraplanner4%7%20%39%Portfolio rations Director/ManagerChief Compliance OfficerResults by organizational structure for those firms completing the compensation section of the RIA Benchmarking Study from Charles Schwab. Past performance is not an indicator of future results.2020 RIA Benchmarking Study from Charles Schwab, fielded January to early April 2020. Study contains self-reported data from 1,010 firms for the main study and 761 firms for the compensation portion.2020 RIA Benchmarking Study from Charles Schwab16
Organizational StructureOver the years, demand for these roles has increased as RIAshave grown.Increase in percent of firms with role from 2015 to 2019Senior Client Account/Relationship Manager30%Client Account/Relationship Manager24%Client ServicesAssociate17%Financial Planner12%28%ParaplannerPortfolio AdministratorOperations Director/ManagerChief ComplianceOfficer3%13%33%Past performance is not an indicator of future results. 2020 RIA Benchmarking Study from Charles Schwab, fielded January to early April 2020. Study contains self-reported data from 1,010 firms forthe main study and 761 firms for the compensation portion.2020 RIA Benchmarking Study from Charles Schwab17
Organizational StructureProviding career paths supports staff development, improvesengagement, and builds bench strength.Client ServiceCareer PathFirms with staff in at least 2 of the 3 roles: Client Service Associate Client Account Manager/RelationshipManager Senior Client AccountManager/Relationship Manager42%Firms under 250M69%Firms 250M– 1B82%Firms 1B Firms with staff in at least 2 of the 3 client service roles (Client Service Associate, Client Account Manager/Relationship Manager, Senior Client Account Manager/Relationship Manager) listed in theCompensation section of the RIA Benchmarking Study from Charles Schwab.Past performance is not an indicator of future results. 2020 RIA Benchmarking Study from Charles Schwab, fielded January to early April 2020. Study contains self-reported data from 1,010 firms forthe main study and 761 firms for the compensation portion.2020 RIA Benchmarking Study from Charles Schwab18
Organizational StructureWhile an operations career path is not as prevalent as a clientservice career path, it is critical as firms become more complex.38%38%Firms 250M– 1BOperationsCareer PathFirms with staff in at least 2 of the 3 roles: Operations Associate Operating Director/Manager Chief Operating Officer13%Firms under 250M64% 64%38%Firms 250M– 1BFirms 1B 64%Firms 1B Firms with staff in at least 2 of the 3 client service roles (Operations Associate, Operations Director/Manager, Chief Operating Officer) listed in the Compensation section of the RIA Benchmarking Studyfrom Charles Schwab.Past performance is not an indicator of future results. 2020 RIA Benchmarking Study from Charles Schwab, fielded January to early April 2020. Study contains self-reported data from 1,010 firms forthe main study and 761 firms for the compensation portion.2020 RIA Benchmarking Study from Charles Schwab19
Advisor ServicesNationalCompensationResults2020 RIA Benchmarking Study from Charles Schwab
1Other performance-based incentive pay includes compensation resulting from firm goals, department or team goals, and business development results.2020 RIA Benchmarking Study from Charles Schwab15
1Other performance-based incentive pay includes compensation resulting from firm goals, department or team goals, and business development results.2020 RIA Benchmarking Study from Charles Schwab22
1Other performance-based incentive pay includes compensation resulting from firm goals, department or team goals, and business development results.2020 RIA Benchmarking Study from Charles Schwab23
Advisor ServicesDefinitions2020 RIA Benchmarking Study from Charles Schwab
DefinitionsClient Account Management, Sales, and MarketingDirector of Client Service: Manages the client service activities for the entire firm or a specific business area. Coordinates client service activities with those of sales and marketing staff. Supervises client service staff. Tracks and reports results of key service measures against firm objectives. Leads resolution of problems related to client service. May manage relationships with key clients and prospects.Senior Client Account Manager/Relationship Manager: Fills the most experienced advisory position within the firm. Serves as primary manager of existing client relationships, particularly more complex relationships. Formulates and implements advice but may rely on technical specialists to develop recommendations within their area of expertise. Often works with, trains, and supervises other staff in client service delivery.Client Account Manager/Relationship Manager: Manages existing client relationships, working either with a principal or more experienced advisor or on their own. Provides client service management (often to small and midsize accounts). Assists senior professionals in conducting client meetings. Resolves basic and routine client account issues.Client Services Associate: Provides non-advice-related support to clients, including: Preparing standard client reports Maintaining contact with clients to provide or obtain updated information Scheduling client meetings Responding to administrative client queriesBusiness Development Professional: Develops new business, with relatively little responsibility (less than 10% of time) for managing relationships, providing advice, or serving clients.Marketing Professional: Implements marketing plans and programs, assists in developing new marketing and advertising campaigns, and develops strategic communicationsdeliverables.2020 RIA Benchmarking Study from Charles Schwab19
DefinitionsInvestmentsInvestment/Portfolio Manager: Actively manages a client portfolio using individual securities or a combination of securities and third-party managers. May participate in or lead development of an investment strategy. (Note that this position describes an active-style internal manager.)Financial Planner: Provides financial planning to the clients of the lead and service advisors. Serves as in-house expert on financial planning issues. Does not act as primary relationship manager.Research Analyst: Performs research and analysis and/or manages investment options. Provides information and makes recommendations to professional staff on managers, advisory service products, investment selection, suitabilityguidelines, and reporting.Paraplanner: Provides technical support to the Client Account Manager/Relationship Manager roles in the delivery of advice to clients. Responsibilities include data gathering, modeling, case design, plan development, presentation development, etc. May participate in client meetings, but not in an advice capacity. Has no decision-making authority on client matters.Portfolio Administrator: Sets up and maintains client accounts. Compiles and completes client, custodian, and firm paperwork. Reviews and maintains client transactions and activity. Executes client and firm tasks, such as asset transfers, preparation of reports, and general support of portfolio and investment strategies.Trader: Buys and sells securities as directed by the portfolio managers, advisors, or CIO.2020 RIA Benchmarking Study from Charles Schwab26
DefinitionsOperations and AdministrationOperations Director/Manager: Manages daily activities within the operations department (e.g., trading and reporting) and serves as an intermediary between the department andexecutive management. Typically supervises operations staff, and may be responsible for establishing or contributing ideas for department processes, procedures, and protocols.Operations Associate: Performs daily activities within the operations department. May provide network administration/IT support to staff.Compliance Associate: Assists in implementing the firm’s compliance program, under the direction of the designated Chief Compliance Officer.Office Manager/Administrator: Responsible for general office operations, such as internal accounting, office equipment and supplies, benefits administration, and payroll coordination. May also coordinate firm website or other marketing tools. (Note: This can be a catchall role in firms that do not employ multiple staff members for eachof these functions.)Internal Accountant/Bookkeeper: Performs internal accounting, and generates the firm’s financial statements.Human Resources Professional: Handles employee relations, payroll and benefits, and training. May direct and coordinate administrative functions of an organization.Technology Professional: Generally provides service related to software, hardware, databases, Web resources, network, and enterprise systems. Duties can include networkmanagement, software development, and database administration.Executive Assistant: Handles a variety of administrative functions to aid a dedicated manager of the firm. May perform secretarial and clerical duties as needed by the dedicated manager.Receptionist: Greets and directs clients and other visitors. Screens and routes telephone calls. May perform incidental typing or other routine clerical duties.2020 RIA Benchmarking Study from Charles Schwab27
Advisor ServicesMethodology& Disclosures2020 RIA Benchmarking Study from Charles Schwab
Methodology and disclosuresSchwab designed the RIA Benchmarking Study to capture insights in the RIA industry based on study responses from individual firms. The 2020 study providesinformation on such topics as asset and revenue growth, sources of new clients, products and pricing, staffing, compensation, client experience, technology, andfinancial performance. Fielded from January to early April 2020, the study contains self-reported data from 1,010 firms that custody their assets with SchwabAdvisor ServicesTM and represent 1.1 trillion in AUM, making this the leading study in the RIA industry. This self-reported information was not independentlyverified. Since the inception of the study in 2006, more than 3,700 firms have participated, with many repeat participants. Participant firms represent various sizesand business models. They are categorized into 12 peer groups—7 wealth manager groups and 5 money manager groups—by AUM size. Unless otherwise noted,study results are for all firms with 250 million or more in AUM, representing the vast majority of total assets managed by this year’s participants.Compensation data represents all firms that participated in the compensation portion of the 2020 RIA Benchmarking Study from Charles Schwab and containsself-reported data from 761 firms on nearly 10,000 total employee responses. The self-reported information provided by individual advisory firms was notindependently verified.Base salary represents a 40-hour work week. Where study responses specify work of less than 40 hours, base salary has been grossed up to reflect theequivalent salary of a 40-hour work week.Any responses with total cash compensation (including owner profit distributions) below 20,000 are not included in the calculations.Throughout the report, median values are provided, unless otherwise noted, to provide the best indicator of a “typical” firm.This report was produced by Charles Schwab & Co., Inc., and is intended for independent investment advisory firms. The report is intended for generalinformational purposes only, and is not intended to provide financial, investment, regulatory, compliance, legal, or tax advice. Any guidance taken from the reportis not tailored to the particular circumstances of any reader of the report or their firm. The report relies, in part, on information provided to Schwab by the advisoryfirms named and others that participated in Schwab’s research and interviews. Schwab did not independently verify that information, and Schwab makes norepresentations about the accuracy of the information in the report. In addition, the experience and practices discussed in the report may not be representative ofother firms or the experience or results you might obtain.This report is not intended for use by investors in evaluating or selecting an investment advisor or otherwise. This report is not a recommendation or endorsementof, referral to, or solicitation on behalf of any investment advisor, whether or not named, quoted, or described in the report. Investment advisory firms areindependent of and not affiliated with Schwab, and their employees and agents, including individuals named in the report, are not employees, agents, orrepresentatives of Schwab.Schwab Advisor Services serves independent investment advisors and includes the custody, trading, and support services of Schwab. Independent investmentadvisors are not owned by, affiliated with, or supervised by Schwab. 2021 Charles Schwab & Co., Inc. (Schwab). All rights reserved. Member SIPC (www.sipc.org).0221-1H6M2020 RIA Benchmarking Study from Charles Schwab23
Compensation tied to revenue generation from new and existing clients can help ensure staff are aligned with the firm's growth objectives. 2020 RIA Benchmarking Study from Charles Schwab. 11. Percent of reported roles that tie compensation to revenue generation includes only those firms that tie compensation to reve nue generation.