Transcription
The RIA Tipping Point:Corporate or IndependentFor more pasg.com 2013 NFP Advisor Services Group. All rights reserved. Reproduction of this report by any means is strictly prohibited.
The RIA Tipping Point: Corporate or IndependentApril 2013TABLE OF CONTENTSIMPACT POINTS . 4INTRODUCTION . 6METHODOLOGY . 6COMPARING CORPORATE AND INDEPENDENT RIA SEGMENTS . 7PRACTICE OVERVIEW . 7PRACTICE COMPOSITION . 11REASONS FOR CHOOSING AN RIA SETUP . 12ECONOMIC PROPOSITION. 13COMPLIANCE RESPONSIBILITY . 17CHOOSING THE RIGHT RIA SETUP . 23THE CORPORATE RIA SETUP. 24FOR MAXIMIZING THE PRACTICE'S ECONOMIC PROPOSITION . 24FOR OPTIMIZING TECHNOLOGY SUPPORT . 25FOR MINIMIZING THE OPERATIONS BURDEN . 26FOR MINIMIZING RISKS DUE TO REGULATIONS . 26THE INDEPENDENT RIA SETUP . 26FOR MAINTAINING FULL INDEPENDENCE AS A FINANCIAL ADVISOR . 27EITHER SETUP . 27FOR MAXIMIZING THE TIME AVAILABLE FOR CLIENT ACQUISITION AND PROSPECTING . 27SUMMARY OF DECISION POINTS . 28CONCLUSION . 29RELATED RESEARCH . 30NFP ADVISOR SERVICES GROUP WHITE PAPERS. 30AITE GROUP RESEARCH . 30ABOUT AITE GROUP. 31LIST OF FIGURESFIGURE 1: DOMINANT REVENUE TYPE BY RIA SEGMENT . 7FIGURE 2: PRACTICE OWNERSHIP . 8FIGURE 3: BOOK SIZE . 9FIGURE 4: PRODUCTION/REVENUE . 10FIGURE 5: NUMBER OF PRACTICE MEMBERS . 11FIGURE 6: ADVISOR’S PREFERRED SETUP . 13 2013 NFP Advisor Services Group. All rights reserved. Reproduction of this report by any means is strictly prohibited.2
The RIA Tipping Point: Corporate or IndependentApril 2013FIGURE 7: REVENUE RETAINED BY FINANCIAL ADVISOR . 14FIGURE 8: FINANCIAL ADVISOR ANNUAL INCOME AT SMALL PRACTICES . 16FIGURE 9: ANNUAL INCOME OF FINANCIAL ADVISORS AT LARGE PRACTICES . 17FIGURE 10: COMPLIANCE RESPONSIBILITY . 18FIGURE 11: NUMBER OF COMPLIANCE SUPERVISORS AT PRACTICE . 19FIGURE 12: TIME SPENT ON COMPLIANCE-RELATED TASKS . 20FIGURE 13: CONFIDENCE LEVELS WITH CURRENT COMPLIANCE EFFORT AND DESIRED IMPROVEMENT . 21FIGURE 14: RECENT REGULATORY AUDITS . 21FIGURE 15: DESIRED COMPLIANCE SETUP. 22FIGURE 16: IAR SETUP PERCEPTIONS . 23FIGURE 17: INDEPENDENT RIA SETUP PERCEPTIONS . 24LIST OF TABLESTABLE A: PRACTICE CHARACTERISTICS BY BOOK SIZE . 15TABLE B: DECISION POINTS OVERVIEW . 28 2013 NFP Advisor Services Group. All rights reserved. Reproduction of this report by any means is strictly prohibited.3
The RIA Tipping Point: Corporate or IndependentApril 2013IMPACT POINTS Among corporate registered investment advisers (RIAs), hybrid advisors (thoseprimarily compensated through a mix of commissions and fees) outnumber fee-onlyadvisors by a 3:1 ratio. Among independent RIAs, nearly 60 percent are fee-onlyadvisors. While independent RIA practices tend to have larger books of business (measured byclient assets) and higher revenue production than corporate RIA practices, financialadvisors leveraging corporate RIA platforms have higher personal annual incomes. Across all independent and corporate RIAs, approximately half of all practicesgenerate less than 300,000 in revenue. Independence as a financial advisor is an "extremely important" or "very important”reason for around 60 percent of financial advisors when choosing an RIA setup.Advisors are looking to maintain control over decisions affecting their practice, havemore freedom with regard to their operating model and product mix, and be able torun their own business. Maintaining FINRA licenses and the ability to manage compliance risks are the toptwo reasons advisors leverage a corporate RIA structure. Keeping operational control within the practice is the next most important factorinfluencing advisors to choose the independent RIA model, second to maintainingindependence. In terms of economic proposition, 100 million in client assets appears to be themark at which lack of scale for an independent RIA has a negative impact on income.Below this asset mark, corporate and independent RIAs provide their equity-owningadvisors proportionally a very similar income. However, independent RIAs with abook of business ranging from 100 million to 200 million require, on average, a 27percent larger practice in terms of client assets to match the income of advisors atcorporate RIAs. For RIAs with more than 200 million in client assets, whethereconomic scale tips positively for the independent RIA depends on its expensestructure. A surprisingly high level of confidence exists across the board regarding complianceresponsibility at corporate and independent RIA practices, and the desiredcompliance setup is remarkably similar within each practice type. All advisors wouldprefer to increase their time allocated to compliance-related tasks by 10–15 percentto ensure full compliance. Corporate RIA-affiliated advisors see maintaining advisor independence as the onlyarea in which the independent RIA model is better positioned than the corporate 2013 NFP Advisor Services Group. All rights reserved. Reproduction of this report by any means is strictly prohibited.4
The RIA Tipping Point: Corporate or IndependentApril 2013RIA model to achieve goals germane to their practice operations. On all otheraspects, they indicate that corporate RIAs are better positioned. Advisors affiliated with independent RIAs see maintaining advisor independence astheir top advantage, followed by being a better economic proposition andmaximizing time with clients. On the other hand, independent RIA-affiliated advisorssee the corporate RIA model as more suited for minimizing compliance risk as wellas for optimizing the technology and operational aspects of their business. Among corporate and independent RIA-affiliated advisors, there is ambiguityregarding what "independence" means and how it impacts practices. Both corporate and independent RIA structures are viable for advisors, but allbusiness considerations, including expenses, business structure, personalpreference, appetite for risk and revenue opportunity, should be carefully weighedto determine the RIA tipping point for each individual advisor. 2013 NFP Advisor Services Group. All rights reserved. Reproduction of this report by any means is strictly prohibited.5
The RIA Tipping Point: Corporate or IndependentApril 2013INTRODUCTIONOne of the major challenges for RIAs in the United States is to find the best setup to operate theadvisory business that they would like to create and run. A key decision in this context ischoosing between starting or joining an independent RIA firm or leveraging the corporate RIA ofa broker/dealer. Many financial advisors lack a clear view of the benefits and disadvantages ofeach model.Published by NFP Advisor Services Group and produced by Aite Group, this white paper providesinsight into the independent RIA and corporate RIA models, describes the advisors who chooseeach of these setups, as well as their motivations to choose one over the other, and reveals theirfeedback on their choice. The goal is to provide financial advisors with a better understanding ofwhich setup might be better for their advisory business.M E T H O D O LO GYThe analysis in this report leverages an online January 2013 Aite Group survey of 221 financialadvisors. The data from practice owners has a six-point margin of error at the 95 percentconfidence level. The case studies are based on detailed interviews with financial advisorsoperating within a corporate RIA or independent RIA structure. 2013 NFP Advisor Services Group. All rights reserved. Reproduction of this report by any means is strictly prohibited.6
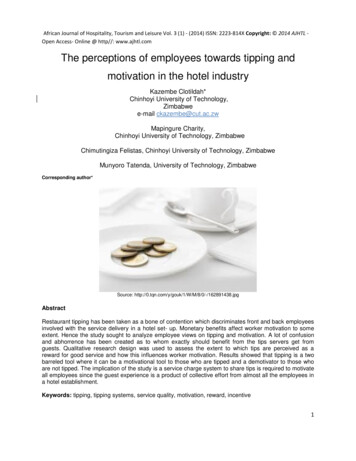
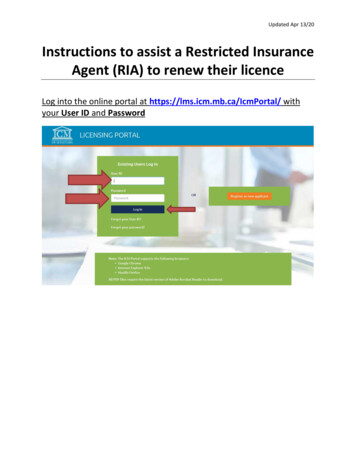
The RIA Tipping Point: Corporate or IndependentApril 2013COMPARING CORPORATE AND INDEPENDENT RIASEGMENTSP R AC T I C E OV E RV I E WInvestment advisor representatives (IARs) affiliated with a corporate RIA overwhelminglyindicate that a mix of fees and commissions (referred to as "hybrid" throughout this paper)constitutes their primary form of compensation. Seventy-five percent of those advisors rely onfees and commissions as opposed to 25 percent who earn their compensation primarily throughfees only. Conversely, a majority of advisors affiliated with an independent RIA are primarilycompensated through fees only, with roughly 60 percent of advisors indicating fees are theirprimary form of compensation (Figure 1).Figure 1: Dominant Revenue Type by RIA SegmentQ. What is your compensation primarily based on?(N 221)75%59%41%25%Corporate RIA (IAR)(n 146)Independent RIA(n 75)Fees from assets under management and/or advice servicesFees and commissionsSource: Q1 2013 Aite Group survey of 221 financial advisorsFor purposes of comparison throughout this paper, advisor respondents are segmented into twomain categories: those affiliated with a corporate RIA and those affiliated with an independentRIA. Within each category, respondents were further segmented into two subcategories by theirprimary form of compensation (fee-only and a mix of fees and commissions). Figure 2summarizes the roles played by advisors in the aforementioned segments. Within each segment,a majority of advisor respondents indicate that they have significant or complete ownership ofthe practice. 2013 NFP Advisor Services Group. All rights reserved. Reproduction of this report by any means is strictly prohibited.7
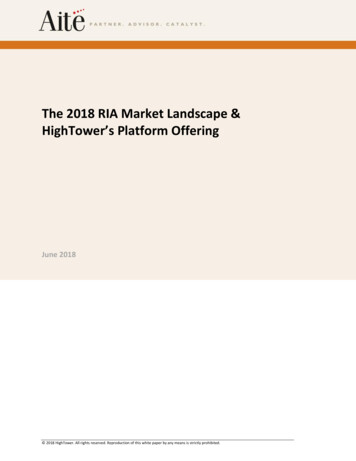
The RIA Tipping Point: Corporate or IndependentApril 2013Figure 2: Practice OwnershipQ. What is your role in your practice?(N 203)74%71%67%58%42%33%29%26%Corporate RIA(fees and commissions)(n 103)Corporate RIA(fee only)(n 33)Independent RIA(fees and commissions)(n 26)Independent RIA(fee only)(n 41)Financial advisor owning all or part of the practiceFinancial advisor without significant ownership of practiceSource: Q1 2013 Aite Group survey of 221 financial advisorsA comparison of the distribution of client assets by practice size reveals that within corporateRIAs and independent RIAs, fee-only practices have a larger average practice size than hybridpractices within the same segment, respectively. Forty-four percent of fee-only corporate andindependent RIA practices have at least 100 million in client assets (Figure 3), with the meanbook size of independent RIAs being a third higher than the mean book size of corporate RIApractices. 2013 NFP Advisor Services Group. All rights reserved. Reproduction of this report by any means is strictly prohibited.8
The RIA Tipping Point: Corporate or IndependentApril 2013Figure 3: Book SizeQ. What is the approximate amount of client assets within your practice(i.e., the book of business)?(N 206)Mean(in millions)Corporate RIA(fees and commissions)(n 103)Corporate RIA(fee only)(n 34)30%32%27%32%24%Independent RIA(fees and commissions)(n 26)38%Independent RIA(fee only)(n 43)40%9%35%35%16%6%19%26%14% 5% 30 million 30 million to 99 million 100 million to 299 million 300 million to 1 billion 167 335 279 448 1 billionSource: Q1 2013 Aite Group survey of 221 financial advisorsThe mean revenue production across the four segments is similar to the distribution of clientassets by practice size in that within corporate and independent RIAs respectively, fee-onlypractices generate more revenue on average than do practices that rely on a mix of fees andcommissions as their primary form of compensation. In all segments, 35–40 percent of practicesgenerate less than 300,000 in revenue (Figure 4). 2013 NFP Advisor Services Group. All rights reserved. Reproduction of this report by any means is strictly prohibited.9
The RIA Tipping Point: Corporate or IndependentApril 2013Figure 4: Production/RevenueQ. How much revenue did your practice generate over the last 12 months?(N 206)Corporate RIA(fees and commissions)(n 103)Corporate RIA(fee only)(n 34)Independent RIA(fees and commissions)(n 26)Independent RIA(fee only)(n 43)Mean(in thousands)13%14% 8%21%23%21% 90521%24%21% 1,2499% 9%18%15%12% 8%19%19%9%21%31%23%15%28% 669 1,283 100,000 100,000 to 199,999 200,000 to 299,999 300,000 to 499,999 500,000 to 1 million 1 millionSource: Q1 2013 Aite Group survey of 221 financial advisors 2013 NFP Advisor Services Group. All rights reserved. Reproduction of this report by any means is strictly prohibited.10
The RIA Tipping Point: Corporate or IndependentApril 2013P R AC T I C E C O M PO S IT I O NSolo practices as defined in this paper include only one client-facing advisor. Of those, around 30percent consist of only one person, the advisor, while the remaining solo practices aresupported by additional team members (Figure 5). Advisor practices on corporate RIA platformshave an average of 4.9 team members, while independent RIA practices have an average of 5.5people within their practice.Figure 5: Number of Practice MembersQ. How many people, including you, employees and independentcontractors, work at your practice?(N 206)Corporate RIA(n 137)25%Independent RIA(n 69)39%29%128%2 or 323%25%4 to 1014%19%Average4.95.5 10Source: Q1 2013 Aite Group survey of 221 financial advisors 2013 NFP Advisor Services Group. All rights reserved. Reproduction of this report by any means is strictly prohibited.11
The RIA Tipping Point: Corporate or IndependentApril 2013REASONS FOR CHOOSING AN RIA SETUPAdvisors were asked to indicate the importance assigned to various factors that influenced thedecision for their current affiliation or setup, whether with a corporate RIA or an independentRIA. Figure 6 displays the factors that are deemed "very important" or "extremely important" byadvisors in influencing their decision.For advisors affiliated with a corporate RIA, there is no single reason that stands out with regardto the motivation to align with a corporate RIA; a whole range of reasons equally influenced thatdecision. However, the ability to maintain brokerage licenses and the ability to managecompliance risks are deemed "extremely important" or "very important" reasons for 60 percentof advisors on corporate RIA platforms.The rationale for advisors affiliated with an independent RIA to choose this setup is muchclearer. Maintaining independence as an advisor is the only reason considered "extremelyimportant" or "very important" by a majority of advisors in this category (63 percent). Keepingoperations control within the practice is a distant second and is an important reason forchoosing the independent RIA route for 40 percent of advisors in this category.It is interesting to note that independence as a financial advisor is an "extremely important" or"very important" reason not only for 63 percent of independent RIAs to choose this setup, butalso for 57 percent of advisors on corporate RIA platforms. Clearly, both groups of advisors feelvery strongly about being independent. In this context, advisors state that they are looking tomaintain control over decisions affecting their practice, have more freedom with regard to theiroperating model and product mix, and be able to run their own business.The ability to maximize the economic proposition for the practice is another importantmotivation for both advisor groups when choosing an RIA setup. Fifty-seven percent ofcorporate RIA-affiliated advisors indicate that the ability to maximize the economic propositionfor their practice was either a "very important" or "extremely important" factor in choosing theircurrent setup, compared to 37 percent of independent RIA-affiliated advisors. 2013 NFP Advisor Services Group. All rights reserved. Reproduction of this report by any means is strictly prohibited.12
The RIA Tipping Point: Corporate or IndependentApril 2013Figure 6: Advisor’s Preferred SetupIARs considered the following whendeciding on their RIA setup.(N 92)Ability to maintain securitylicenses (FINRA)30%Ability to manage compliancerelated risks26%Maintain independence as afinancial advisor24%Maximize economicproposition for
While independent RIA practices tend to have larger books of business (measured by client assets) and higher revenue production than corporate RIA practices, financial advisors leveraging corporate RIA platforms have higher personal annual incomes. Across all independen