Transcription
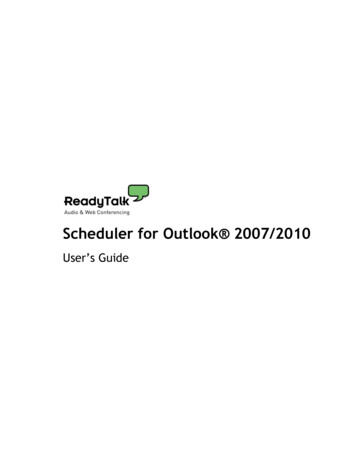
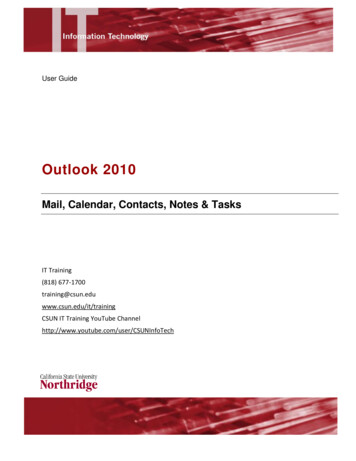
Fourth Quarter 2021Chartwell Strategies Current Outlook and Investment Strategy“Diligence is the Mother of Good Fortune”-Miguel de Cervantes,17th century Spanish novelistBackgroundSummaryThe year finished with a strongfourth quarter with all majoraverages registering double digitgains.The Chartwell composites alsoenjoyed a strong fourth quarter,with gains that matched, orexceeded the performance oftheir reference indices.Inflation looms as the majorhurdle to further gains in 2022.The FRB, no longer callinginflation transitory, expects tobegin raising interest rates andshrinking its balance sheet thisyear.Some popular stocks appearto be overvalued and vulnerableto increases in interest rates.Significant changes in stockallocation and selection may berequired as the struggle betweenthe FRB and fiscal policy unfolds.The equity markets finished the year on a strong note; in the fourth quarter of2021, the Dow Jones Industrial Average (DJIA), Standard & Poor’s 500 (S&P 500),NASDAQ and Russell 2000 advanced 7.87 percent, 11.02 percent, 8.47 percent,and 2.12 percent, respectively, on total return bases. Despite the appearance ofthe Omicron variant, investors’ hopes were buoyed by the prospect of highercorporate earnings in 2022.Stock market averages also did well for the twelve-month period, registeringimpressive double digit percentage gains. The DJIA, S&P 500, NASDAQ andRussell 2000 rose 20.95 percent, 28.68 percent, 22.21 percent, and 14.78 percent,respectively.In recent years, investors have bid certain glamour stocks to unusually highvaluations. At year-end, the S&P 500 reflected this by selling at a price-toearnings ratio (p/e) of 25.4 (after January’s decline in stock prices, the p/eis 23.7) when a range of 15 to 20 times earnings is more typical. This is nota new phenomenon; fifteen years ago, housing related stocks were bid tounreasonably high prices and valuations of high technology stocks reachedridiculous valuations in the late 1990s. In the past few years, low interest rateshave encouraged investors to avoid fixed income securities and invest in stocks.This process has resulted in a familiar group of popular stocks, shown in Table 1,that to many investors, now seem to be overvalued. The six stocks shown belowcomprise 24 percent of the S&P 500’s total market capitalization based on thelast twelve months of reported earnings and their prices on January 27th, aftera month of downward volatility.STOCKS&P WEIGHTINGP R I C E1.31.22P/EAPPLE7.07% 17328.7MICROSOFT6.17% 30835.4AMAZON3.34% 2,98058.4ALPHABET CLASS A2.14% 2,69624.8ALPHABET CLASS C1.99% 2,70224.8META PLATFORMS(FACEBOOK)1.90% 31022.2TESLA1.83% 933191TABLE 1. WEIGHTING AND VALUATION FOR THE TOP SIX COMPANIES IN THE S&P 500 INDEXSOURCE: BLOOMBERG
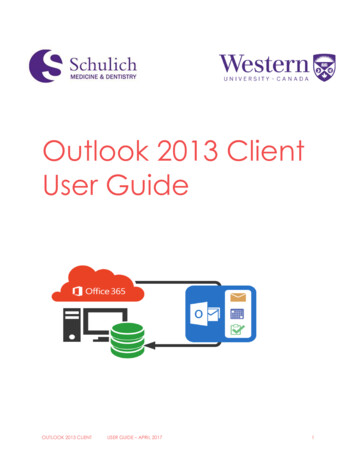
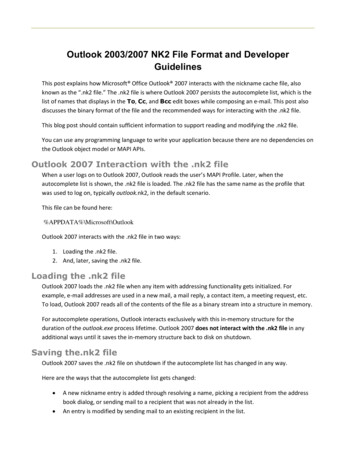
Fourth Quarter 2021Chartwell Strategies Current Outlook and Investment StrategyWhat has changed in January of this year is the increased concern of the Federal Reserve Board (FRB) overinflation. For many months, the FRB has stated that they believed inflation to be a “transitory” phenomenon thatis likely to return to normal as the economy returns to its pre-pandemic level. Clearly, this has not been the case;this past January, the Government reported that, in December, prices increased 5.5 percent over the previousDecember. Inflation is now embedded in basic commodities such as aluminum, copper and lumber, energyprices, the price of most meats and other food products. Moreover, due to the labor shortage, wages have alsobeen spiraling higher as employers compete for workers.YIELD ON THE TEN YEAR TREASURY BOND1.1.17-1.31.22Figure 1. THE YIELD ON THE TEN YEAR TREASURY APPEARS POISED TO RISESource: BLOOMBERGAs early as last December, the financial markets began to give the FRB their opinion on inflation as bond pricesdropped and the yield on the ten-year Treasury bond rose from 1.34 percent to 1.80 percent, 46 basis points(bp)*, as of today’s writing. Figure 1. Illustrates this move in the ten-year Treasury bond which breached animportant resistance level of 1.70 percent. This past week FRB chairman, Jerome Powell, stated that the Boardhas reassessed its position on inflation and no longer considers it to be transitory. In 2022, investors can expectthe FRB to begin raising rates and sharply reducing its bond purchases, thus shrinking its balance sheet.Meanwhile, Congress passed two bills in 2021 which total close to four trillion dollars ( 4,000,000,000,000).The first bill, the American Rescue Plan, a 1.9 trillion bill passed last March, is undoubtedly a primary factor inthe inflationary pressure that consumers have been experiencing. The second piece of legislation is a bipartisanbill that is referred to as an infrastructure bill, but only one-third of this 1.2 trillion bill can be categorized asinfrastructure. This bill became law in August and its full impact on the economy has not yet been felt. However,we believe, as funding from the passage of this bill enters the economy, the struggle against inflation could beexacerbated.Meanwhile, the Administration’s “Build Back Better” bill, which amounts to an expenditure of five trillion dollarsover a ten-year period, passed in the House of Representatives, but, failed to pass in the Senate. President Bidenhas announced his intention to have Congress pass pieces of this legislation in the months to come.In our opinion, clearly, fiscal policy and the FRB’s strategies to reduce inflation and maintain full employment areon a collision course. At risk is the low interest rate environment that the stock market has enjoyed since 2012when the yield on the ten-year Treasury bond fell below three percent and has remained so, over most of the pastten years. Also at risk is the bull market that began at the peak of the pandemic induced hysteria in March 2020.It is difficult to determine how many times the FRB will need to raise interest rates in order to keep inflation atan acceptable level, or, if the result will terminate the bull market this year. However, the volatility that has beenwitnessed in January and the weakness in previously invulnerable, high p/e stocks, may possibly continue in themonths to follow.*The definition of a basis point is one hundredth of one percent.2
Fourth Quarter 2021Chartwell Strategies Current Outlook and Investment StrategyCurrent StrategyAfter a lackluster Q3, the economy roared back in Q4, with GDP estimated to have expanded by 6.9%(Atlanta Fed “GDPNow” estimate); and this was even as supply chain disruptions continued and the Deltavariant of COVID was overtaken by the Omicron variant. The Chartwell Growth Composite’s* performance, 7.18% exceeded the Russell 2000 Value’s return of 4.36% and was only modestly short of the RussellMidcap Value return of 8.54%. The Chartwell Balanced Composite was up 4.88%, well ahead of thebenchmark’s return of 2.75%. Finally, our Dividend Equity Composite ( 9.30%) was nicely ahead of thebenchmark, the Russell 1000 Value ( 7.77%).For the full year 2021, the Chartwell Growth Composite rose 30.12%, ahead of both the Russell 2000Value, up 28.27%, and the Russell MidCap Value Index, up 28.34%. The Chartwell Balanced Composite,up 20.63%, exceeded the return of the benchmark’s 16.51% gain. Our Dividend Equity Composite gained23.13%, modestly short of the Russell 1000 Value’s 25.16%.The three best performers for Q4 in the Growth and Balanced accounts were: Micron Technology** (MU,3.8%), up 31.4%; Vonage (VG, 4.0%), up 29.0%; and CF Industries (CF, 1.9%), up 27.4%. MU, a leader incomputer memory chips (DRAMS), rose, in part, because it had done poorly in the prior quarter; moreimportant was that they had a good earnings quarter, pointing to positive demand trends and callingfor record revenues in fiscal 2022. Vonage stock jumped on the news of a take-over by Swedish telecomgiant Ericsson (this makes 2 take-outs in a row for the portfolio; last quarter was Hill-Rom). CF’s businessfundamentals continue to strengthen materially. Nitrogen fertilizer is in short supply due to capacitylosses in Europe, so forward pricing has firmed by 30-40%. The three worst performers in the Growth andBalanced accounts were: Bloomin’ Brands (BLMN 2.1%), down 16.1%; Landec Corp. (LNDC, 0%), down 13.8%;and Fresh Del Monte Produce (FDP, 0%), down 7.8%. Casual-dining company Bloomin’ had a reasonablygood quarterly report, but their Q4 revenue guidance was 8% below consensus, as they are choosing tonot chase marginally profitable (or unprofitable) revenues. Landec, sold during the quarter, continued tostruggle with their fresh-salad business (which they announced the sale of, after our exit from the stock).Fresh Del Monte (also sold) was down after another disappointing quarter, and we felt that our originalinvestment thesis was no longer valid.In the Dividend Equity accounts, the three best performers in Q4 were: Broadcom (AVGO, 2.7%), up38%; Seagate Technology (STX, 2.4%), up 37.8%; and CF Industries (CF, 1.9%), up 27.4%. Software/semiconductor maker Broadcom had an investor day in addition to their earnings report; they reporteda continuing recovery in networking and storage products, and they raised guidance for earnings anddividend payouts. Similarly, Seagate Tech’s storage business is seeing very healthy demand, with revenueup 35% in the September quarter. CF is covered above (held in Growth/Balanced and Dividend accounts).The three worst-performing stocks in the Dividend Equity accounts were: Citigroup (C, 1.9%), down 13.3%;AT&T (T, 2.4%), down 7.2%; and Ally Financial (ALLY, 1.9%), down 6.3%. Citi had a mixed earnings report,and the market focused on their guidance for higher costs, even as Wall Street analysts raised future EPSestimates. AT&T had robust wireless subscriber trends, but the market is taking a wait-and-see approachto their shedding of media assets (DIRECTV and Warner Media). We like their “return” to being a corecommunications business. Consumer finance company Ally Financial was down on investors’ cautiousview of their acquisition of Fair Square Financial; some thought that buying back their own stock wouldhave been a better use of capital.We executed several trades in the quarter in the Growth & Balanced accounts. Purchases included Corning,Inc. (GLW, 1.5%); we have owned this stock in the past. They are a producer of specialty glass, primarilyfor computers and TVs. We took advantage of recent weakness in the TV market to establish a position.Flowers Foods (FLO, 2.3%) makes and distributes several well-known bakery brands (Wonder and “Dave’sKiller” bread, Tastykakes). We are impressed with the new management team and think this may be agood defensive holding. Also in the food area, Hain Celestial was purchased (HAIN, 2.2%); their specialty isorganic and natural products. Hain has good growth prospects paired with a reasonable valuation. ApolloGlobal Management (APO, 2.0%) is an alternative asset manager; they have an industry-leading positionin “fixed income replacement,” with life insurers as a key end market.*The numbers in parentheses following each company mentionedreflect the percentage of the portfolio’s net assets comprised of suchsecurities as of 12/31/2021. Holdings are subject to change. A fulllisting of portfolio holdings is available upon request.**All composites reflect net-of-fee returns.3
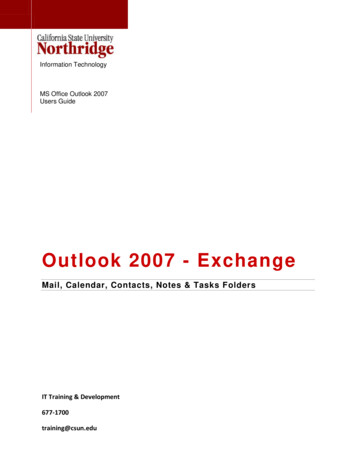
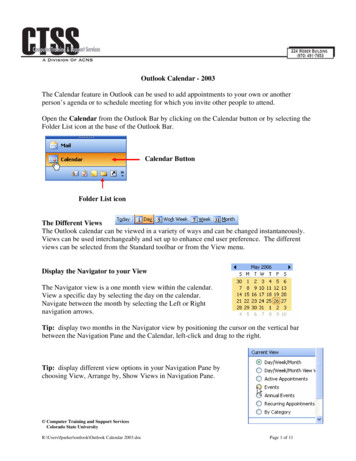
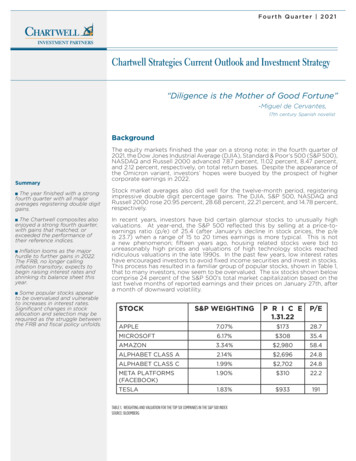
Fourth Quarter 2021Chartwell Strategies Current Outlook and Investment StrategyFinally, Healthpeak Properties (PEAK, 2.3%) is a REIT, specializing in Life Science and medical officebuildings. Other sales included Methode Electronics (MEI); the stock was at the high end of our priceexpectations, and we wanted to consolidate our holdings in Technology. Hill-Rom Holdings (HRC) was fullyexited in conjunction with its takeover by Baxter International (HRC was up 60% for the full year). The twopurchases mentioned above in the food industry were partly done in combination with our exit of FreshDel Monte Produce (FDP) and Landec Corp. (LNDC), covered above in the performance section. After avery strong almost-2-year run post the pandemic, we sold Winnebago (WGO); it had gone from a low of 20.5 to almost 75.Trades in the Dividend Equity accounts were relatively light. Hanesbrands (HBI, 2.6%) was added to onweakness in the stock; we remain confident in the direction of the company, and we think the stock isvery undervalued, trading at about 9x 2022 EPS estimates. Corning (GLW, 1.8%) is covered above – alsopurchased in Growth & Balanced accounts. A new purchase was IBM Corp. (IBM, 2.0%). This has been acontroversial stock for some time, as their revenue growth has been meager (if growing at all) for thelast several years. After their purchase of Red Hat and the naming of a new CEO, we think the company’sprospects have brightened and they can return to a reasonable growth trajectory. And we believe twoother things are in our favor: very low expectations as reflected by a PE of 12.3x (on ’22 EPS expectations),and a 4.9% dividend yield as of this writing. On the sell side, all the trades were trims (not eliminations) ofcurrent positions after strong near-term moves in the stocks: CF Industries, Intel (INTC, 1.7%), and SeagateTech.The resurgence of value stocks relative to growth stocks (within the pond we fish from – medium andsmall-cap companies) has been a long time coming, and it worked in a big way in 2021 (Russell MidcapValue 28.3% vs. Russell Midcap Growth 12.7%). We think it still has plenty of runway, given the largevaluation differential that favors value, as well as the tailwind that should be provided from continuingeconomic strength. Within our equity portfolios, we are cutting back on some positions that have hadoutsized returns since the pandemic low (Winnebago, covered above, is an example).Additionally, we are bringing down the degree of “overweight” that we have had to the ConsumerDiscretionary sector, as comparisons to ’21 earnings results will be difficult this year (in the absence ofsimilar government stimulus). As discussed in the Background section, we presume the most importantevents for the market in ’22 are likely to be the trajectory of inflation and the pace and degree of Fedtightening – either could lead to some re-positioning of your portfolio.Long-term PerformanceFor the past twenty-two years we have been rigorously tracking the performance of our Growth andBalanced composites and comparing them with relevant indices on a total return basis, after expenses.Figure 2 on the next page illustrates the results of this ongoing exercise.Markets tend to vacillate from one year to the next, in terms of the investment style that it favors makingit difficult, if not impossible, to reign supreme each year. However, Figure 2 illustrates the power of a longterm, value-oriented investment strategy. Ten-thousand dollars invested in our all-equity composite hasnow grown to 72,311 over this twenty-two-year period ended 12/31/21, as compared to 62,525 for itsreference index, the Russell 2000.Similarly, our balanced accounts have also performed well. Ten-thousand dollars invested in our balancedcomposite has now grown to 61,904 as compared to 52,320 for its reference index.Results are also shown for the S&P 500 Index, which includes stock dividends, but has no expenses. Its long-term performance has underperformed both our growth and balanced strategies. John Bogle, founder ofVanguard, strongly believed that investors were better off investing in stock market indicies, such as theS&P 500, rather than buying individual stocks. By sticking to a sensible value-oriented approach, we arepleased to have been able to outperform the averages over the past twenty-two years.4
Chartwell Strategies Current Outlook and Investment StrategyComparison of the Change in Value of 10,000 Invested in Chartwell Growth and BalancedStrategy Account Composites12.31.99-12.31.2175 72,311Chartwell Growth CompositeChartwell Balanced CompositeRussell 2000 Value IndexDividend Value CompositeRussell 1000 ValueBalanced Benchmark*S&P 500 Index50 62,525 61,904 52,320 52,081 49,399 47,675*25 10,00001999 2000 2001 2002 2003 2004 2005 20062007200820092010201120122013201420152016 201720182019 2020 2021Figure 2. Source: Chartwell Investment PartnersAll data is as of 12/31/2021.*The Dividend Value composite incepted on 07/01/2002.**Effective 03/31/2020, the Russell 2000 Index (Growth Benchmark) changed to the Russell 2000 Value Index, which more closely aligns with the strategy’s investments.Performance results for the Chartwell Growth and Chartwell Balanced strategies include performance results obtained by TKG prior to being acquired by Chartwell in April 2016.***Growth Benchmark is Russell 2000 Value Index. Balanced Benchmark is 62.5% Russell 2000 Value, 37.5% Citigroup Broad Investment Grade Index. Prior to 4/1/20,the equity index was Russell 2000. The Russell 2000 Value Index refers to acomposite of small cap companies located in the United States that also exhibit a value probability. The Russell 2000 Value Index is a subset of the securities found in the Russell 2000 Index.The S&P 500 measures the performance of market capitalizations of 500 large companies having common stock listed on the NYSE or NASDAQ.The Russell 1000 Value Index represents approximately 1,000 of the largest companies in the U.S. equity market.Chartwell NewsWe hope everyone had a healthy and happy holidays! As we start 2022, we wish everyone the best for the comingyear. As previously mentioned, on October 20, 2021 it was announced that the parent company of ChartwellInvestment Partners, TriState Capital Holdings (NASDAQ: TSC), has agreed to be acquired by Raymond JamesFinancial, Inc. (NYSE: RJF), a leading diversified financial services company, headquartered in St. Petersburg, FL.We anticipate the deal to close in the 2nd quarter of 2022. Upon the close, Chartwell will continue to operateindependently, as an affiliate of Carillon Tower Advisers, the 77 billion asset management subsidiary of RaymondJames. There will be no changes to your account management. Your account(s) will not change custodians,investment, or client service personnel. This transaction will be seamless for our clients. However, if you still havequestions on the transaction or your account, or want to discuss changes in your investment objective, pleasedon’t hesitate to call Mike Magee (610.407.4867) or Pete Schofield (610.407.4858).Past performance is no guarantee of future performance. Investment involves a risk of loss.This commentary is for informational purposes only. It is not an offer to buy or sell any security and should not be construed as investment advice. The views in this report were those of the Adviser at the time of writing this report and may not reflect our viewson the date this report is first published or anytime thereafter.*The Chartwell Growth Strategy Composite includes all fully discretionary, fee-paying equity accounts with a growth objective whose asset size is 300,000 or greater at the beginning of the measurement period. For individualbond holdings the fee is 5/8 of 1% and for bond mutual funds, including exchange traded funds, the fee is 3/8 of 1%. The fee for these accounts is negotiable.*The Chartwell Balanced Strategy Composite includes all fully discretionary, fee-paying accounts with a balance between growth and income as a principal objective whose asset size is 300,000 or greater at the beginning of the measurement period. For individualbond holdings the fee is 5/8 of 1% and for bond mutual funds, including exchange traded funds, the fee is 3/8 of 1%. The fee for these accounts is negotiable.The composites do not include accounts where total cash flows exceed 10% of the account’s value during any quarterly period or accounts holding securities purchased by anyone other than the Advisor. No accounts using leverage or short positions are included inthe composites. An individual client’s account may have performed better or worse than the composites’ returns presented above. The composites contain taxable and non-taxable accounts. The returns are before taxes and net of all advisory fees and commissioncharges. The net performance results for each composite are presented after deducting the actual fee charged to each account in the composite based on the management fee schedule in the Firm’s Brochure or the fee negotiated between the account holder andChartwell. Returns include the reinvestment of dividends and interest (total return). Returns for other Chartwell composites are available upon request.As of 12/31/2021 Chartwell managed 11.8 billion in assets, 11.02 billion as advisor and 827 million as sub-advisor. During the most recent quarter, the Chartwell Growth Strategy Composite consisted of 8 accounts which represented 9.6% of total Chartwell StrategyIndividually Managed Accounts and 0.1% of total Chartwell assets. During the most recent quarter, the Chartwell Balanced Strategy Composite consisted of 15 accounts which represented 32.5% of total Chartwell Strategy Individually Managed Accounts and 0.3% oftotal Chartwell assets. The Chartwell Growth Dividend Strategy Composite consisted of 5 accounts which represent 3.3% of total Chartwell Strategy Individually Managed Accounts and less than 0.0% of total Chartwell assets.5
(Atlanta Fed "GDPNow" estimate); and this was even as supply chain disruptions continued and the Delta variant of COVID was overtaken by the Omicron variant. The Chartwell Growth Composite's* performance, 7.18% exceeded the Russell 2000 Value's return of 4.36% and was only modestly short of the Russell Midcap Value return of 8.54%.