Transcription
CORONAQUEENSCommercial District Needs AssessmentCOMMERCIAL DISTRICTNEEDS ASSESSMENTinpartnershipwithAsian Americans for EqualityMake the Road New YorkQueens Chamber of CommerceStreet Vendor Project
ABOUT CORONABackgroundThe Neighborhood 360 program was created by the NYCDepartment of Small BusinessServices to identify, develop andlaunch commercial revitalizationprojects in partnership withlocal stakeholders. Throughproactive planning and targetedinvestments, Neighborhood360 supports projects thatstrengthen and revitalize thestreets, small businesses, andcommunity-based organizationsthat anchor New York Cityneighborhoods.The Neighborhood 360 Commercial District NeedsAssessment (CDNA) highlightsa neighborhood’s existingbusiness landscape andconsumer characteristics.This CDNA features RooseveltAvenue, Junction Boulevard,National and 103rd streets,commercial corridors inCorona and was conductedin partnership with AsianAmericans for Equality, Makethe Road New York, the QueensChamber of Commerce, and theStreet Vendor Project betweenJanuary and June 2017.Key issues and opportunitiesidentified through thisassessment will help prioritizeSBS-supported localinvestments, and serve as aninformational and marketingresource for the neighborhood.In This ReportExisting conditions, businessdata, and qualitative depictionsof the neighborhood weregathered from more than 554surveys and various stakeholdermeetings with neighborhoodmerchants, street vendors,shoppers, workers, propertyowners, and residents.Jump to.Key Findings4–5Business Inventory6What Merchants Say7, 10-12What Street Vendors Say 8-9, 12What Shoppers Say12, 15Physical Environment13Business Outlook14-15Data Appendix16-192Corona is a growing and diverse neighborhood with a bustling small business community. It isbordered by Elmhurst to the west, Northern Boulevard to the north, the Long Island Expresswayto the south, and Flushing Meadows Corona Park to the east. The neighborhood is unique for itsmulti-ethnic culture and is home to immigrant families with roots from Latin America, Asia, andEurope. These diverse groups contribute to Corona’s sense of place and are reflected in thevariety of small business offerings.The development of Corona began in the late 1800s after the New York and Flushing Railroad beganservice to the area. Initially known as West Flushing, Corona adopted its current name when localreal estate developer Thomas Waite Howard suggested the name “Corona” because he consideredthe area to be the crown of Queens County. Today, Corona’s architecture is characterized by itsdistinct 20th century brick houses and buildings that rarely exceed six stories; low-rise commercialbuildings and one- and two-family homes are also common.Corona has been home to immigrants since the early 1900s. Italians were first to settle in the area,pioneering the development of numerous businesses along 108th Street and Roosevelt Avenue.Many long-standing Italian-American small businesses still operate today. Corona has also beenhome to a large African-American community, including the famous musician Louis Armstrong.In recent decades, neighborhood demographics have changed dramatically. Corona has becomehome to a new generation of immigrants originating from Latin America, particularly fromMexico, Ecuador, and the Dominican Republic. Riding the 7 train into Queens is an eye-openingexperience, with Queens’ vast diversity on display as the train rolls above Roosevelt Avenue,rattling over the neighborhoods of Corona and Jackson Heights. The elevated train, which hasthree stops located in the neighborhood, can bring residents and commuters to Times Square inless than 30 minutes when riding express, making the neighborhood highly accessible.Roosevelt Avenue, Junction Boulevard, and National Street serve as the main commercialcorridors for the local community. At night, Corona transforms into one of New York’s largestand most vibrant night markets, serving as a popular destination for social events and a hotspotfor shopping and dining. The commercial corridors are home to a variety of ethnic stores,restaurants, and street vendors that all contribute to Corona’s vibrant commercial landscape, asresidents gather to eat and catch up with merchants who they have come to know quite well overmany years.Neighborhood DemographicsSee more on page 17Corona is home to the largest Latin American immigrant community in Queens. More than 66%of residents within the Corona study area are foreign-born, compared to 48% in Queens and37% in New York City. While Corona has historically been home to various diverse immigrantcommunities, today its residents are 78% Hispanic or Latino and 15% Asian. The unemploymentrate in the neighborhood is relatively low at 5.6% and the median household income is 44,979,compared to 57,210 for Queens and 52,737 for New York City.Future OpportunitiesSee more on page 5Corona is located in close proximity to various institutional anchors and recreation areas thatcontribute to the vibrancy of the community at large, such as the Queens Zoo, Queens Museum,Flushing Meadows Corona Park (the largest park in Queens), and the New York Hall of Science.With strong transit connectivity provided by the 7 train, Corona has the potential to attract thelarge crowds that use the train to access Times Square. In addition to the collection of anchorinstitutions, there have been recent investments in public space.In 2017, a 5.6 million capital project broke ground on Corona Plaza that transformed the formertemporary pedestrian plaza into a permanent open space. According to the NYC Departmentof Transportation (DOT), plaza amenities include a performance space with built-in seating, newlighting, bike racks, additional planting, and permanent furniture.Leveraging these various community assets together with the large network of active merchantassociations can better position Corona to attract the businesses and consumers needed tosupport the growing economy.Neighborhood 360 Commercial District Needs Assessment
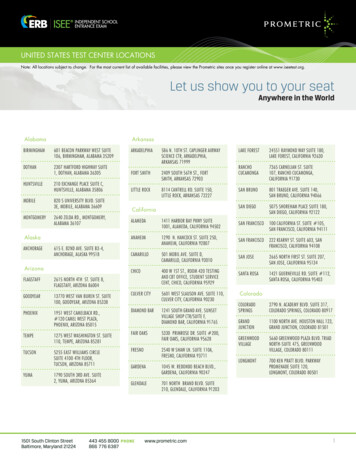
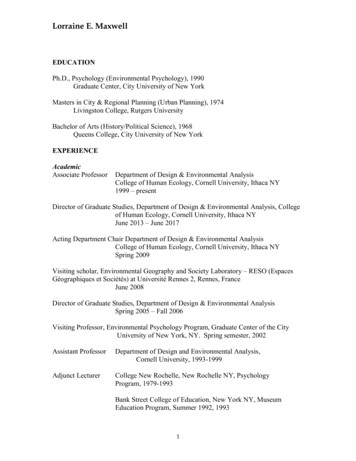
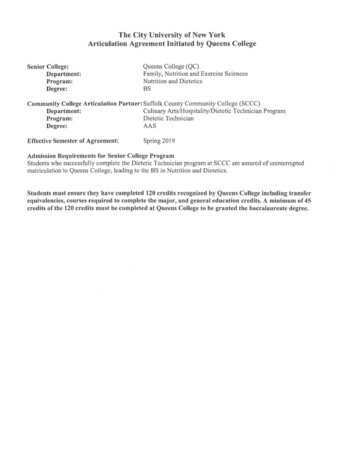
NEIGHBORHOOD CONTEXTCorona103 ST99 ST111 ST87 ST82 STCiti FieldDLouis ArmstrongHouse MuseumDOHMH CoronaIDNYC CenterV37 ASTST99STNALNATIOSTQueensMuseum4STAV1086New York Hallof ScienceAVUREYMHWHCORONA AVTRITNELElmhurstGreenmarketV50 AV43 A99 SMV45 A3QueensNight MarketST41 AVECoronaGreenmarket104TNSREMake the RoadNew York(MRNY)RWA2USTA Billie JeanKing National TennisCenterTLVDNBNYC BusinessSolutions Industrial andTransportationCenter - QueensS111IOCTJUN90 ST87 ST82 STELT AVROOSEVV39 AQueens Libraryat Corona7YV38 A103Queens Media Arts Development(QMAD)FlushingMeadows CoronaParkL PKWNTRA534 AV7D CEGRAN34 AVRN BLVNORTHEFlushingBayA BLVD1Langston HughesCommunity Library andCultural Center108 ST94 ST31 AVASTORIPoints of Interest0Queens Zoo0.10.20.4 MilesNotable PlacesAssessed Commercial CorridorsCommunity InstitutionsPublic FacilitiesBusiness Improvement DistrictNoteworthy SitesCommunity MarketsMerchant & Business Groups12Langston Hughes CommunityLibrary and Cultural CenterMake the Road New York34USTA Billie Jean King National Tennis CenterQueens Museum56Louis Armstrong House MuseumNew York Hall of Science82nd Street PartnershipAsian Americans for Equality (AAFE)Corona Business CorporationCorona Community Action Network (CAN)Lefrak City Merchants AssociationMake the Road New YorkQueens Chamber of CommerceQueens Economic Development CorporationCorona3
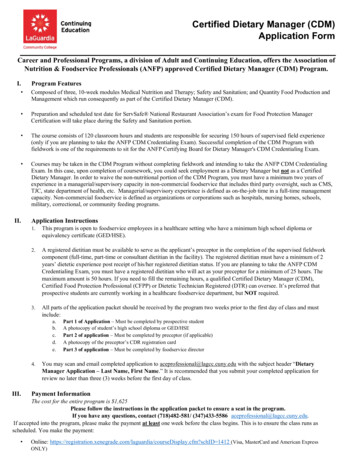
KEY FINDINGS & OPPORTUNITIESStrengthsHigh foot traffic throughout the day and night that supportspatronage of local small businessesDevoted consumer base that is committed toshopping locallyStrong access to transportation with more than 150,000daily riders on 10 MTA bus routes and one subway lineRelatively low vacancy rate (5%) and a diverse retail mixthat includes food, clothing, and medical servicesHome to affordable, community-serving businessesthat reflect the diverse and unique cultural identity ofthe neighborhoodYear-round community events organized by local residentsand community organizations celebrate the unique culturaldiversity of the neighborhoodHigh density of small businesses due to the entrepreneurialspirit of the communityClose proximity to major destinations such as theQueens Museum, Flushing Meadows Corona Park,LaGuardia Airport, and the USTA Billie Jean King NationalTennis CenterChallengesPoor perceptions of public safety, especially at nightLitter along main commercial corridors disrupts thepedestrian shopping experiencePublic spaces lack sufficient amenities to meetpeople’s needs for resting, sitting, eating, and havingsocial encounters4Merchants are skeptical to participate in governmentled initiativesFear of current Federal immigration policies has decreasedeconomic activityFlushing Meadows Corona ParkCorona: Hit the Brakes on DWI MuralThe Lemon Ice King of CoronaThe elevated train structure is poorly maintained anddiminishes the aesthetics of the corridorLeo’s LatticiniNeighborhood 360 Commercial District Needs Assessment
Roosevelt Avenue Commercial CorridorCasa AmericaFruits and Vegetables Vendor¡Oye Corona!OpportunitiesInstall a wayfinding system to guide foot traffic betweenkey points for consumers, residents, and tourists tolearn about businesses, points of interest, and other keycommunity destinationsIncrease the amount of light beneath the elevated train toaddress concerns about perceptions of safetyCoordinate with businesses and NYPD precincts toimprove safety along the corridorSupport business growth by hosting community eventsthat encourage visitors to patronize local businesses andraise awareness of Corona’s unique culture and diversityIncrease communication among merchants and promoteCity services to connect entrepreneurs to resourcesClean and maintain the sidewalks and public spaces alongthe commercial corridors to make them more inviting andappealing for residents and consumers alikeSupport existing community-based organizations toactively organize merchants, property owners, and otherstakeholders to address small business, sanitation, andstreetscape needsWork with public and private partners to educate streetvendors on food safetyActivate the space under the elevated train with innovativepublic art and installationsWhat’s Next?Recommendations can be used by community-based organizations toinform future programming and allocation of their resources.For more information on a range of grant programs SBS offers to helpcommunity-based organizations strengthen and revitalize commercialdistricts, visit: nyc.gov/neighborhoodsCorona5
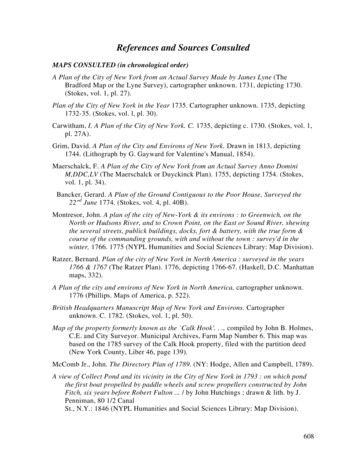
BUSINESS LANDSCAPEBusiness Inventory4.8%715Vacancy*Total Number of Businesses* Note: In 2017, New York City’s 73 Business Improvement Districts reported an average ground floorvacancy rate of 6.8% and median ground floor vacancy rate of 5.6% (SBS BIDs Trends Report, 2017).Storefront & Retail MixLIVE DATA CHART81Clothing & Shoe Stores75Full Service Restaurants & Bars70Barbershops, Spas, Beauty Salons, & Supply Stores66Medical ServicesProfessional Services (Real Estate, Tax Office, Insurance, & Law)474443Electronics, Cellphone, Computer Sales, & RepairDelis / Bodegas & Botanicas3634General Merchandise StoresVacant252323201917Specialty Food StoresHome, Furniture, Department, & Hardware StoresPharmacies & Health StoresLimited Service RestaurantsHouses of Worship, Nonprofit Organizations, & Public AdministrationDry Cleaners, Laundromats, & Tailor Shops141210109Cash Advance, Money Transfer Services, & Pawn ShopsSupermarketsJewelry StoresOffice Supply, Stationery, Shipping, & Gift StoresGyms, Martial Arts, & Dance StudiosAutomotive Related BusinessesBanksLiquor StoresFloristsConstruction, Manufacturing, Freight Shipping, & Wholesale 2OtherRoosevelt Avenue6Junction BoulevardNeighborhood 360 Commercial District Needs AssessmentIn Corona’s commercial district,327 businesses share the samelocation with at least one otherbusiness. Often each storehas its own entrance, address,and separate utility metering,allowing for easy divisionof expenses.7666Business inventory and retailmix data were gathered by theQueens Chamber of Commercethrough a comprehensive areainventory of businesses locatedalong Roosevelt Avenue, JunctionBoulevard, National and 103rdstreets. (January to June 2017).10National Street
What We’ve Heard from Corona MerchantsHow many years have you been inbusiness here?LIVE DATA CHARTHow many employees do you 2%11-2021 MeanMedianMode1%RentModeOwn15%No ResponseOver the past year, has your businessimproved, stayed the same, or decreased?Years in Business168 85 3Mean MedianMedian2Do you own or rent your property?25%160311%57% of businesses in Coronaare under five years old* Note: The mean is the average of all responses, the median is the middle number when allresponses are arranged in ascending order, and the mode is the most common response.ImprovedStayedthe Same58%DecreasedIn the coming year, do you plan to expand,stay, relocate, or close?6%ExpandWhat kinds of resources would helpyour business?% Merchant Responses31%86%Stay1%7%RelocateCloseWhat changes need to occur to attract morevisitors/shoppers to Corona? % Merchant ResponsesSpace improvements 32%Safety 30%Marketing support 14%Parking 22%Training for staff 13%Sanitation 21%New equipment 12%Community events 10%Access to financing 9%Beautification 9%Lease support 7%Merchant collaboration 4%Assistance with regulatory compliance 6%Storefront improvements 4%Legal services 4%Other services 5%Source: Based on 176 merchant surveys conducted by Asian Americans for Equality in Spring 2017.Corona7
BUSINESS LANDSCAPEStreet Vendor StudyCorona is home to perhaps one of the biggest street vending scenes in Queens. Walkingalong Roosevelt Avenue provides the full experience of the day-to-day life of a streetvendor and the diverse product offerings and vibrant street life they contribute to theneighborhood. The street vendor study notes the physical count of vendors, the type ofequipment they use to sell their products, as well as a closer look at their experiences,challenges, and priorities. There are three different types of vending as defined by NewYork City regulations — first amendment vendors (i.e., primarily those who sell books,magazines, and artwork), food vendors, and general vendors (i.e., primarily those whosell anything from clothing and accessories to flowers and toys). A greater familiarity withthe mix of street vendors and their offerings can allow for a better understanding of thefull breadth of goods and services available to local consumers and better align inclusivecommercial revitalization strategies for all stakeholders within the commercial district.TotalNumber ofStreetVendors78Street Vendor Retail MixPrepared Hot Foods25Fruits & Vegetables18Jewelry & Accessories18Ice Cream15Snacks & Drinks14Clothing1Health Care Services1This information was gathered between April and June 2017. The presence of each stationary street vendor (food truck vendor, vendors using carts to sell food and merchandise, vendorsusing stands, tables, shopping carts) and those using no equipment (e.g. selling out of a cooler) was documented through on-the ground-observations. Vendors in movement were excludedfrom this study.Vendor Types by EquipmentFood Truck vendors usually sellprepared meals and other larger selectionof productsFood Cart vendors typically sell food,drinks, and/or accessoriesStand vendors predominantly sell fruitsand vegetables, and sometimes drinks,plants, or accessoriesTable vendors sell accessories and/orsmall merchandiseCooler vendors sell drinks and oftenice creamNo Equipment vendors sell snacks anddrinks, and/or accessoriesVendor illustrations used courtesy of the Center for Urban Pedagogy (CUP) and are excerpted from Vendor Power!, a collaboration of CUP, The Street Vendor Project and designer CandyChang. The project, which folds out to a large-scale poster, decodes the rules and regulations for New York’s street vendors so they can understand their rights and avoid unnecessary fines.8Neighborhood 360 Commercial District Needs Assessment
What We’ve Heard from Corona Street VendorsOver the past year, has your businessimproved, stayed the same, or decreased?Do you live in this neighborhood?86%Yes10%No4%No ResponseImprovedIs vending your only source of income?67%Yes27%6%2%2%NoNo ResponseForeign Born96%YesNo6% 31% 49% 14%Stayedthe SameNo ResponseDecreasedWhat kind of resources would help you growyour business?40%Legal support No ResponseWhat changes need to occur to attract morevisitors/shoppers to Corona?Other* 21%Assistance with regulatory compliance 15%Access to financing 13%New equipment (cart, truck, etc.) 6%Safety 20%Marketing support 4%Sanitation 27%Technology improvements (mobile payments) 1%Community events 20%Beautification 12%Parking 12%* 2 1% of the Street Vendors surveyed noted that access to permits and licenses will help them growtheir businessesWhat We’ve Heard from Roosevelt Avenue MerchantsBusiness Inventory320Total BusinessesMost Common BusinessesLIVE DATA CHARTMedical Services6%Vacancy41Full Service Restaurants & Bars32Clothing & Shoe Stores29Barbershops, Beauty Salons, Spas, & Supply Stores27Electronics, Cellphone, Computer Sales & Repair22Do you own or rent your property?3%Own90%Rent7%No ResponseRoosevelt AvenueSource: Based on 51 street vendor surveys conducted by the Street Vendor Project in Fall 2017. Inventory conducted by AAFE on a Friday at 3:00pm; weather: 72 and sunny.Corona9
BUSINESS LANDSCAPEWhat We’ve Heard from Junction Boulevard MerchantsLIVE DATA CHARTMost Common BusinessesBusiness InventoryClothing & Shoe Stores2044%Total BusinessesVacancyDo you own or rent your property?85%Rent0%Own15%No ResponseJunction Boulevard39Medical Services19Full Service Restaurants & Bars18Barbershops, Beauty Salons, Spas, & Supply Stores16Professional Services (Real Estate, Tax Office,Insurance, & Law)16What changes need to occur on or aroundyour corridor to attract more shoppers?Safety 20%Sanitation 20%Parking 19%Community events 17%Merchant collaboration 12%Beautification 5%Storefront improvements 5%Other 2%What We’ve Heard from 103rd Street and National Street MerchantsBusiness Inventory191LIVE DATA CHARTMost Common Businesses4%Total BusinessesVacancyDo you own or rent your property?75%Rent0%Own25%No Response103rd Street and National Street10Neighborhood 360 Commercial District Needs AssessmentBarbershops, Beauty Salons, Spas, & Supply Stores27Full Service Restaurants & Bars25Bodegas, Delis, Convenience Stores, & BotanicasProfessional Services (Real Estate, Tax Office,Insurance, & Law)Clothing & Shoe Stores161413What changes need to occur on or aroundyour corridor to attract more shoppers?Safety 33%Parking 23%Sanitation 21%Beautification 9%Community events 5%Other 4%Storefront improvements 4%Merchant collaboration 2%
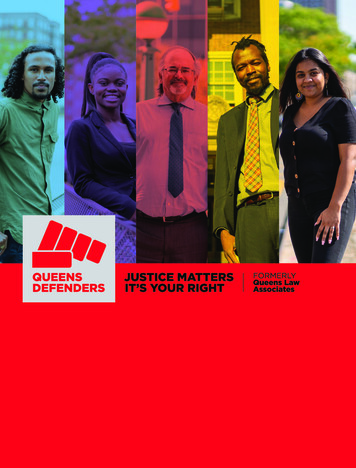
Commercial Density36 AV34 AVJUNV35 ACTBIONLVDV38 AST103V37 AV39 ARWA94 ST108TNSRE92 ST90 STVEAELT AVPark of theAmericasELWHMHITNEYURSTAVAVSTTNATIO10495 SNALSTROOSEVSTUCSPRV45 AV42 A41 AV0Number of businesses per lot12–45–1011–20Corridor DensityNumber of StorefrontsAverage feet between businessesActive businesses onlyCommercial District 29Commercial District 681Roosevelt Avenue 41Roosevelt Avenue 195Junction Boulevard 17Junction Boulevard 302103 and National streets 35103 and National streets 184rdrd0.050.10.2 MilesThe map above illustratesthe density of commercialactivity in Corona. Largercircles indicate a higherconcentration of businesses,including street vendors,merchants, and mini-malls.Some merchants believethat high commercialdensity is beneficial due tothe clustering of shoppingactivity in a concentratedarea, while others believethat too much concentrationmay deter shoppers.Number of VendorsCounted as of Fall 2017Commercial District 78Roosevelt Avenue 49Junction Boulevard 22103rd and National streets 7Corona11
BUSINESS LANDSCAPEWhat We’ve Heard from Corona Merchants and ShoppersHow is this commercial district differentfrom others?What changes would you like to see toimprove the commercial activity in the area?“Consumers have a diverse set of options when itcomes to purchasing products on the corridor.”“Improved security on the trains and on the street. Inaddition, cleanliness in the neighborhood should increase,as it’s a shame to live in New York and see so much trash.”“The diversity of the place!”“Create garden spaces and have more community-basedvigilance to support everyone to increase security.”“The area offers a unique shopping experience,characterized by the size of its stores, pricingoptions and leasing alternatives.”“City officials should work harder to collaborate with theresidents of the neighborhood to improve the area.”“Consistent and loyal customerbase that supports our businesses.”“There are not enough community events for children orfamilies. More events will help motivate residents andattract new people to the neighborhood.”“Different parts of the commercial corridor can be easilyreached due to the neighborhood’s high level of accessibility.”“The overall sense of safety within the neighborhoodneeds to increase. In the morning, when there are peoplearound, I feel safe. At night, however, there are less peopleon the streets and I feel unsafe.”“The density of businesses contributesto the vitality of the neighborhood.”What changes need to occur to attract more visitors/shoppers to the commercial district?MerchantsConsumersStreet VendorMerchantResponse %ConsumerResponse %StreetVendors %Safety30%25%29%Sanitation21%22%27%Storefront Improvements unity Events10%8%20%Merchant Collaboration4%6%–Source: Based on 300 consumer surveys, 176 merchant surveys, and 51 street vendor surveys conducted by AAFE, MRNY, and SVP in Spring 2017.12Neighborhood 360 Commercial District Needs Assessment
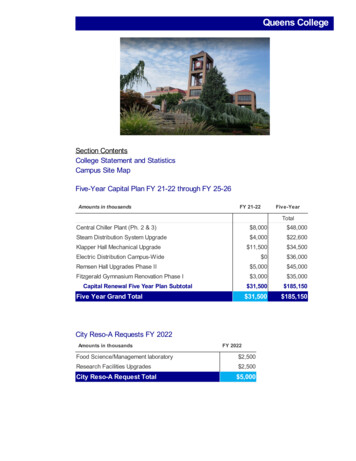
PHYSICAL ENVIRONMENTStorefront ConditionsSTST11136 AV10434 AV35 AVS103TV38 AJUNV37 AIONCTV39 ABLVDRERWA94 ST92 STNS90 ST108TSTSTNALNATIOAVAVEYITNWHSTURMHTELST95 SV45 AV42 A41 AV Poor Condition (22%) Vacant LotsPark of theAmericas104VVELT AROOSE0 Average Condition (42%)Vacant Storefronts0.050.10.2 Miles Good Condition (36%) Parks & Open SpaceAn analysis of 715 businesses along Roosevelt Avenue, Junction Boulevard, National Street, and 103rd Street revealed that 22% of storefronts are inpoor condition, 42% are in average condition, and 36% are in good condition.Streetscape ObservationsOf the 57 blocks where streetscape conditions were assessed, 16% were found to have good streetscape conditions, 54% exhibited averagestreetscape conditions, and 30% had poor streetscape conditions.Litter and trash management issues are highly visible alongRoosevelt Avenue, especially around corners and outside ofsubway stations.Corridors lack amenities like street furniture, murals, and artwork.Overall, there is a lack of maintenance of the few existing streetfurniture elements and open spaces within the corridor.Vandalism (graffiti, posters, etc.) is present along 68% of the blocksassessed in the study area.Storefronts intended for the operation of single commercial occupancyare crowded with multiple awnings for various business operations.Of the 715 storefronts assessed, 30% were found to be in poorcondition. Poorly rated storefronts were more commonlyconcentrated under the elevated train, while Junction Boulevardaccounted for most of the good storefront conditions.Display of business merchandise on the street affects the widths ofsidewalks, disrupting pedestrian circulation and perpetuating crowding.Vacant StorefrontsTrash ManagementThe elevated train creates challenges for businesses by reducinglighting and creating excessive noise.Elevated Train ConditionCorona13
BUSINESS OUTLOOKCorona Retail OpportunityResidents spendLocal businesses makeEvery year, 2.34B 1.06B 1.27Beach year ingoods and servicesRetail Leakage & Surpluseach year inretail salesis spent outsidethe neighborhoodLIVE DATA CHARTSurplus 0 Leakage 184. 7MGasoline StationsDepartment Stores (Excluding Leased Departments)Grocery StoresOther General Merchandise StoresClothing StoresElectronics & Appliance StoresBuilding Material & Supplies DealersRestaurants & Other Eating PlacesSporting Goods, Hobby, & Musical Instrument StoresJewelry, Luggage, & Leather Goods StoresFurniture StoresHome Furnishings StoresSpecialty Food StoresOther Miscellaneous Store RetailersOffice Supplies, Stationery, & Gift StoresDrinking Place -Alcoholic BeveragesUsed Merchandise StoresBook, Periodical, & Music StoresAuto Parts, Accessories, & Tire StoresSpecial Food ServicesLawn / Garden Equipment & Supply StoresBeer, Wine, & Liquor StoresFloristsShoe StoresHealth & Personal Care StoresSource: ESRI and Infogroup, November 2017.14Neighborhood 360 Commercial District Needs Assessment 118.4M 108.8M 90.6M 89.1M 60.8M 60.1M 53.3M 41.2M 27.1M 24.2M 23.5M 17.0M 15.7M 15.1M 12.4M 10.4M 9.4M 9.2M 8.3M 8.2M 5.7M 3.7M- 21.9M- 58.8MRetail leakage and surplus is thedifference between estimatedspending by local residentson retail goods and estimatedsales by local retail businesses.Retail leakage occurs whenconsumer demand exceedsretail supply in a designatedtrade area. On the chart, apositive value indicates leakageof retail sales and represents netconsumer spending that is beingcaptured by retailers outside ofthe trade area. Retail surplusoccurs when retail supplyexceeds consumer demand ina designated trade area. On thechart, a negative value indicatesa surplus of retail sales and maysignify a market where retailersare drawing customers fromoutside the trade area.
Business TrendsChange in Total Business Sales, 2010–2017CoronaChange in Median Sales by Business, 2010–2017Queens49%NYC51%Corona66%Corona Total Business SalesCorona Median Sales by Business20162017Year0 13,4582015 13,7522010201120122013201420152016 44,475 39,332 35,865 33,092 20K 10K2014 25,000 30K 13,283Sales Volume 155,052,8152013 144,953,7172012 136,136,7832011 129,048,4952010 116,183,363 96,624,870 100M 149,075,015 40K 100,174,820Sales Volume 50K 150M0NYC235% 196% 165% 200M 50MQueens2017YearSource: Division of Tax Policy, NYC Department of FinanceWhat We’ve Heard from ShoppersHow safe do you feel shopping in thiscommercial district at night?What additional types of businesseswould you like to see in Corona?Department storesHealthy food options, fresh produce marketsVery safe22%Open and recreational spacesSomewhat safe27%Family and kid-friendly businessesNot very safe36%Not at all safe15%Arts and entertainmentCo-ops and community organizationsHow do you usually get to Corona?How often do you shop in Corona?Walk52%Public transportation39%Bike2%Car7%Daily24%2 to 4 times a week10%Once a week26%Twice a month6%Once a month22%3 to 6 times a year5%Rarely/Never7%Source: Based on 300 consumer surveys conducted by Make the Road New York in Spring 2017.Source: Division of Tax Policy, NYC Department of FinanceCorona15
DATA APPENDIXStudy Area BoundariesAssessed Commercial CorridorsPrimary data on Corona’s storefront businesses and street vendors presented on pg. 6–11 was gathered along the following corridors:Roosevelt Ave.: 90th St. and 108th St.Junction Blvd.: 34th Ave. and 41st Ave.Corona Context AreaTrade Area103rd St.: 37th Ave. and Roosevelt Ave.Demographic and employmentdata on pg. 16–17 correspondto the Corona’s neighborhoodcontext area.Retail leakage, surplus, andretail opportunity data on pg. 14correspond to the 0.75 miletrade area.National St.: Roosevelt Ave. and 45th Ave.104th St.: Roosevelt Ave. and 42nd Ave.21 AVEEFlushingSTONL PKWYBQEFlushingBayASTOV37 ARIA BUNMASTTIN SRNWSLVD NIONJacksonHeights35 AVITENTRAWH41STD CE145 S TGRANXPY22 DRCTPYEX54 STCKWY61 RDMEADOW00.20.4LAKE DRXPYDEANLG ISLONBLYTTElmhurstROCOOMSOSKWBLVD94 SENSNAV55 ACoronaAV90 SQUEAVV50 ALPTRDSIDEFlushingMeadows CoronaParkENV45 AWOODCSTTELT AVROOSEVANGRS111ST10437 AV39 DR108STDDWAYBLVOA103ION34 AV90 STBRNVAJUNDRN BLVNORTHE0.8 MilesArea DemographicsTotal PopulationAverage Household s8,354,889New York City2.64New York CityCommuting Patterns5,462WorkPopulation Density (per square mile)Car s27,632New York City45%New York City16Neighborhood 360 Commercial District Needs Assessment5,46244417,50444417,504LiveWork in Corona, live elsewhereLive & Work in CoronaLive in Corona, work elsewhereAV
Area DemographicsPopulation DiversityCoronaQueensNYCHispanic or Latino78%28%29%White alone3%27%33%Black alone1%18%22%Asian alone15%24%Two or more races1%Some other race aloneEducational AttainmentCoronaQueensNYC12th Grade or Less,No Diploma42%20%20%High School Graduate32%27%25%13%Some College,No Degree10%15%14%2%2%Associate’s Degree5%8%6%0%2%1%Bachelor’s Degree9%19%21%American Indian andAlaska Native0%0%0%Graduate orProfessional Degree3%11%14%Native Hawaiian andOther Pacific Islande0%0%0%Population AgeCoronaQueensNYCMedian AgeForeign-Born PopulationUnder 5 years9%6%7%32.2Corona66%Corona5 to 14 years13%11%11%37.5Queens48%Queens15 to 24 years15%13%14%35.7New York City37%New York City25 to 44 years39%31%31%45 to 64 years20%26%25%65 years5%13%12%EmploymentIncomeMedian Household IncomePop. Below Poverty LinePopulation in Labor ForceUnemployment* 44,979Corona25%Corona66%Corona5.6%Corona 57,210Queens15%Queens64%Queens9.5%Queens 52,737New York City21%New York City63%New York City10.3%New York City*Note: Unemployment figures are based on data from 2010-2014. As of March 2018, theunemployment rate is 3.7% for Queens and 4.6% for New York City (NYSDOL); updatedneighborhood-level data for Corona is not available.Local EmploymentLocal Residents’ EmploymentJobs Located in the DistrictAccommodation, Food Services,Arts, Entertainment23%Accommodation, Food Services,Arts, Entertainment9%Construction14%Construction5%Other Services13%Other Services10%Retail Trade12%Retail Trade23%Educational Services, Health Care,Social Assistance11%Ed
The development of Corona began in the late 1800s after the New York and Flushing Railroad began service to the area. Initially known as West Flushing, Corona adopted its current name when local . real estate developer Thomas Waite Howard suggested the name "Corona" because he considered . the area to be the crown of Queens County.