Transcription
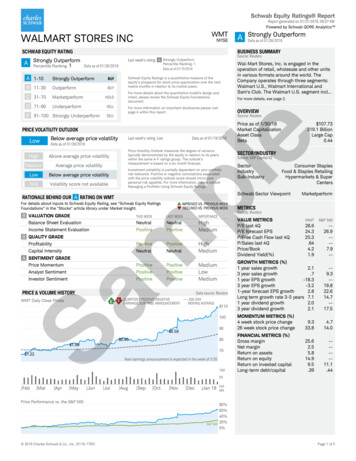
Schwab Equity Ratings ReportReport generated on 01/31/2018, 06:07 AMPowered by Schwab QORE Analytics WMTWALMART STORES INCNYSEData as of 01/26/2018Source: ReutersLast week's rating: A Strongly OutperformPercentile Ranking: 1Data as of 01/19/2018Data as of 01/26/2018A 1-10Strongly OutperformBUYB 11-30OutperformBUYC 31-70MarketperformHOLDD 71-90UnderperformSELLF 91-100 Strongly UnderperformSchwab Equity Ratings is a quantitative measure of theequity's prospects for stock price appreciation over the nexttwelve months in relation to its market peers.For more details about the quantitative model's design andintent, please review the Schwab Equity Foundationsdocument.OVERVIEWSource: ReutersSELLLast week's rating: LowData as of 01/19/2018Data as of 01/26/2018Above average price volatilityMediumAverage price volatilityLowBelow average price volatilityN/AVolatility score not available 107.73319.1 BillionLarge Cap0.44Price Volatility Outlook measures the degree of variancetypically demonstrated by the equity in relation to its peerswithin the same A-F ratings group. The outlook'smeasurement is based on a six month forecast.SECTOR/INDUSTRYSource: S&P Capital IQInvestment suitability is partially dependent on your portfoliorisk tolerance. Positive or negative connotations associatedwith the price volatility outlook score should mirror yourpersonal risk appetite. For more information, please consultManaging a Portfolio Using Schwab Equity Ratings.SectorIndustrySub-IndustryConsumer StaplesFood & Staples RetailingHypermarkets & SuperCentersplHighPrice as of 1/30/18Market CapitalizationAsset ClassBetaeBelow average price volatilityWal-Mart Stores, Inc. is engaged in theoperation of retail, wholesale and other unitsin various formats around the world. TheCompany operates through three segments:Walmart U.S., Walmart International andSam's Club. The Walmart U.S. segment incl.For more details, see page 2.For more information on important disclosures please visitpage 4 within this report.PRICE VOLATILITY OUTLOOKLowStrongly OutperformBUSINESS SUMMARYSCHWAB EQUITY RATINGOutperformA StronglyPercentile Ranking: 1ASchwab Sector ViewpointRATIONALE BEHIND OUR A RATING ON WMTFor details about inputs to Schwab Equity Rating, see "Schwab Equity RatingsFoundations" in the "Stocks" article library under Market Insight.IMPROVED VS. PREVIOUS WEEKDECLINED VS. PREVIOUS WEEKMarketperformMETRICSSource: ReutersB VALUATION GRADELAST wMediumSamBalance Sheet EvaluationIncome Statement EvaluationTHIS WEEKVALUE METRICSP/E last 4QP/E forecast EPSP/Free Cash Flow last 4QP/Sales last 4QPrice/BookDividend Yield(%)B QUALITY GRADEProfitabilityCapital IntensityA SENTIMENT GRADEPrice MomentumAnalyst SentimentInvestor SentimentPRICE & VOLUME HISTORYWMT Daily Close PricesEData source: ReutersE QUARTERLY POSITIVE/NEGATIVE--- 200-DAYEARNINGS SURPRISE ANNOUNCEMENTMOVING AVERAGE 11010090 0.58 0.9680 1.0070 1.22Next earnings announcement is expected in the week of 2/20100WMTS&P 50028.624.325.3.644.21.9-26.9--7.9--GROWTH METRICS (%)1 year sales growth2.13 year sales growth.71 year EPS growth-18.33 year EPS growth-3.21-year forecast EPS growth2.8Long term growth rate 3-5 years 7.11 year dividend growth2.03 year dividend growth2.1-9.3-19.822.614.7-17.5MOMENTUM METRICS (%)4 week stock price change26 week stock price change9.333.84.714.0FINANCIAL METRICS (%)Gross marginNet marginReturn on assetsReturn on equityReturn on invested capitalLong-term rAprMayJunPrice Performance vs. the S&P 500 2018 Charles Schwab & Co., Inc. (0118-7705)JulAugSepOctNovDecJan 18Vol.Mil80%60%40%S&P 500 20%0%Page 1 of 5
Schwab Equity Ratings ReportReport generated on 01/31/2018, 06:07 AMPowered by Schwab QORE Analytics WMTWALMART STORES INCNYSEEARNINGS PER SHAREQuarterly Fiscal Year endingin January2017Q4 1.502018Q12018Q22018Q32018Q4E1.361.221.00 1.000.96201420154.844.96 0.50OTHER OPINIONSCFRARecommendation201620172018E 2-7.9-17-4.0-28--31Revenue data source: ReutersQuarterly 2018Q12018Q2Annual 2018Q32018Q4E20142015201620172018E 0.0B4.2ANNUAL EARNINGS FORECAST--1.62.0NUMBER OFFORECASTS 4.44 4.897.1% 0.01 0.181.3% 4.32- 4.52 4.37- 5.404.0%-10.0%31326SamFORECASTRANGEDividends data source: Reuters0.500.510.510.51 0.40 0.20 0.00--CONSENSUSCHANGE INLAST 30 DAYSQuarterly 0.500.8MEANFORECASTDIVIDENDS 0.60-0.7Source: Reuters01/31/201801/31/2019Next 5 Yr. Growth RateQ3 2017 Q4 2017 Q1 2018 Q2 2018 Q3 2018Dividends are paid on a Quarterly basis. 2018 Charles Schwab & Co., Inc. (0118-7705)RATING SINCE 11/03/2017 Credit Suisse RatingRATING SINCE 09/16/2016UNDERPERFORMNEUTRALOUTPERFORMArgus 12 Month Rating RATING SINCE 04/25/2012SELLHOLDBUYMarket Edge Second Opinion AVOIDNEUTRAL 2.00 1.50 1.00 0.50 0.00RATING TPERFORMBUYSource: Reuters B2.1 BUSINESS DESCRIPTION 200B1.4 pl 50.0B1.0Morningstar Rating Reuter's Average Rating RATING SINCE 01/29/2018134.80B 600B 150.0B 130.94B476.29B 485.65B 482.13B 485.87B 498.69B117.54B 123.36B 123.18B 100.0B 400Bvs. 1 year ago (%) eREVENUE2017Q4RANKING SINCE 08/18/2016Ned Davis RatingRATING SINCE 05/30/2017SELLNEUTRALBUYNext earnings announcement is expected in the week of 2/20Fiscal Year endingin January 0.00vs. prior year (%)-12.8Earnings Surprise(%)-# of analysts27Data as of 01/26/2018Annual 2.00 0.00Strongly OutperformEarnings data source: Reuters 4.000.58A1.88Annual 1.921.962.002014201520162017Wal-Mart Stores, Inc. is engaged in theoperation of retail, wholesale and other unitsin various formats around the world. TheCompany operates through three segments:Walmart U.S., Walmart International andSam's Club. The Walmart U.S. segmentincludes its mass merchant concept in theUnited States operating under the Walmartor Wal-Mart brands, as well as digital retail.The Walmart International segment consistsof the Company's operations outside of theUnited States, including various retailWebsites. The Walmart Internationalsegment includes various formats dividedinto three categories: retail, wholesale andother. These categories consist of variousformats, including supercenters,supermarkets, and warehouse clubs, such asSam's Clubs, cash and carry, homeimprovement, specialty electronics, apparelstores, drug stores and convenience stores,as well as digital retail. The Sam's Clubsegment includes the warehousemembership clubs in the United States, andsamsclub.com.Page 2 of 5
Schwab Equity Ratings ReportReport generated on 01/31/2018, 06:07 AMPowered by Schwab QORE Analytics WALMART STORES INCNEWS HEADLINES 1101009080DecSamplNo Recent News for WMT.Jan 18eNov 2018 Charles Schwab & Co., Inc. (0118-7705)Page 3 of 5
Schwab Equity Ratings ReportReport generated on 01/31/2018, 06:07 AMPowered by Schwab QORE Analytics WALMART STORES INCIMPORTANT DISCLOSURES FOR WMTRegulation Analyst Certification: The views expressed in this research report accurately reflect Schwab's quantitative research model, and no part of Schwab's compensationwas, is or will be, directly or indirectly, related to the specific recommendations or views disclosed in the research report.Note the Price Chart in the disclosures of this report which shows the rating and price history over applicable periods for this stock, including if and when coverage wasterminated or suspended.Within the previous 12 months, the percentage of companies that have a Schwab Equity Rating and for which Schwab has provided investment banking services are asfollows: 1.91% in Buy Category (Schwab Equity Ratings and Schwab Equity Ratings International of A or B) 2.28% in Hold Category (Schwab Equity Ratings and Schwab Equity Ratings International of C) 1.2% in Sell Category (Schwab Equity Ratings and Schwab Equity Ratings International of D or F)Schwab Equity Rating History for WMTPrice History for WMT tBCDFJan18SCHWAB EQUITY RATINGS MEANING AND DISTRIBUTIONSchwab Equity Ratings are assigned to approximately 3000 U.S.-traded stocks. The Schwab Equity Ratings model universe is generally composed of the combined set ofstocks in the Russell Investments’ (“Russell”) 3000 Index and the Standard & Poor’s (“S&P”) 500 Index. Additional universe coverage may be incorporated from time to time.The explanation and table below are included to assist you in using Schwab Equity Ratings as one component of your own research to evaluate stocks and investmentopportunities.SamSchwab rates stocks using a scale of A/B/C/D/F. Schwab’s outlook is that "A" rated stocks, on average, will strongly outperform and "F" rated stocks, on average, will stronglyunderperform the equities market over the next 12 months. Schwab Equity Ratings are based upon a disciplined, systematic approach that evaluates each stock on the basis ofa wide variety of investment criteria from three broad categories: Fundamentals, Valuation, and Momentum. This approach attempts to gauge investor expectations since stockprices tend to move in the same direction as changes in investor expectations. Stocks with low and potentially improving investor expectations tend to receive the best SchwabEquity Ratings ("A" or "B" ratings), while stocks with high and potentially falling investor expectations tend to receive the worst Schwab Equity Ratings ("D" or "F" ratings). Fromtime to time, Schwab may update the Schwab Equity Ratings methodology.Schwab Equity Ratings DistributionSchwabPercentileEquity RatingRanking DistributionA1 - 10B11 - 30C31 - 70D71 - 90F91 - 100Distributionof Rating Within SectorTop 10%Next 20%Next 40%Next 20%Bottom 10%12 MonthReturn OutlookStrongly gly UnderperformGeneralBuy/Hold/Sell Guidance*BuyBuyHoldSellSell*The general buy/hold/sell guidance is relative to other rated equities only. Before considering whether to take any action, an investor should consider whether equitiesgenerally are performing well in comparison to other asset classes and whether other equities in the same sector or category with the same or better rating may be moreappropriate.Investment Rating ExplanationA (Strongly Outperform): If an investor is looking to add a stock to his or her portfolio, "A" rated stocks may be the best candidates for consideration.B (Outperform): An investor looking to add a stock to his or her portfolio might also consider a "B" rated stock, though preference should be given to "A" rated stocks.C (Marketperform): An investor would not usually consider a "C" rated stock for purchase. An investor holding a "C" rated stock in his or her portfolio should considercontinuing to hold the stock, and might monitor the stock’s ongoing performance and compare the potential benefits of owning a stock with higher ratings.D (Underperform): An investor holding a "D" rated stock should consider whether it is appropriate to continue to hold that stock in his or her portfolio. An investor would notusually consider a "D" rated stock for purchase.F (Strongly Underperform): An investor holding an "F" rated stock should consider whether it is appropriate to eliminate that stock from his or her portfolio. An investorwould not usually consider an "F" rated stock for purchase.Percentile Rankings Explanation: Each of the approximately 3,000 stocks rated in the Schwab Equity Ratings U.S. universe is given a score that is derived from the researchfactors used in the Schwab Equity Ratings model. Once the stock’s composite score, which includes all research factor scores, is calculated, the universe of rated stocks isdivided into two groups: large-capitalization (“large-cap”) stocks – generally the combined set of stocks in the Russell 1000 Index and the S&P 500 Index – and small-capstocks – generally those stocks in the Russell 2000 Index. The large- and small-cap groups are further divided into eleven economic sectors within each capitalization group.The assignment of a final Schwab Equity Rating depends on how well a given stock’s composite score ranks against the composite scores of other stocks in the samecapitalization group and sector. The result is a stock's within-capitalization-group and within-sector, or cap-neutral and sector-neutral, percentile ranking. The lowestpercentile rankings represent the best scores and correspond to the best letter grades. For example, in a sector of 400 rated stocks, the top 4 stocks would receive a percentileranking of 1 and the bottom 4 stocks would receive a percentile ranking of 100. Stocks ranked in percentile groups 1-10 are rated "A" and those in percentile groups 11-30 arerated "B." 2018 Charles Schwab & Co., Inc. (0118-7705)Page 4 of 5
Schwab Equity Ratings ReportReport generated on 01/31/2018, 06:07 AMPowered by Schwab QORE Analytics WALMART STORES INCIMPORTANT DISCLOSURES FOR WMTModel RisksSchwab Equity Ratings uses quantitative analyses in its modeling method. Any limitations or inaccuracies in its analyses or models could affect model performance and theresults investors may achieve. Models that appear to explain prior market data can fail to predict future market events. While the data used in the models has been taken fromsources Schwab believes to be reliable; its accuracy, completeness or interpretation cannot be guaranteed. Schwab Equity Ratings may not capture subjective, qualitativeinfluences on return and risk such as changes in management, business and political trends, or legal and regulatory developments. Thus, it is important to conduct additionalresearch prior to making a trading decision.Descriptions for Non-Rated StocksCategory DefinitionDescriptionNRNot RatedNANCNot AvailableNot CoveredSchwab has decided not to publish a rating on this stock due to unusual or extraordinary business circumstances related to this company.Although Schwab generally does not monitor C, D, and F rated stocks for unusual or extraordinary business circumstances, from time totime, a rating of NR may appear on a particular stock.A Schwab Equity Rating is not available on this stock due to insufficient information about this stock.This stock is not currently in the Schwab Equity Ratings universe or is prohibited from coverage for regulatory or other reasons.eDISCLAIMER INFORMATIONVARYING VIEWPOINTS - The information contained in these materials reflects the Charles Schwab & Co., Inc. Schwab Equity Rating on a particular stock. Schwab, itsaffiliates and/or their employees may publish or otherwise express other viewpoints or trading strategies that may conflict with the Schwab Equity Rating included in this report.Please be aware that Schwab and/or its affiliates and the investment funds and managed accounts they manage may take positions, which may be contrary to the includedSchwab Equity Rating.plGENERAL INFORMATION - This material is for informational purposes only and is not an offer to sell or the solicitation of an offer to buy. Additionally, Schwab Equity Ratings,Percentile Rankings, and the general guidance are not personal recommendations for any particular investor or client and do not take into account the financial, investment orother objectives or needs of, and may not be suitable for any particular investor or client. Investors and clients should consider Schwab Equity Ratings as only a single factor inmaking their investment decision while taking into account the current market environment. Schwab Equity Ratings utilize third-party data in computing a rating. While Schwabbelieves such third-party information is reliable, we do not guarantee its accuracy, timeliness or completeness. The Schwab Center for Financial Research may provideresearch consulting services, such as those related to Schwab Equity Ratings model design and performance, to Schwab investment advisory affiliates for their assetmanagement purposes. Such services are not available to all other clients. Schwab Equity Ratings are generally updated weekly, so you should review and consider any recentmarket or company news before taking any action. Past history is no indication of future performance and you may lose money on your investment. For questions, please call877-284-9817.GICS - The industry classification information contained in these materials reflects The Global Industry Classification Standard (GICS) which was developed by and is theexclusive property of Morgan Stanley Capital International Inc. and Standard and Poor's. GICS is a service mark of MSCI and S&P and has been licensed for use by Schwab.SamFOR RECIPIENTS IN SINGAPORE - This report is prepared by Schwab Center for Financial Research, a division of Charles Schwab & Co., and distributed in Singapore by anintermediary who is a Financial Adviser or Exempt Financial Adviser as defined in the Singapore Financial Advisers Act pursuant to an arrangement under Regulation 32C of theFinancial Advisers Regulations in Singapore. Where the research is distributed in Singapore to a person who is not an Accredited Investor, Expert Investor or an InstitutionalInvestor, the distributor accepts legal responsibility for the contents of the report to such persons only to the extent required by law. Singapore recipients should contact thedistributor in Singapore for matters arising from, or in connection with the report.¹Markit on Demand used S&P Capital IQ's data in making its calculations. 2018 Charles Schwab & Co., Inc. (0118-7705)Page 5 of 5
1.91% in Buy Category (Schwab Equity Ratings and Schwab Equity Ratings International of A or B) 2.28% in Hold Category (Schwab Equity Ratings and Schwab Equity Ratings International of C) 1.2% in Sell Category (Schwab Equity Ratings and Schwab Equity Ratings International of D or F) Price History for WMT 50 75 100 125
