Transcription
A NNUAL C ONFERENCE OF THE P ROGNOSTICS AND H EALTH M ANAGEMENT S OCIETY 2014Standards for Prognostics and Health Management (PHM)Techniques within Manufacturing OperationsGregory W. Vogl1, Brian A. Weiss1, and M. Alkan Donmez11National Institute of Standards and Technology, Gaithersburg, Maryland, 20899, donmez@nist.govABSTRACTPrognostics and health management (PHM) technologiesreduce time and costs for maintenance of products orprocesses through efficient and cost-effective diagnostic andprognostic activities. These activities aim to provideactionable information to enable intelligent decision-makingfor improved performance, safety, reliability, andmaintainability. Thoughtful PHM techniques can have adramatic impact on manufacturing operations, and standardsfor PHM system development, data collection and analysistechniques, data management, system training, and softwareinteroperability need to exist for manufacturing. TheNational Institute of Standards and Technology (NIST)conducted a survey of PHM-related standards applicable tomanufacturing systems to determine the needs addressed bysuch standards, the extent of these standards, and anycommonalities as well as potential gaps among thedocuments. Standards from various national andinternational organizations are summarized, including thosefrom the International Electrotechnical Commission, theInternational Organization for Standardization, and SAEInternational. Finally, areas for future PHM-relatedstandards development are identified.1. PHM ENABLES SMART MANUFACTURINGPrognostics and health management (PHM) systems andtechnologies enable maintenance action on products andprocesses based on need, determined by the current systemcondition via diagnostic analyses and/or the expected futurecondition through prognostic methods. PHM techniques arein contrast to the use of schedules (i.e., preventativemaintenance) where maintenance is conducted on specifictime intervals (United States Army, 2013). PHM aims toreduce burdensome maintenance tasks while increasing theGregory W. Vogl et al. This is an open-access article distributed underthe terms of the Creative Commons Attribution 3.0 United StatesLicense, which permits unrestricted use, distribution, and reproductionin any medium, provided the original author and source are credited.availability, safety, and cost effectiveness for the productsand processes to which it is applied. In this sense, PHMenables smart manufacturing by optimizing maintenanceoperations via data collection, diagnostics, and prognosticsas well as usage monitoring.1.1. National Strategic Needs in ManufacturingThe United States is beginning to gain ground inreestablishing its manufacturing dominance throughresearch and development in a wide-range of advancedtechnologies. Additive manufacturing, robotics, dataanalytics, cloud computing, and intelligent maintenance arejust a few evolutionary technologies that are actively beingrefined. These technologies can have a tremendous impacton U.S. manufacturing that would “increase et,andflexibility” (Ludwig & Spiegel, 2014).The National Institute of Standards and Technology (NIST)is focused on advancing, documenting, and standardizingindustry practices in many of these new technologies.Standards have a well-documented history of impact withinthe national and global manufacturing community (Ludwig& Spiegel, 2014). NIST has a strong history of workingwith industry to develop standards and guidelines topromote best practices and further manufacturingcompetitiveness (Bostelman, Teizer, Ray, Agronin &Albanese, 2014, Hunten, Barnard Feeney & Srinivasan,2013, Lee, Song & Gu, 2012, Marvel & Bostelman, 2013).Much of NIST’s work in the manufacturing sector lieswithin the NIST Engineering Laboratory (EL).One of EL’s manufacturing projects is Prognostics andHealth Management for Smart Manufacturing Systems(PHM4SMS), which was initiated in 2013 (NationalInstitute of Standards and Technology, 2014). The goal ofthis five-year effort is to develop and document methods,protocols, best practices, and tools to enable robust, realtime diagnostics and prognostics in manufacturingenvironments. These outputs will provide manufacturers576
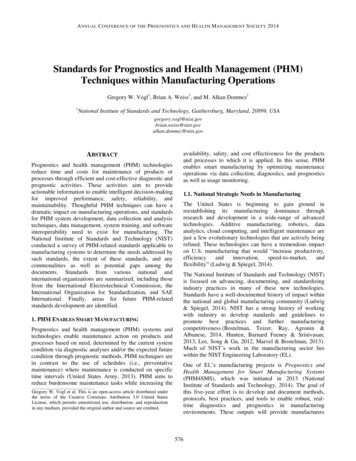
ANNUALCONFERENCETHEPPROGNOSTICS ANDEALTHMMANAGEMENTSOCIETY20142014A NNUALC ONFERENCEOFOFTHEROGNOSTICSANDHHEALTHANAGEMENTS OCIETYwith uniform guidelines to identify the complex system,sub-system, and component interactions within smartmanufacturing so they can understand the specificinfluences of each on process performance metrics and dataintegrity. Increased operational efficiency will be achievedthrough this greater understanding of the system, itsconstituent elements, and the multitude of relationshipspresent.1.2. PHM Needs and ChallengesFigure 1 shows a flowchart of the general process of PHMsystem development with certain standards listed forreference purposes. PHM system development begins withcost and dependability analyses to determine thecomponents to monitor. The data management system isthen initialized for collection, processing, visualization, andarchiving of the maintenance data. Once the measurementtechniques are established, the diagnostic and prognosticapproaches are developed and tested to ensure that thedesired goals are achieved. Finally, personnel are trainedduring the iterative process of system validation andverification before final system deployment.subsystems, so standards about data acquisition andprocessing are needed to influence the requirements forPHM systems development (United States Army, 2013).Standards for PHM are needed for harmonized terminology,consistency of the PHM methods and tools, andcompatibility and interoperability of PHM technology.Standards also help provide guidance in the practical useand development of PHM techniques (Mathew, 2012). Thecreation of PHM systems is still difficult due to the interrelated tasks of design engineering, systems engineering,logistics, and user training (United States Army, 2013).1.3. NIST PHM EffortsPHM systems need to be developed, verified, and validatedbefore implementation to enable improved decision-makingfor performance, safety, reliability, and maintainability ofproducts and processes. However, standards appear to belacking for PHM system development, data collection andanalysis techniques, data management, system training, andsoftware interoperability. The PHM4SMS project at NISTintends to help to serve a role in the development of suchstandards. The first step is to identify the existing pertinentstandards, and this paper summarizes the results of such areview (Vogl, Weiss & Donmez, 2014).PHM System Design BeginsISO 17359, MSG-3, ADS-79D-HDBKCost Benefit Analysis, Dependability AnalysisCost Benefit Analysis: IEC 60300-3-3, SAE ARP6275Dependability: IEC 60300-3-1, IEC 61703, SAE ARP4761Bottom-Up Methods: SAE ARP5580, SAE J1739, IEC 60812Top-Down Methods: IEC 61025, IEC 61165, ISO/IEC 15909Data Requirements and ManagementISO 13374-1, ISO 13374-2, ISO 18435-1, ISO 18435-2Measurement TechniquesISO 17359, ISO 13379-1Diagnostics and PrognosticsDiagnostics: ISO 13379-1Prognostics: ISO 13381-1PHM Testing and TrainingTraining: ISO 18436 (parts 1 to 8)PHM System DeploymentFigure 1. General PHM system development process andassociated standards.Several needs and challenges exist for PHM systemdevelopment. PHM is dependent on maintenance-relateddata collection and processing for components or2. PUBLISHED STANDARDSMultiple organizations publish standards related to PHM formanufacturing products or processes. Table 1 lists theorganizations that have published standards, while Table 2(see Section 3) and Table 3 (see Appendix) categorize thedeveloping or existing standards, respectively, related toPHM for manufacturing. All tables are organized accordingto topics based on the PHM process steps seen in Figure 1:‘Overview’, ‘Dependability analysis’, ‘Measurementtechniques’, ‘Diagnostics and Prognostics’, ‘Datamanagement’, ‘Training’, and ‘Applications’. If a standardhas an ‘X’ mark in a corresponding general topic columnwithin a table, then that standard is largely applicable withinthat category. Some of the standards outline broadapproaches for PHM (marked in the ‘Overview’ category)or are specific in guidance for PHM within a givenapplication (marked in the ‘Applications’ category). Otherstandards focus on dependability analysis, measurementtechniques, diagnostics and/or prognostics, PHM datamanagement, or training related to maintenance of systems.The lists of standards are not exhaustive, yet arecomprehensive enough for those in the manufacturingfields.As seen in Table 1, the standards were typically developedby a technical committee (TC) or subcommittee (SC) ofvarious national and international organizations: the rotechnical Commission (IEC), the Institute ofElectrical and Electronics Engineers (IEEE), the5772
ANNUALCONFERENCETHEPPROGNOSTICS ANDEALTHMMANAGEMENTSOCIETY20142014A NNUALC ONFERENCEOFOFTHEROGNOSTICSANDHHEALTHANAGEMENTS OCIETYInternational Organization for Standardization (ISO), theMachinery Information Management Open StandardsAlliance (MIMOSA), SAE International, and the UnitedStates Army (US Army).XX XXApplicationsTrainingData managementDiagnostics and PrognosticsMeasurement techniquesCost and Dependability IMOSASAE InternationalSAE InternationalSAE InternationalSAE InternationalUS ArmyCommittee/SubcommitteeMSG56RSTC 108/SC 2TC 108/SC 5TC 184/SC 4TC 184/SC 5JTC 1/SC 7——AQPICE-32G-11rHM-1Aviation EngineeringOverviewTable 1. PHM-related standards organizations.XXX X X XXX XXXXXXXX XX X X XXX XXXXThe following sections summarize the published standardsin categories that are broad in scope: es,Diagnostics and Prognostics, and Data Management.Because they are outside the scope of NIST’s current focus,Cost-, Training-, and Application-focused standards are notsummarized.2.1. OverviewStandards with general guidance about the creation of PHMsystems are indicated under the ‘Overview’ category withinTable 3. Such standards are a natural starting point duringthe creation of PHM systems, because these documentsoutline the factors influencing condition monitoring andprovide guidance for the monitoring of components and/orsub-systems.2.1.1. Manufacturing IndustryAs the parent document of a group of standards that coverconditionmonitoringanddiagnostics,ISO 17359 (International Organization for Standardization,2011) was developed by ISO/TC 108/SC 5 (“Conditionmonitoring and diagnostics of machines”) to provide thegeneral procedures for setting up a condition monitoringprogram for all machines, e.g., the generic approaches tosetting alarm criteria and carrying out diagnosis andprognosis. ISO 17359 outlines the condition monitoringprocedure for a general manufacturing process, factorsinfluencing condition monitoring, a list of issues affectingequipment criticality (e.g., cost of machine down-time,replacement cost), and a table of condition monitoringparameters (such as temperature, pressure, and vibration) forvarious machine types. ISO 17359 also presents multipleexamples of tables showing the correlation of possible faults(e.g., air inlet blockage, seal leakage, and unbalance) withsymptomsorparameterchanges.Furthermore,ISO 17359 shows an example of a typical form forrecording monitoring information.2.1.2. Aircraft IndustryAnother standard that provides guidance for PHM or/ManufacturerScheduledMaintenanceDevelopment.” The Maintenance Steering Group (MSG) ofthe Air Transport Association (ATA) developed MSG-3,which is used for developing maintenance plans for aircraft,engines, and systems (Air Transport Association ofAmerica, 2013) before the aircraft enters service. MSG-3 isa top-down approach to determine the consequences (safety,operational, and economic) of failure, starting at the systemlevel and working down to the component level (Adams,2009). Failure effects are divided into five categories, and ifthe consequences of failure cannot be mitigated, thenredesign becomes necessary. For example, the MSG-3process led to mandatory design changes for the Boeing787-8’s in-flight control and lightning protection systems.Furthermore, the MSG-3 methodology helps improve safetywhile reducing maintenance-related costs up to30 percent (Adams, 2009).2.1.3. MilitarySimilar in scope to the standards just described, anAeronautical Design Standard (ADS) Handbook (HDBK),ADS-79D-HDBK, was developed by the U.S. Army todescribe the Army’s condition-based maintenance (CBM)system for military aircraft systems (United States Army,2013). CBM is the preferred maintenance approach forArmy aircraft systems, yet ADS-79D-HDBK is broadenough for application in other industries to be included inthe ‘Overview’ category of Table 3. The document providesguidance and standards for use by all Department ofDefense (DoD) agencies in the development of CBM dataacquisition, signal processing software, and datamanagement. Furthermore, ADS-79D-HDBK is in the spiritof the reliability centered maintenance (RCM) methodspreviously used by the DoD to avoid the consequences ofmaterial failure. Failure mode, effects, and criticalityanalysis (FMECA) identifies where CBM should beutilized, but RCM is used to determine the most appropriatefailure management strategy. Additionally, ADS-79D-5783
ANNUALCONFERENCETHEPPROGNOSTICS ANDEALTHMMANAGEMENTSOCIETY20142014A NNUALC ONFERENCEOFOFTHEROGNOSTICSANDHHEALTHANAGEMENTS OCIETYHDBK is supported by the Machinery InformationManagement Open Standards Alliance (MIMOSA), aUnited States association of industry and Government, andfollows the information flow structure detailed in theISO 13374 series (International Organization forStandardization, 2003, United States Army, rthiness’, ‘critical safety item’, ‘exceedance’, etc.)and assists in the development of CBM systems for bothlegacy and new aircraft. Also, the standard describes theelements of a CBM system architecture with technicalconsiderations for Army aviation in thirteen separateappendices (e.g., fatigue life management, flight testvalidation, vibration based diagnostics, and data integrity).These appendices help developers identify components tomaintain, plan for data acquisition, perform fault testing,design the software and hardware elements, and validateCBM algorithms.2.2. Dependability AnalysisOne aspect of the generation of PHM systems outlined inFigure 1 is the determination of what components orsubsystems should be redesigned, changed, or monitoreddue to their fault and/or failure potential. Typically, adependability analysis involves the identification of thereliability, availability, and maintainability of the entiresystem, its subsystems, and its components (InternationalElectrotechnical Commission, 2003).Numerous methods exist to identify the failure modes of thesystem. Bottom-up (elements) methods are used to identifythe failure modes at the component level, which are thenused to determine the corresponding effect on higher-levelsystem performance. On the other hand, top-down(functional) methods are used to identify undesirable systemoperations by starting from the highest level of interest (thetop event) and proceeding to successively lowerlevels (International Electrotechnical Commission, 2003).Bottom-up dependability analysis methods include eventtree analysis, failure mode and effects analysis (FMEA), andhazard and operability study (HAZOP), while top-downmethods include fault tree analysis (FTA), Markov analysis,Petri net analysis, and reliability block diagrams (RBD).2.2.1. General GuidanceIEC 60300-3-1 gives a general overview of the commondependability analysis techniques, including fault treeanalysis, Markov analysis, Petri net analysis, and stressstrength analysis. IEC 60300-3-1 presents tables outliningthe general applicability and characteristics of each methodas well as concise summaries of each method (includingbenefits, limitations, and examples) in a icalCommission, 2003). The methods can be categorizedaccording to their purpose of either fault avoidance (e.g.,stress-strength analysis), architectural analysis anddependability allocation (bottom-up methods, such asFMEA, or top-down methods, such as FTA), or estimationof measures for basic events (such as failure rateprediction). Analysis based on either a hardware (bottomup), functional (top-down), or combination approach shouldbe used to assess high risk items and provide correctiveactions (United States Department of Defense, 1980).Another standard that covers various dependability analysesis SAE ARP4761, an Aerospace Recommended Practice(ARP) that provides guidelines and methods of performingsafety assessments for certification of civil aircraft (SAEInternational, 1996). Methods covered in SAE ARP4761 forsafety assessment include FTA, dependence diagram (DD),Markov analysis, FMEA, and common cause analysis.To support the quantification of dependability, the IECtechnical committee 56 (Dependability) developedIEC 61703 to provide the mathematical expressions forreliability, availability, maintainability, and lCommission, 2001). The expressions are grouped intoclasses for various items: non-repaired items, repaired itemswith zero time to restoration, and repaired items with nonzero time to restoration. Numerous equations are providedin IEC 61703 for the generic case of an exponentiallydistributed time to failure.2.2.2. Bottom-Up MethodsFMEAFMEA is a formal and systematic approach to identifypotential failure modes of a system along with their causesand immediate andfinal effects on systemperformance (International Electrotechnical Commission,2006a) through the usage of information about failure(“What has failed?”) and its effects (“What are theconsequences?”) (SAE International, 2001). It isadvantageous to perform FMEA early in the development ofa product or process so that failure modes can be eliminatedor mitigated as cost effectively as possible. FMEA can beused to identify failures (e.g., hardware, software, humanperformance) and improve reliability and maintainability viainformation for the development of diagnostic andmaintenance procedures. FMEA has been modified forvarious purposes; failure modes, effects and criticalityanalysis (FMECA) is an extension of FMEA that uses ametric called criticality to rank the severity of failuremodes (International Electrotechnical Commission, 2006a)as well as the probability of each failure mode (SAEInternational, 2001).For example, SAE ARP5580 describes the procedure forhow to perform FMEA. This procedure includes a basicmethodology for the three FMEA classifications related tohow the failure modes are postulated: functional FMEA (at5794
ANNUALCONFERENCETHEPPROGNOSTICS ANDEALTHMMANAGEMENTSOCIETY20142014A NNUALC ONFERENCEOFOFTHEROGNOSTICSANDHHEALTHANAGEMENTS OCIETYthe conceptual design level), interface FMEA (before thedetailed design of the interconnected subsystems), anddetailed FMEA (performed when detailed designs areavailable) (SAE International, 2001). SAE ARP5580 can beused to assess the reliability of systems with increasingimpact when FMEA is performed at increasing levels ofdetail during development of hardware or software.SAE ARP5580 provides many definitions of key terms(e.g., ‘allocation’, ‘criticality’, and ‘fault tree’) and otheritems typically included within FMEA. SAE ARP5580provides ground rules (with an example), numberingconventions for functional FMEA to describe systemsaccording to a hierarchy (subsystems, components,software, etc.) with well-defined inputs and outputs, andexamples of severity classifications for military, aerospace,and automobile industries.DFMEA and PFMEAAnother standard concerning FMEA is SAE J1739, whichsupports the development of an effective design FMEA(DFMEA) and a FMEA for manufacturing and assemblyprocesses (PFMEA) (SAE International, 2009). Based onreferences (e.g., SAE ARP5580 and IEC 60812) and inputfrom original equipment manufacturers (OEMs) and theirsuppliers, SAE J1739 includes current terms, requirements,ranking charts, and worksheets for the identification andmitigation of failure mode risks. Examples are given for ablock or boundary diagram (for DFMEA), a process flowdiagram (for PFMEA), and design and process FMEAworksheets related to the auto industry. Also, suggestionsare given in tabulated form for design and process FMEAseverity (S) evaluation criteria as well as those foroccurrence (O) and detection (D) evaluation criteria. Eventhough the risk priority number (RPN) is defined as theproduct S O D, SAE J1739 warns that this number,which ranges from 1 to 1000, should not be used as the solemetric for risk evaluation via thresholding.FMEA and FMECAAnother standard that gives guidance to produce successfulFMEA and FMECA is IEC 60812, which was developed bytheIECtechnicalcommittee56(Dependability) (InternationalElectrotechnicalCommission, 2006a). IEC 60812 is a standard that providessteps, terms, criticality measures (potential risk, risk prioritynumber, criticality matrix), failure modes, basic principles,procedures, and examples for FMEA and FMECA.IEC 60812 advises that while FMECA may be a very costeffective method for assessing failure risks, a probabilityrisk analysis (PRA) is preferable to a FMECA; FMECAshould not be the only basis for judging risks, especiallysince RPNs have deficiencies such as inadequate scaling, asdiscussed in SAE J1739. Also, FMEA has limitations in thatit is difficult and tedious to apply to complex systems withmultiplefunctions (InternationalElectrotechnicalCommission, 2006a).2.2.3. Top-Down MethodsFault Tree Analysis (FTA)FTA is a technique that is helpful in overcoming the currentlimitations of FMEA (SAE International, 2001). FTA is adeductive method used to determine the causes that can leadto the occurrence of a defined outcome, called the ‘topevent’ (International Electrotechnical Commission, 2006b).FTA achieves this goal through use of a fault tree.Construction of the tree is a top-down process thatcontinually approaches the desired lower level ofmechanism and mode. The lowest possible level containsthe primary (bottom) events, the individual causes ofpotential failures or faults (International ElectrotechnicalCommission, 2006b). Thus, FTA identifies potentialproblems caused by design, operational stresses, and flawsin product manufacturing processes. Hence, fault treesshould be developed early during system design andcontinuethroughoutthedevelopmentofaproduct (InternationalElectrotechnicalCommission,2006b).To enable the use of fault tree analysis, the IEC technicalcommittee 56 developed IEC 61025, which addresses thetwo approaches to FTA: a qualitative or logical approach(Method A), used largely in the nuclear industry, and aquantitative or numerical approach (Method B) that resultsin a quantitative probability of the occurrence of a top eventwithin manufacturing and other industries (InternationalElectrotechnical Commission, 2006b). IEC 61025 describesFTA with its definitions (e.g., ‘top event’, ‘gate’, and‘event’), steps (fault tree construction, analysis, reporting,etc.), and fault tree symbols (for static and dynamics gates).IEC 61025 provides the mathematics for reliability of seriesand parallel (redundant) systems, which uses probabilisticdata at the component level from reliability or actual fieldtest data to determine the probability of the occurrence ofthe ‘top event’.Markov AnalysisMarkov analysis is another method to determine thedependability and safety of systems. The IEC technicalcommittee 56 produced IEC 61165, a standard that gives anoverview of the Markov technique (InternationalElectrotechnical Commission, 2006c). Markov techniquesuse state transition diagrams to represent the temporalbehavior of a system, which is a connected number ofelements, each of which has only one of two states: up ordown. The entire system transitions from one state toanother as the system elements fail or are restored accordingto defined rates. IEC 61165 uses symbols from IEC 60050(‘International Electrotechnical Vocabulary’) but definesother fundamental terminology (e.g., ‘up state’ and ‘downstate’), symbols (circles, rectangles, etc.), and mathematicaltechniques (e.g., via ordinary differential equations andLaplace transforms). The standard contains examples for the5805
ANNUALCONFERENCETHEPPROGNOSTICS ANDEALTHMMANAGEMENTSOCIETY20142014A NNUALC ONFERENCEOFOFTHEROGNOSTICSANDHHEALTHANAGEMENTS OCIETYhomogeneous Markov technique, in which the statetransition rates are assumed to be time-independent(International Electrotechnical Commission, 2006c). IEC61165 shows that the differences between the expressionsfor reliability, maintainability, and availability arise fromthe different state transition diagrams used to create theequations. Maintenance strategies can be modeled withMarkov techniques, while other techniques such as fault treeanalysis (FTA) and reliability block diagrams (RBDs) donot account for complex maintenance strategies.Petri Net AnalysisSince their creation in 1962, Petri nets have been used todescribe, design, and maintain a wide range of systems andprocesses in industries including aerospace, banking,manufacturing systems, and nuclear power systems(International Organization for Standardization &International Electrotechnical Commission, 2004). Petri netsare a rigorous method to mathematically describe processesbased on basic set theory (Truss, 1998). Furthermore, Petrinets can be used to generate Markov models. In the 1980s,Petri nets were extended to Higher-level Petri nets (HLPNs)to model discrete-event systems. HLPNs were also used toadvance the use of Petri nets for complex systems,analogous to the use of high-level programming languagesto overcome challenges with assembly languages.To aid the use of HLPNs and facilitate the development ofPetri net software tools, the ISO/IEC 15909-1 standard wasdeveloped by SC 7 (‘Software and system engineering’) ofJTC 1 (‘Information technology’), a Joint TechnicalCommittee (JTC) composed of ISO and IECmembers (International Organization for Standardization /IEC 15909-1 defines a mathematical semantic model,an abstract mathematical syntax for annotations, and agraphical notation for High-level Petri nets (InternationalOrganization for Standardization & InternationalElectrotechnical Commission, 2004). ISO/IEC 15909-1defines terms (such as ‘arc’, ‘multiset’, ‘Petri net’, ‘token’,‘transition’, etc.) and mathematical conventions needed forHigh-level Petri nets and provides the formal concepts ofmarking, enabling, and transition rules needed for HLPNgraphs (HLPNGs) that represent complex processes withinmanufacturing and other industries. ISO/IEC 15909-2defines the transfer format, the Petri Net Markup Language(PNML), to support the exchange of HLPNs (InternationalOrganization for Standardization & InternationalElectrotechnical Commission, 2011).2.3. Measurement TechniquesDependability analysis, whether top-down or bottom-up orsome combination thereof, is used to identify the failuremodes of the system and help manufacturers to determinewhich risks should be mitigated or eliminated. If a failuremode must exist, being unavoidable for system operation,then the failure mode may be monitored or predicted viadiagnostics and prognostics with sensors and establishedmeasurement and analysis techniques. The system designermust be aware of the various measurement techniques andtheir preferred uses based on the accepted experience ofothers.Several standards contain explicit guidelines on the use ofmeasurement techniques for PHM. This section summarizesthose particular standards indicated under the ‘Measurementtechniques’ category within Table 3. However, due to thedetailed nature and variety of measurement techniques, thissection covers only the standards that are relatively generalin scope and application for manufacturing.For example, Annex B of ISO 17359 contains nine tables ofguidance for measurement techniques for various systems,including generators, fans, engines, and pumps(International Organization for Standardization, 2011). Thetables relate the possible faults for each system to theassociated measureable symptoms. For example, ISO 17359reveals that the bearing unbalance of an electric motoraffects the vibration directly, but only impacts the otherdetectable symptoms tangentially. Such tables are essentialfor understanding the basic physical consequences of systemfaults to aid in the selection and positioning of sensors.Similarly, Annex D of ISO 13379-1 relates measurementtechniques and numerous diagnostic models in tabular form(International Organization for Standardization, 2012b). Thecombination of the information from ISO 17359 and ISO13379-1 helps both novices and experts in PHM todetermine the measurement types and associated diagnostictechniques for a given system fault. For example, a bearingunbalance could be detected via vibration monitoring(according to ISO 17359) and analyzed via a subsequentdata-driven statistical method (according to ISO 13379-1).2.4. Diagnostics and PrognosticsDiagnostics is the determination of the current condition ofa component or system, and prognostics is the predictiveability of future performance degradation and expectedfailures (SAE International, 2008). The followingsubsections summarize those particular standards indicatedunder the ‘Diagnostics and Prognostics’ category withinTable 3. The number of standards dedicated to diagnosticsand prognostics is fairly small, offering a significa
Cost Benefit Analysis: IEC 60300 -3 -3, SAE ARP6275 Dependability: IEC 60300 -3 -1, IEC 61703, SAE ARP4761 Bottom -Up Methods: SAE ARP5580, SAE J1739, IEC 60812 Top -Down Methods: IEC 61025, IEC 61165, ISO/IEC 15909 Data Requirements and Management ISO 13374 -1, ISO 13374 -2, ISO 18435 -1, ISO 18435 -2 Measurement Techniques ISO 17359, ISO 13379 -1