Transcription
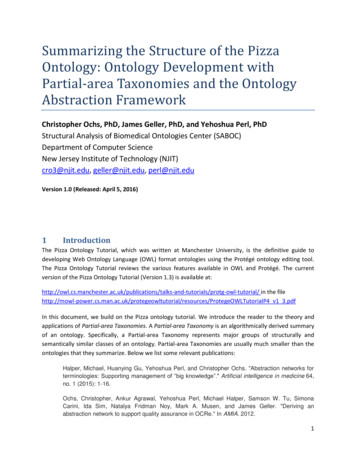
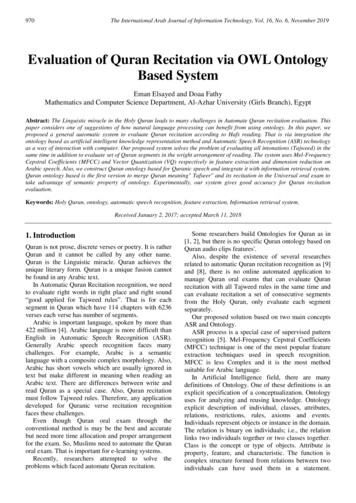
Gene Ontology (GO) Term Enrichment using PANTHER Gene List AnalysistoolsGO Term Enrichment is a tool commonly used to evaluate characteristics of setsof genes, such as those identified from RNA-seq or microarray experiments. Thebasic function takes a set of genes and compares the frequency of GO terms inthe sample set with the frequency of the same set of GO terms in the a referenceset, usually a whole genome set, to identify terms that are over- orunderrepresented in the sample set.TAIR uses a web service, provided by PANTHER DB, to facilitate GO termenrichment analysis for Arabidopsis, and other plant genomes represented in thePANTHER database. PANTHER’s tool accesses a comprehensive list of GOannotations from the GO Consortium that is updated monthly. Becauseannotations are constantly being updated as new information is obtained, themonthly updating schedule ensures that analyses done using the PANTHER toolrely on the most current annotation data.Briefly, the statsThe tool applies the binomial test (Mi, H., 2013) to identify over- orunderrepresented terms in the sample gene set compared to the referencegenome set. The default parameters also apply a Bonferroni correction, acommon statistical method used for multiple comparisons. The Bonferronicorrection is important because the tool performs multiple statistical tests (one foreach pathway, or each ontology term) at the same time. This correction multipliesthe single-test P-value by the number of independent tests to obtain an expectederror rate.How to Perform a Basic Term Enrichment AnalysisA. Enter your gene list (Figure 1)1. Paste in a list of gene identifiers such as AGI Locus IDs (e.g. AT5G61160),UniProt IDs (e.g. Q9FNP9) or NCBI Entrez GeneIDs (e.g. Gene: 836237),separated by newlines or commas. PANTHER provides a complete list ofacceptable identifiers.2. Choose the plant species from which your gene list was derived. Forexample, if your gene list was generated from Arabidopsis thaliana,choose that. If your gene list is from grape, choose Vitis vinifera and so on.3. Select the ontology aspect that you wish to analyze. The options are‘biological process’, ‘molecular function’, and ‘cellular component.’4. Click Submit, to send the data to PANTHER.1GOTermEnrichmentHelp04/25/2017
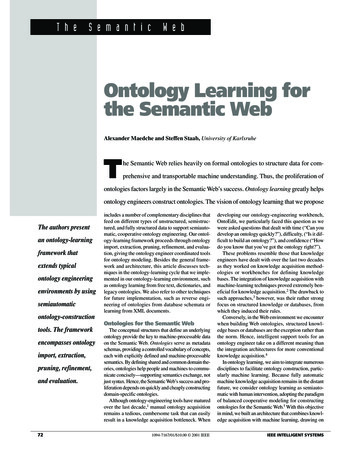
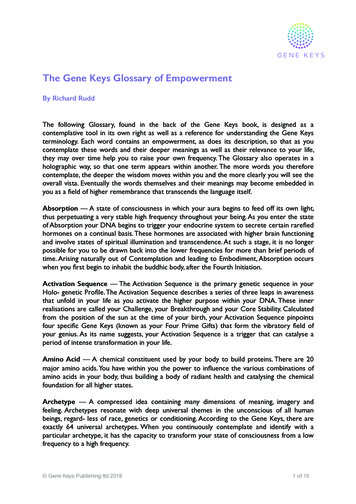
Figure 1. Entering DataB. Understanding the results1. Analysis Summary (Figure 2).A. The analysis summary box displays the analysis type (PANTHERcan do several types of gene list analysis), annotation version andannotation dataset. This information is important to record andreport in your publications, as the same analysis performed withdifferent software versions and different annotation releases mayyield different results.B. Below this section is a list of mapped and unmapped IDs.Unmapped IDs are those that could not be mapped to acorresponding protein record in the PANTHER. PANTHER alsoprovides a list of IDs where multiple IDs mapped to the samePANTHER protein entry. Typically this occurs because more thanone gene produces the same amino acid sequence. You can clickon the number to review each list to see the details.C. Export the result set as a text file to save your data.2GOTermEnrichmentHelp04/25/2017
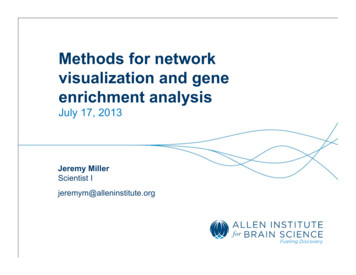
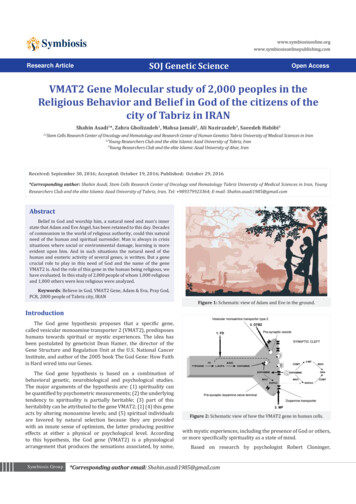
Figure 2. Analysis Summary2. Results table (Figure 3). The default display presents a table of over- orunderrepresented terms presented in an ordered hierarchy. The mostgranular (specific) terms are displayed first with the more general termsbelow. The granular terms are ordered with those having the largest foldchange on top. Clicking any of the column headers allows you to changethe sort order.A. The first column shows the terms. Related terms (i.e. parent-childterms in hierarchy) are grouped by background color, with the mostgranular term at the top. In the example table the most granularterm ‘cytosolic large ribosome subunit’ is shown above the parentterms. If a term has multiple parents- all of paths are shown. If there3GOTermEnrichmentHelp04/25/2017
are duplications in the parent terms (as is the case in the example),they are shown only once. You can invert the sort order by clickingthe term ‘Hierarchy’ in the last column header.B. The next column shows the number of genes (#) in the referencegenome dataset that map to the terms (either directly or throughinheritance).C. The third column shows the number of genes (#) in the samplegene set that map to the GO term (either directly or throughinheritance).D. The fourth column displays the number of genes mapped to theterm that would be expected based on the whole genomerepresentation. For the example shown in Figure 3, if 113/27,352genes in the reference set mapped to cytosolic large ribosomalsubunit, then we would expect the same proportion of genes(0.0041) to map to that term in in the sample set (0.0041 X247 1.02). Clicking on the number will retrieve a list of the genesthat map to the term.E. The fifth and sixth columns show the fold enrichment and if thechange is an increase ( ) or decrease (-). Fold change is calculatedby dividing the observed by expected results.F. The seventh column displays the p value. The lower the p value,the less likely the obtained result can be explained by randomdistribution. By default only p values less than 0.05 are displayed.4GOTermEnrichmentHelp04/25/2017
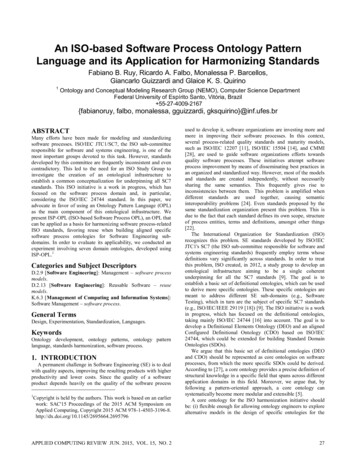
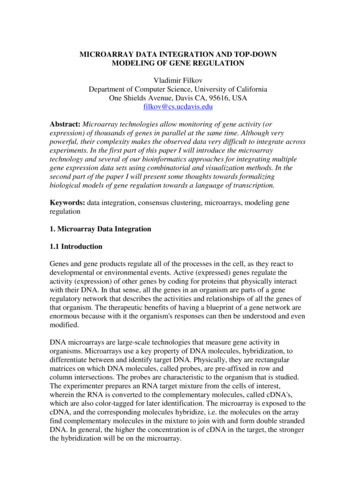
Figure 3. PANTHER Results TableC. Further Analysis. Once you have retrieved your analysis results, there are anumber of other things you can do from the PANTHER site. We list a few optionsbelow. Please see the PANTHER user guide for a complete list of functions.1. Download the gene list from PANTHER for your sample data with addedinformation from the PANTHER database. Next to the hierarchy – click the file name (in Figure 3, it isupload 1) to view the PANTHER entries that correspond to yourgene list (Figure 4). You can customize the output to display anumber of different data fields. 5GOTermEnrichmentHelp04/25/2017
Figure 4. Panther Gene List output2. Run GO term enrichment analysis using different aspects. Go to the Annotation Data Set dropdown menu (Figure 2) andchoose another annotation dataset (for example ‘molecular functioncomplete’ or ‘biological process complete’) from the list and reanalyze your gene list. For GO term enrichment, we recommendusing “GO molecular function complete” or “GO biological processcomplete” or “GO cellular component complete”, these are thedatasets with the complete, up to date GO annotations.6GOTermEnrichmentHelp04/25/2017
Gene Ontology (GO) Term Enrichment using PANTHER Gene List Analysis tools GO Term Enrichment is a tool commonly used to evaluate characteristics of sets of genes, such as those identified from RNA-seq or microarray experiments. The basic function takes a set of genes and compares the frequency of GO terms in