Transcription
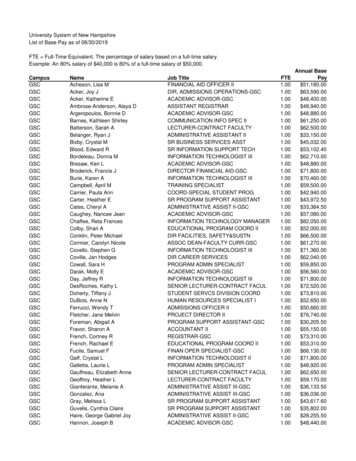
Psychology Productivity wRVUs per FTE(C), VISN Averages FY 201030002500VA Mean Productivity 1,957RVUs per 161942212
Psychology Practice Productivity RVUs per FTE(C) FY 201070006000RVUs per FTE(C)R500040003000VA Mean Productivity 1,957200010000VA Practices in Order of Ascending Productivity
Psychiatry Productivity wRVUs per MD FTE(C), VISN Averages FY 2010400035003000Woork RVUs per MD FTE(C)VA Mean Productivity 2,643*25002000150010005000232119219107*Average of 139 practices, includes only outpatient workload6320VISN12181116515228417
Psychiatry Practice Productivity wRVUs per MD FTE(C) FY 20105,0004,5004,000wRVUs per MD FTE((C)w3,5003,000VA Mean Productivity 2,643*2,5002 0002,0001,5001,0005000VA Practices in Order of Ascending Productivity*Average of 139 practices, includes only outpatient workload
Social Work Productivity wRVUs per FTE(C), VISN Averages FY 201025002000VA Mean Productivity 1,448RVUs per 71648
Clinical Nurse Specialist wRVUs per FTE(c), VISN Averages, FY2010800070006000RVUs per FTE(C))500040003000VA Mean Productivity 9
Nurse Practitioner wRVUs per FTE(C), VISN Averages FY 2010400035003000RVUs per FTE(c))2500VA Mean Productivity 55231722
Physician Assistants wRVUs per FTE(C), VISN Averages FY 2010450040003500RVUs per FTE(C))30002500VA mean Productivity 711710
VHA MentalM t l HealthH lth productivityd ti it adequatedt orhigher in comparison to other specialtieswithin VHA.VHA Mental Health Productivity data appearto be the same or less variable than otherspecialties within VHAVHA.Othi lti studied:t di d All/IlDt lOther VHA ology, Gastroenterology, Radiology, Rheumatology,Cardiothoracic Surgery, General Surgery, Neurosurgery, Urology,Ophthalmology, Orthopedics, Otolaryngology, Plastic Surgery, Vascular
Psychiatrists PsychologistsSocialWorkersNPsCNSPAwRVUs/FTE nc/FTE (C)223115421673125518911232Uniques/FTE 9Black means; Red standard deviationsBlack-
PsychiatristsPsychologistsSocialWorkerswRVUs/FTE FTE C2003 Workload Us/FTE2845 39792845-39792349 32362349-32363236 38453236-3845Encounters280017401740500240300Uniq es/FTEUniques/FTE
Psychiatrists PsychologistsSocialWorkersNPsCNSPAwRVUs/FTE Enc/FTE (C)182715491575149320241666Uniques/FTE 9Black means; Red standard deviationsBlack-
257819511474Enc/FTE C223115421673FY 20062006 MGMAPsychiatristsPsychologistsSocial TE25891827NAPriv. Enc/FTE219712631219Aca. Enc/FTE1809NANA
264319571448Enc/FTE C182715491575FY 20082008 MGMAPsychiatristsPsychologistsSocial WorkersPriv. wRVUs/FTE352824492205Aca. wRVUs/FTE31661581NAPriv. Enc/FTE190111471117Aca. Enc/FTE1033NANA
Productivity and staffing studies conducted thus far (Primary Care,Radiology,Radiology Surgical and Medicine Specialties) have conducted amodifier survey to collect information regarding the practice (facility)characteristics hypothesized to be related to productivity andstaffing. These surveys have contained the following elements: Teaching Mission – number and PGY level of residents. Support Staff – number, type of support staff and supportstaff functions Facility Infrastructure – programs and physical plant (i.e.,exam rooms) Patient Characteristics – DCG risk scores, SHEP,demographics, applicable performance measures.
Current work analyzing 75 possible modifiervariables:– Support staff (20 variables)– Practice characteristics (18 variables)– Patient characteristics (24 variables)– Facility types (5 variables)– Waiting times (3 variables using old 30 daystandard)bl )– Access (6 variables)
HosHhhhhhhHFacility Complexity Analysis(FY2010)HComplexity Group1aComplexityGroup 1bComplexity Group1cComplexityGroup 2ComplexityGroup 3Psychiatrist wRVUs2705 ((22.5))2777 ((15.8))2844 ((12.3))2505 ((9.6))2414((6.3))Psychologist wRVUs2004 (25.1)1901 (19.3)2104 (15.2)1752 (10.7) 1794(7.9)Social Worker wRVU1422 (31.9)1368 (27.4)1420 (21.7)1287 (15.2) 1363 (13.2)CNS wRVUs2194(3.8)2286(2.6)3342(1.2)2923 (1.6)2153(1.6)NP wRVUs1586(5 6)(5.6)1629(4 1)(4.1)2002(3 4)(3.4)1389 (2.6)(2 6)1465(2)PA wRVUs2191(1.0)1072(1.5)2555(1.0)2248 (1.1)1979(1.4)Productivity annual values/FTEC; ( ) average total FTEC
Data validation Totally dependent on quality of data entered into NationalDatabase Workload- encounter forms, cpt codes Workforce- labor mapping, person class designation
0 wRVU CPT codes 20% of clinical activity reported by Social Worker 10% of clinical activity for all other disciplines OMHS Workgroup RRecommendationsd tiffor addingddivalueltto selectl t codesd andd usingialternative CPT codes when appropriate Also looked at Behavioral Health Codes and Evidence BasedTherapies
Inpatient WorkloadVHA Directive 2009-002, PATIENT CARE DATACAPTURE , January 23,23 2009 Mandated inpatientpworkload capturepat the samelevel as outpatient workload for mental health LIPs. Encounter forms Event capture Coders
Quality, Access, Outcomes Data from other health care specialties havesuggested larger VHA panel sizes associated with:––––No change in patient overall satisfactionLower primary care costsLonger waitsDecreases in quality measure scoresWill current metrics effort in mental healthallow similar analyses in the future?
Data from other health care specialties havesuggestedVHA panell sizesassociatedt d largerlii t dwith:––––No change in patient overall satisfactionLower primary care costsLonger waitsDecreases in quality measure scoresWill current metricsi effortffiin mentall hhealthlhallow similar analyses in the future?
Direct care only Outpatient care only wRVUs primary metric Target productivity at the facility level, notindividual provider levelTarget a range, not a specific number (e.g.,median,, mean))
Strengths wRVUs- a common metric allowing for the comparison ofdiverse practices across disciplines Data collected exactly the same for all sites Data collected exactly the same within each individualdiscipline Data collected nationally rather than by each individualfacility or VISN
Challenges Absence of national business rules for the reporting ofworkload and labor mapping For associated mental health care providers, workload andworkforce data are collected from different sources Nationally, productivity can be seen at the individualprovider level only for psychiatristspsychiatrists. No single metric tells the whole story
ppVACO Review and Approvalof Draft DirectiveEstablishing Mental Health ProductivityStandards/Guidance Buy-in from all affected disciplines/ VACOleadership Determine metric value and range Decide outstanding issues: 0 wRVU codes .
Develop National Business Rules forCapturing and Reporting Mental HealthW kl d andWorkloaddLLaborb MMappingiCreate a tool to provide data on a quarterlybasis to the field and VACO.
Incorporate inpatient productivityNational labor mapping data at the individualprovider level for all professions studiedIdentify relationship between productivity andother important domains (quality/access)
Psychiatrists Psychologists Social Workers wRVUs/FTE C 2643 1957 1448 Enc/FTE C 1827 1549 1575 FY 2008FY 2008- MGMA Psychiatrists Psychologists Social Workers Priv. wRVUs/FTE 3528 2449 2205 Aca. wRVUs/FTE 3166 1581 NA Priv. Enc/FTE 1901 1147 1117 Aca. Enc/FTE 1033 NA NA


![4535&(* '3.&803, '03 %&.* 41 & ] - University of Virginia](/img/39/uvaacademicspaceframeworkplan.jpg)