Transcription
Geomatics, Natural Hazards and RiskISSN: (Print) (Online) Journal homepage: https://www.tandfonline.com/loi/tgnh20A correlational research on developing aninnovative integrated gas warning system: a casestudy in ZhongXing, ChinaRobert M. X. Wu, Wanjun Yan, Zhongwu Zhang, Jinwen Gou, Jianfeng Fan,Bao Liu, Yong Shi, Bo Shen, Haijun Zhao, Yanyun Ma, Jeffrey Soar, XiangyuSun, Ergun Gide, Zhigang Sun, Peilin Wang, Xinxin Cui & Ya WangTo cite this article: Robert M. X. Wu, Wanjun Yan, Zhongwu Zhang, Jinwen Gou, Jianfeng Fan,Bao Liu, Yong Shi, Bo Shen, Haijun Zhao, Yanyun Ma, Jeffrey Soar, Xiangyu Sun, Ergun Gide,Zhigang Sun, Peilin Wang, Xinxin Cui & Ya Wang (2021) A correlational research on developing aninnovative integrated gas warning system: a case study in ZhongXing, China, Geomatics, NaturalHazards and Risk, 12:1, 3175-3204, DOI: 10.1080/19475705.2021.2002953To link to this article: https://doi.org/10.1080/19475705.2021.2002953 2021 The Author(s). Published by InformaUK Limited, trading as Taylor & FrancisGroup.Published online: 12 Nov 2021.Submit your article to this journalView related articlesView Crossmark dataFull Terms & Conditions of access and use can be found ation?journalCode tgnh20
GEOMATICS, NATURAL HAZARDS AND RISK2021, VOL. 12, NO. 1, 002953A correlational research on developing an innovativeintegrated gas warning system: a case study inZhongXing, ChinaRobert M. X. Wua,b†, Wanjun Yanc†, Zhongwu Zhanga‡, Jinwen Gouc‡, JianfengFana, Bao Liuc, Yong Shic, Bo Shend, Haijun Zhaoc, Yanyun Mac, Jeffrey Soare,Xiangyu Sunf, Ergun Gideb, Zhigang Sunc, Peilin Wangg, Xinxin Cuih andYa WanggaSchool of Geographical Sciences, Shanxi Normal University, Taiyuan, China; bSchool of Engineeringand Technology, Central Queensland University, Sydney, Australia; cShanxi Fenxi Mining ZhongxingCoal Industry Co. Ltd, Lvliang, China; dGENEW Technologies Co. Ltd, Shenzhen, China; eSchool ofBusiness, University of Southern Queensland, Springfield, Australia; fXiShan Coal Electricity GroupDongQu Coal Mine, Taiyuan, China; gShanxi Kailain Technology Co. Ltd, Taiyuan, China; hSchool ofMedicine, Zhejiang University, Hangzhou, ChinaABSTRACTARTICLE HISTORYGas explosions and outbursts were the leading types of gas accidents in mining in China with gas concentration exceeding thethreshold limit value (TLV) as the leading cause. Current research isfocused mainly on using machine learning approaches for avoidingexceeding the TLV of the gas concentration. no published reportswere found in the literature of attempts to uncover the correlationbetween gas data and other data to predict gas concentration. Thisresearch aimed to fill this gap and develop an innovative gas warning system for increasing coal mining safety. A mixed qualitativeand quantitative research methodology was adopted, including acase study and correlational research. This research found thatstrong correlations exist between gas, temperature, and wind. Itsuggests that integrating correlation analysis of data on temperatureand wind into gas would improve warning systems’ sensitivity andreduce the incidence of explosions and other adverse events. AUnified Modeling Language (UML) model was developed by integrating the Correlation Analysis Theoretical Framework to the existing gas monitoring system for demonstrating an innovative gaswarning system. Feasibility verification studies were conducted toverify the proposed method. This informed the development of anInnovative Integrated Gas Warning System which was deployed foruser acceptance testing in 2020.Received 3 February 2021Accepted 2 November 2021KEYWORDSCase study; correlationalresearch; gas monitoringsystem; machine learning;warning systemCONTACT Robert M. X. Wurobert wumx@hotmail.comSupplemental data for this article is available online at he first two authors contributed to the first authorship equally to this paper.‡The two authors (third and fourth) contributed to the second authorship equally to this paper.ß 2021 The Author(s). Published by Informa UK Limited, trading as Taylor & Francis Group.This is an Open Access article distributed under the terms of the Creative Commons Attribution License (http://creativecommons.org/licenses/by/4.0/), which permits unrestricted use, distribution, and reproduction in any medium, provided the original work isproperly cited.
3176R. M. X. WU ET AL.1. IntroductionChina is the world’s largest coal producer and has the fourth largest coal reserves. Itscoal output remained at similar levels in 2020 as in 2019 to 3,690 MT whichaccounted for about 46% of global coal production (Hutzler 2020; IEA 2020). Coalmine methane is produced or emitted in association with coal mining activities eitherfrom the coal seam itself or from other gassy formations underground, and hasalways been considered as a danger for underground coal mining as it can create aserious threat to mining safety and productivity due to explosion risk (Karacan et al.2011, 121). The methane gas is referred to as gas in this paper. Gas explosions andoutbursts were the leading types of gas accidents in China with a significant severitycompared to other types of coal mine accidents (Wang et al. 2014, 113). Among allthe gas disasters, gas concentration exceeding the limit is the leading cause (Zhanget al. 2020, 1). Gas monitoring systems are deployed widely in China’s coal mineindustry. They are believed to have contributed to a decrease in gas accidents from414, with the death toll reached 2171 in 2005 to 7, with the death toll reached 30 in2020 (China Coal Safety 2021). Hazardous accidents are still a problem in underground gassy mines and there is a need for more robust monitoring and early-warning systems for improving coal mining safety (Jo et al. 2019, 183).Most of the current published research is focused on exploring the methods andframework for avoiding reaching or exceeding the threshold limit value (TLV) of thegas concentration from viewpoints of impacts on geological conditions and coal mining working-face elements. In practice, the existing gas monitoring systems detectedmainly real-time data obtained from gas sensors. If the gas data outputs reach orexceed TLV, the gas monitoring system will alert the mine’s safety-responsive team.No published papers were found that reported on systems that utilized the collectedcoal mine data fully; it appears no attempt has been made to uncover the correlationbetween gas concentration and other data and apply them to predict gas concentration (Zhang et al. 2020, 1, 2).This research aimed to fill this gap and develop an innovative gas warning systemfor increasing production safety in the underground coal mining industry. Thisresearch proposes that integrating data on different variables into gas would improvewarning systems’ sensitivity and reduce the incidence of explosions and other adverseevents. The mixed qualitative and quantitative research methodology was adopted,including a case study, the boxplot technique, and correlational research. The following sections include the literature review, a case study, data analysis, correlationalresearch and research outcomes, conclusions, limitations, and further research.2. Literature reviewThe literature review indicated that most of the current published research focusedmainly on analyzing gas data to explore the methods and framework for avoidingexceeding the TLV of the gas concentration from viewpoints of impacts on geographic and coal mining environments. Traditional research focused on analyzing gasdata to explore the impacts on geographic and coal mining environments. The current study focused machine learning (ML) models or algorithms (including deep
GEOMATICS, NATURAL HAZARDS AND RISK3177learning) to explore warning models for predicting gas emissions and gasconcentrations.2.1. Related worksTraditional research used the traditional methods and framework from viewpoints ofimpacts on geographic and coal mining environments. They monitored the risk signalsby gas monitoring systems to avoid reaching or exceeding the TLV of the gas concentration. 1 Oct 2019 State Administration of China Coal Safety prevention regulations forCoal and Gas Outburst addressing a limited range of measures, including initial seamgas pressure (P/MPa 0.74), a consistent coefficient (f 0.5), and initial rate of methanediffusion (䉭p 10) (China Coal Safety 2019, 3–4). A number of techniques and methodshave been used to reduce coal mine risks by monitoring acoustic emission signals, electric radiation, gas emission, and micro-seismic on the physical properties of sound, electricity, magnetism, thermal, and gas (Zhao et al. 2020, 1981).This research conducted three rounds of literature reviews to explore the state ofresearch into gas warning systems in underground coal mining. This first-round literature review focused on literature published in Scopus and initially searched 69papers between 2016 and 2021. The second-round literature reviewed Chineseresearch publications indexed in China National Knowledge Infrastructure (CNKI2019). Two hundred and ninety-two articles were initially found. The third-roundsearch was then conducted via China’s literature search agency of science and technology (LSAST), which China’s Department of Education accredited (LSAST 2020).Two hundred papers and report documents were initially filtered. The searched outcomes clearly showed that China’s scholars conducted most research in the field ofcoal mining. After reviewing the abstract, all publications written in Chinese wereeliminated. Twenty-three related articles were reviewed, including Ma and Zhu(2016), Fan et al. (2017), Ma and Dai (2017), Zhang et al. (2017), SleR zak et al.(2018), Viswasmayee et al. (2018), Xia et al. (2018), Gu et al. (2019), Jo et al.(2019), Song et al. (2019), Xie et al. (2019), Sun and Li (2020), Tutak and Brodny(2019), Wang et al. (2019), Wang et al. (2020), Wu et al. (2020), Liu et al. (2020),Zhang et al. (2020), Zhang et al. (2020a), Zhao et al. (2020), Lu et al. (2021), Youet al. (2021), and Zhang et al. (2021). Among them, fourteen studies focused ontemperature, wind, dust, C2H2, CO2, CO, O2, humidity, and other parameters topredict gas concentrations, including Ma and Zhu (2016), Fan et al. (2017), Zhanget al. (2017), Xia et al. (2018), Jo et al. (2019), Song et al. (2019), Tutak andBrodny (2019), Wang et al. (2019), Sun and Li (2020), Wang et al. (2020), Zhanget al. (2020), Zhang et al. (2020a), Zhao et al. (2020), and Zhang et al. (2021).They will be discussed in the following section 6.2 Discussion.2.2. Related works machine learningThe literature showed that, ML approaches were used widely to analyze and harnessthe power of the enormous amount of information (Chan et al. 2020, 375). Theywere extensively used for complex problems in a variety of fields where existing
3178R. M. X. WU ET AL.solutions require a lot of hand-tuning, and for problems which there is no solution atall using a traditional approach (Morocho-Cayamcela et al. 2019, 137185; Arangoet al. 2021, 993). ML has also been widely used to explore a vast number and typesof predictor variables in terms of prediction ability (F eret et al. 2019, 2, 11; Arangoet al. 2021, 993). In the coal mining industry, research mainly focused on the MLalgorithms and methods of predicting gas emissions and gas concentrations (Ma andZhu 2016, 1). However, ML is challenging to develop a more efficient and accurategas concentration prediction system (Zhang et al. 2020, 10).Three disadvantages were raised at least for using ML methods for predicting gasmissions and gas concentrations. The first disadvantage is that the poorly datasetinputs will result in inadequate outputs. ML involves providing data to a computerthat can be ‘trained’ with known or predefined features or objects that allow detection, classification, or pattern recognition in a semi-automated or automated manner (Sagan et al. 2020, 3). ML-based prediction models are highly influenced andrelated to the training dataset (F eret et al. 2019, 11; Boukerche and Wang 2020,18). The dataset input quality determines the output quality (Chan et al. 2020,378). The research highlights the strong influence of the training dataset onmachine-learning methods’ performances (F eret et al. 2019, 11). Therefore, buildingML on low-quality data sources and inadequate training samples will lead to drawing wrong, misleading inferences, and inferior outputs (Sagan et al. 2020, 3;Moghadasi et al. 2021, 881).Another drawback is that ML-based prediction results could not accurately beinterpreted. ML approaches differ from the traditional statistical tools that researchersare trained to apply and interpret based on established reporting standards (e.g., Pvalue for statistical significance) (Bonanni 2019, 165). ML models can be comparedto a black box that takes in inputs to produce outputs with no explanation necessarilyof how it produced the outputs and cannot be able to provide better definitions ofthe problem (Jarrett et al. 2019, 7; Chan et al. 2020, 378). Unexplainable ML modelsfor modeling physical phenomena can lead to inaccurate outputs (Sagan et al.2020, 3).One more challenge is the high cost of the computing hardware for improving theefficiency and effectiveness of the ML model. Existing coal mine systems rely toomuch on a computer center (Zhang et al. 2020, 1). The ML models are consistentlyimplemented on a graphic processing unit (GPU) within the computing hardware,which costs a lot to ensure the models can be trained and run at a relatively highspeed (Boukerche and Wang 2020, 18–19).Due to the above three disadvantages, therefore, this research does not recommendusing ML methods to explore the early warning system for a single coal mine. Theycould not interpret the prediction results. The literature search did not also find existing alarms or warning systems incorporating correlation analysis of gas data and dataacquisition from other sensors.Overall, the up-to-date literature search did not find existing studies on warningsystems incorporating correlation analysis of gas data and data acquisition from othersensors. No attempt was made to uncover the correlation between gas concentrationand other data and apply them to predict gas concentration (Zhang et al. 2020, 1, 2).
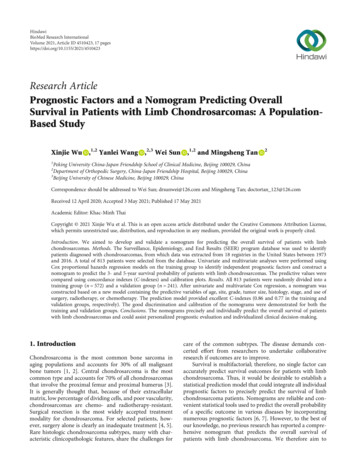
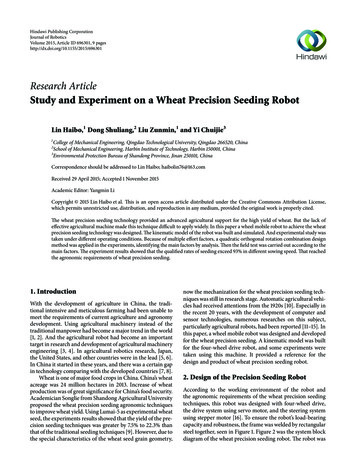
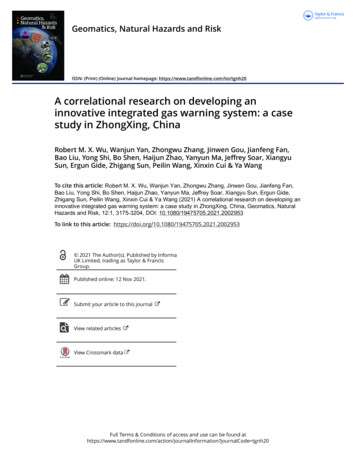
GEOMATICS, NATURAL HAZARDS AND RISK3179Figure 1. The geographical location of the case study mine in China.The current gas monitoring systems do not analyze whether other sensors’ outputsaffect gas data and lack correlational research integrating temperature, wind, and dustinto gas variables.3. Case study3.1. Current gas monitoring system in the case study mineThis research Case Study mine was Shanxi Fenxi Mining ZhongXing Coal IndustryCo. Ltd (ZhongXing) – a large coal mining company in China. ZhongXing wasowned wholly by Shanxi Coking Coal Group Co. Ltd, with a designed mining capacity of three million tons per year. Shanxi Coking Coal Group Co. Ltd. was ranked485th in the 2020 Fortune Global 500 and was the largest coking coal mining company and the largest coking coal supplier in China (SXCC 2020). Other coal mines inChina mainly adopted similar systems to the gas monitoring systems deployed inZhongXing. The research on the Case Study mine may better understand China’s current gas monitoring systems. Figure 1 shows the geographical location of the CaseStudy mine in China.The existing gas monitoring system in the Case Study mine monitors seven datatypes obtained from gas sensors, temperature sensors, wind sensors, dust sensors, O2sensors, CO sensors, and CO2 sensors. Figure 2 shows the current gas monitoringsystem in The Case Study mine. The current gas monitoring systems focus on detecting real-time data obtained from gas sensors and do not analyze whether othersensors’ outputs affect gas data. If gas data are meeting the standard, the data outputsare forwarded to the monitoring system. If the gas data outputs reach and exceedingthe TLV, the system will alert the safety-responsive team. Data outputs of temperature, wind, dust, O2, CO, and CO2 are communicated to the monitoring system.These are not included in any risk analysis between the different types ofdata outputs.
3180R. M. X. WU ET AL.Figure 2. Current gas monitoring system in the case study mine.Among the seven types of sensors, the data outputs of O2, CO, and CO2 havealmost measured no variations and maintained at a constant level from the currentgas monitoring system in the Case Study mine. There is no value to be investigated.This research focused on gas, temperature, wind, and dust. Figure 3 shows the location of the sensors installed in the Case Study mine. There are 21 gas sensors (fromT1 to T21), 16 temperature sensors (from WD 1 to WD16), 10 wind sensors (fromFS1 to FS10), and 2 dust sensors (from FC1 to FC2). The sensors’ gas, temperature,wind, and dust codes can be seen in Tables 1–4, respectively.3.2. Research methodologyThe mixed qualitative and quantitative research methodology was adopted in this research,including a case study, boxplot technique, and correlational research. It is critical to eliminate extreme values and outliers before conducting data analysis to real-time data streams.Extreme values and outliers may substantially influence most parametric tests on the statistical analysis, leading to distortion and possibly inaccurate conclusions (Schwertman et al.2004, 165–166, 173). The boxplot technique is used to eliminate extreme values and outliers. The boxplot technique of exploratory data analysis is better adopted for respondingto variation in generalized extreme value distribution shape parameters (Babura et al.2018, 2). It is well known that outliers, observations that are presumed to come from adifferent distribution than that for most of the data set (Schwertman et al. 2004, 165). Theextensive literature on the subject of outliers attests to its relevance as a significant concernin the statistical analysis of data, which can profoundly influence the statistical analysisand often lead to erroneous conclusions (Schwertman et al. 2004, 165, 166). Boxplot technique is also a simple way commonly employed to identify outliers and has employed aresistant rule for identifying possible outliers in a single batch of the univariate dataset(Schwertman et al. 2004, 166; Babura et al. 2018, 1).Several statistical significance levels have been accepted for hypothesis testing,including 0.05, 0.01, and 0.001 in social science studies (Wu et al. 2012, 8). P-valuesof 0.05 are mostly considered acceptable for ‘significance’ to determine whether ornot to reject the null hypothesis (Nahm 2017, 242). However, it is often argued thatthe p-value only provides information on how incompatible the data are concerningthe null hypothesis; Still, it does not give any information on how likely the datawould occur under the alternative hypothesis (Shi and Yin 2020, 1). The smaller thesignificance value, the lower the risk of rejecting the null hypothesis when it is true;this needs to be balanced by the risk of accepting the null hypothesis when it is not
GEOMATICS, NATURAL HAZARDS AND RISK3181Figure 3. The sensors installed in the case study mine.Table 1. Code of gas sensors (from T1 to T21).No.T1T2T3T4T5T6T7T8T9T10T11Gas sensor nameThree mining total wind-backalley TThree mining auxiliary windback alley TThree mining east wing windback alley TThree mining emergencyshelter Back transitionroom TThree mining emergencyshelter front transitionroom TThree mining emergencyrefuge survival room TFour mining water binworking face TFour mining water bin windback alley TFour mining water bin airvent TFour mining water bin fanfront TFour mining water binmixing TCodeT010101No.T12Gas sensor nameFour mining trackway 500 mrefuge chambers TFour mining trackway airvent TFour mining trackway fanfront TFour mining trackwayworking face 16Four mining trackwaywind-back alley 03T20T010204T21Four mining trackwaymixing TFour mining trackwaymiddle TFour mining trackwaydownwind side of therig TFour mining north wingwind-back alley TFour mining belt lanes coalbin T010205true (Malhotra et al. 2006, 581). A p-value of 0.01 was often considered highly significant (Benjamin and Berger 2019, 189). This research adopted the value of 0.01 as thecut-off for the significance level to lower the risk of rejecting the null hypothesis.Correlational research is a research method in which the researcher measures twovariables and assesses the statistical relationship (i.e., the correlation) between themwith little or no effort to control extraneous variables (Price et al. 2017, 107). Thismethod can be used in any study that does not wish to manipulate the investigatedindependent variables (Curtis et al. 2016, 21). As a quantitative research method, correlational research results can inform causal inferences and evidence-based practiceand then subject them to an experimental study (Thompson et al. 2005, 182, 190).When the correlational research method is adopted, correlation analysis will beundertaken to confirm a strong relationship between the data. It can find comprehensive results to find a linear relationship between linear-dependent variables if it exists;It can give a solid indicator to interpret a strong nonlinear relationship between nonlinear-dependent variables (Al-Rousan et al. 2021, 461) and indicate that two variablesare influenced by a common underlying mechanism (Messerli 2012, 1563).
3182R. M. X. WU ET AL.Table 2. Code of temperature sensors (from WD1 to WD16).No.Temperature sensor nameCodeNo.Temperature sensor nameWD1Three mining Total wind-backalley WDThree mining auxiliary windback alley WDThree mining East Wingwind-back alley WDThree mining EmergencyShelter Back TransitionRoom WDThree mining EmergencyShelter Front TransitionRoom WDThree mining EmergencyRefuge Survival Room WDThree mining trackway winchhouse WDThree mining waitingroom WDWD010101WD9WD010109WD010102WD10Three mining Infinityrope WDThree mining substation WDWD010103WD11Three mining belt lanes WDWD010111WD010104WD12Four mining water binwind-back alley WDWD010201WD010105WD13Four mining trackway 500 mRefuge Chambers WD16Four mining trackwaywind-back alley WDFour mining North Wingwind-back alley WDFour mining Infinity ropeRefuge Chambers 1Table 3. Code of wind sensors (from FS1 to FS10).No.Wind sensor nameCodeNo.FS1Three mining Total wind-backalley FSThree mining auxiliary windback alley FSThree mining East Wingwind-back alley FSThree mining trackwaymiddle FSThree mining West WingOrbital Lane Belt LaneDuplex Lane 0105FS10FS2FS3FS4FS5Wind sensor nameFour mining water bin airvent FSFour mining water binwind-back alley FSFour mining trackway airvent FSFour mining trackwaywind-back alley FSFour mining North Wingwind-back alley re 4 shows the research flowchart processes in this research. They started bydesigning a proposed research framework based on the current gas monitoring system, including alarming sub-system and monitoring sub-system, collecting data, conducting data analysis and correlation analysis, probing research outcomes, andexploring an innovative integrated gas warning system.3.3. Research frameworkThis research aimed to uncover hidden patterns and correlations between gas, temperature, wind, and dust. This research proposed integrating data on temperature,wind, and dust into gas would improve warning systems’ sensitivity and reduce theincidence of explosions and other adverse events. Figure 5 shows the proposedresearch framework comprising the correlation analyses between the gas (from T1 toT21) and gas, gas and temperature (from WD1 to WD16), gas and wind (FS1 toFS10), and gas and dust (FC1 and FC2).When focusing on the correlation analyses of gas and gas, the dependent variableis gas. The independent variables are other gases. For example, when T1 was thedependent variable, other 20 gases (from T2 to T21) would be independent variables.
GEOMATICS, NATURAL HAZARDS AND RISK3183Table 4. Code of dust sensors.No.Dust sensor nameCodeFC1FC2Four mining water bin working face FCFour mining trackway wind-back alley FCFC010201FC010301A correlation analysis would examine whether T1 was affected by the changes fromT2 to T21. When focusing on the correlation analyses of gas and temperature, gasand wind, or gas and dust, the dependent variable is gas. The independent variablesare temperature, wind, or dust. The correlation analysis would examine whether gasdata was affected by the changes from sixteen temperature sensors, two wind sensors,or two dust sensors.3.4. Data collectionThe research data was collected from the gas monitoring system installed in MineNo.4 North in the Case Study mine. Data collection occurred at an interval of15 seconds. 65,535 data points were initially obtained from each sensor between00:00:00 am on 25 September 2020, and 20:48:00 am on 16 October 2020. 3,211,215data points in total were obtained from 49 sensors, including gas sensors (21), temperature sensors (16), wind sensors (10), and dust sensors (2).4. Data analysisData pre-processing was conducted first. Reliability and exploratory factor analyseswere then undertaken separately between gas and gas, gas and temperature, gas andwind, and gas and dust. The correlation analysis was performed between the resultsRRof the above data analysis. IBMVSPSSVStatistics version 26 was used fordata analysis.4.1. Data pre-processingThe raw data gathered in most industrial processes usually comes with many otherquality issues such as out-of-range values, outliers, noises, errors in measurement,missing values, etc. (Moghadasi et al. 2021, 881). Data pre-processing is a necessaryprocedure before conducting data analysis to real-time data streams. It consists oftransforming the data values of a specific dataset, aiming to optimize the informationacquisition and process; at the same time, there is a massive contrast between themaximum and minimum values of the dataset, so normalizing the data minimizes thecomplexity of the algorithm for its corresponding processing (Larriva-Novo et al.2021, 6). Data pre-processing will focus on the raw data and cover three data cleaningprocedures, including eliminating extreme values, eliminating outliers, and standardizing data.Extreme data values (also called extreme values in this paper) were considered theout-of-range values in this research. The extreme values can lead to substantiallybiased inference and cannot be omitted (Barlow et al. 2020, 765). Other data qualityissues such as noises, errors in measurement, missing values, etc., will be solved by
3184R. M. X. WU ET AL.Figure 4. Research flowchart.updating better hardware devices such as sensors in the gas monitoring system andadopting more effective data collection algorithms. They will not be mainly discussedin this research. Anomaly data were mainly observed as the outliers presumed tocome from a different distribution than those for most of the dataset (Schwertmanet al. 2004, 165). Outliers come from the other distribution than that for most of thedatasets, may have substantial influence in most parametric tests, which can profoundly influence the statistical analysis and often lead to distortion and possiblyinaccurate and erroneous conclusions (Schwertman et al. 2004, 165–166, 173).Anomaly data will be considered as outliers in this research. The most commonmethods for standardizing data include z-score normalization, min-max standardization, and distance to target normalization, and raking ranking normalization)(Larriva-Novo et al. 2021, 2; Luana et al. 2021, 3). Z-score normalization method willbe used in this research. The reason is that a data standardization based on the scaling of variables using the z-score algorithm may increase the outcomes’ precision
GEOMATICS, NATURAL HAZARDS AND RISK3185Figure 5. Proposed research framework.comparing other techniques (Larriva-Novo et al. 2021, 12). Therefore, before conducting data analysis for the real-time datasets, the boxplot technique of exploratorydata analysis was used to eliminate extreme values and outliers. Data standardizationwas then followed as data were collected from the different sensors with a variety ofmeasurements.After data pre-processing, 9,430 data points for each sensor and 462,070 in totalwere finally forwarded into the reliability and exploratory factor analysis procedures.The time series of the dataset outputs of all sensors can be seen in Appendices 1–4(Supplementary material).4.2. Data analysis between gas and gasThe reliability and exploratory factor analyses were conducted between 21 items (T1to T21). As a result, three correlational groups were found and satisfactorily met thestandards of the reliability and exploratory factor analyses (Table 5). All values ofCronbach’s Alpha (0.869, 0.919, and 0.955) were considered to have very good reliability (above 0.8). In the exploratory factor analysis test, all values of Kaiser-MeyerOlkin (KMO) (0.839, 0.889, and 0.932) were considered a perfect measure (greaterthan 0.8). Bartlett’s test of sphericity was 0.000 (p 0.001). All average communalitymeasures were adequate (greater than 0.6); all anti-image Correlations values weremore significant than 0.5.4.3. Data analysis between gas and temperatureThe reliability exploratory factor analyses were conducted between gas and temperature, including 21 gas items (T1 to T21) and 16 temperature items (WD1 to WD16).As a result, sixteen correlat
A correlational research on developing an innovative integrated gas warning system: a case study in ZhongXing, China Robert M. X. Wua,b†, Wanjun Yanc†, Zhongwu Zhanga‡, Jinwen Gouc‡, Jianfeng Fana, Bao Liuc, Yong Shic, Bo Shend, Haijun Zhaoc, Yanyun Mac, Jeffrey Soare, Xiangyu Sunf, Ergun Gi