Transcription
de Muinck et al. Microbiome (2017) 5:68DOI 10.1186/s40168-017-0279-1METHODOLOGYOpen AccessA novel ultra high-throughput 16S rRNAgene amplicon sequencing librarypreparation method for the Illumina HiSeqplatformEric J. de Muinck1†, Pål Trosvik1†, Gregor D. Gilfillan2, Johannes R. Hov3 and Arvind Y. M. Sundaram2*AbstractBackground: Advances in sequencing technologies and bioinformatics have made the analysis of microbialcommunities almost routine. Nonetheless, the need remains to improve on the techniques used for gathering suchdata, including increasing throughput while lowering cost and benchmarking the techniques so that potentialsources of bias can be better characterized.Methods: We present a triple-index amplicon sequencing strategy to sequence large numbers of samples atsignificantly lower c ost and in a shorter timeframe compared to existing methods. The design employs a twostage PCR protocol, incorpo rating three barcodes to each sample, with the possibility to add a fourth-index. It alsoincludes heterogeneity spacers to overcome low complexity issues faced when sequencing amplicons on Illuminaplatforms.Results: The library preparation method was extensively benchmarked through analysis of a mock community inorder to assess biases introduced by sample indexing, number of PCR cycles, and template concentration. Wefurther evaluated the method through re-sequencing of a standardized environmental sample. Finally, we evaluatedour protocol on a set of fecal samples from a small cohort of healthy adults, demonstrating good performance in arealistic experimental setting. Between-sample variation was mainly related to batch effects, such as DNA extraction,while sample indexing was also a significant source of bias. PCR cycle number strongly influenced chimeraformation and affected relative abundance estimates of species with high GC content. Libraries were sequencedusing the Illumina HiSeq and MiSeq platforms to demonstrate that this protocol is highly scalable to sequencethousands of samples at a very low cost.Conclusions: Here, we provide the most comprehensive study of performance and bias inherent to a 16S rRNAgene amplicon sequencing method to date. Triple-indexing greatly reduces the number of long custom DNAoligos required for library preparation, while the inclusion of variable length heterogeneity spacers minimizes theneed for PhiX spike-in. This design results in a significant cost reduction of highly multiplexed ampliconsequencing. The biases we characterize highlight the need for highly standardized protocols. Reassuringly, we findthat the biological signal is a far stronger structuring factor than the various sources of bias.Keywords: 16S rRNA gene amplicon sequencing, Illumina library preparation, Indexed PCR, Mock community,Environmental sequencing, Benchmarking, PCR bias, Chimera formation* Correspondence: arvind.sundaram@medisin.uio.no†Equal contributors2Department of Medical Genetics, Oslo University Hospital and University ofOslo, Oslo, NorwayFull list of author information is available at the end of the article The Author(s). 2017 Open Access This article is distributed under the terms of the Creative Commons Attribution 4.0International License (http://creativecommons.org/licenses/by/4.0/), which permits unrestricted use, distribution, andreproduction in any medium, provided you give appropriate credit to the original author(s) and the source, provide a link tothe Creative Commons license, and indicate if changes were made. The Creative Commons Public Domain Dedication o/1.0/) applies to the data made available in this article, unless otherwise stated.
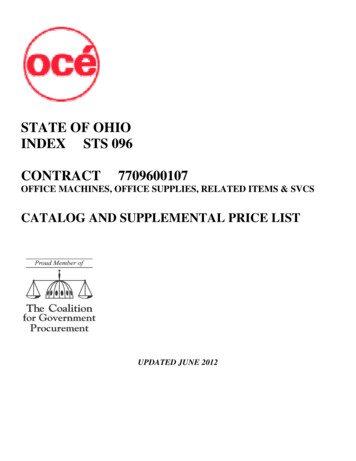
de Muinck et al. Microbiome (2017) 5:68BackgroundSignificant advances in microbiome analysis have beenachieved by the adoption of improved sequencingtechnologies and increased computational capabilities.Sequencing large numbers of relatively short DNA fragments has become routine, and microbiologists haveadapted these technologies to characterize communitiesof microbes either by targeted sequencing of conservedregions containing phylogenetically informative polymorphisms (e.g., 16S or 18S rRNA gene sequencing) orby sequencing a sub-set of the randomly sheared DNAmolecules in a sample (so-called shotgun metagenomics). Both approaches present unique challenges foridentification and interpretation of biologically meaningful information, and for the moment, the high costs associated with deep sequencing in shotgun metagenomicscurrently limits full exploitation. As such, combinedapproaches may offer the best possibility for achieving asignificantly improved understanding of complex microbial communities. Thus, targeted PCR amplification andsequencing of the 16S rRNA gene continues to offer apowerful and economic way to gain insight into thebacterial community composition in large numbers ofsamples.To address issues related to accuracy, cost, and throughput, we have designed an improved Illumina compatiblelibrary preparation protocol, combining features of severalexisting popular sequencing strategies, for 16S rRNA geneamplicon sequencing. Variable region 4 (V4) of the 16SrRNA gene is currently the most commonly used markerfor bacterial amplicon sequencing and the 515-806fragment in particular has been shown to outperformalternative variable regions both in terms of reproducibility and classification accuracy [1, 2]. The 515-806fragment can be spanned by sequencing 200–300 ntfrom both ends, easily achieved on the Illumina MiSeq(which delivers 15–25 million paired reads). The use ofa lengthy overlap between paired reads is necessary forreliable paired read merging, ensuring increased coverage on each sequence and higher quality data. Illumina’s HiSeq 2500 machine is capable of producing 300million 250 bp paired reads per run using Rapid runmode v2 500 cycle reagents, at approximately one-thirdthe cost per base compared to MiSeq.Nucleotide diversity—having equal proportions of A,C, G, and T nucleotides at each base position in asequencing library—is required for effective templategeneration on Illumina sequencing platforms [3]. In particular, the diversity in the first 11 bases of the DNAfragment is critical for cluster identification and colormatrix estimation. Libraries with low complexity and uneven nucleotide distribution such as amplicon librariescan be successfully sequenced by blending in a balancedspike-in (Illumina recommends PhiX) which significantlyPage 2 of 15reduces the amount of useful data obtained. This issuecan be partially overcome by the addition of so-calledheterogeneity spacers, short sequences of variablelength, at the 5’ end of the amplicon thus introducingthe required base diversity for effective sequencing witha minimal requirement for spike-in [4].The novel protocol that we describe in this study addsa third Illumina compatible index to the existing dualindexing strategy developed initially by Kozich et al. [5].We use a two-stage PCR protocol (as recommended byIllumina [6]), thus reducing the number of oligos required for multiplexing large numbers of samples. Inaddition, our protocol includes the heterogeneity spacersintroduced by Fadrosh et al. [4] to increase nucleotidediversity at the start of sequencing reads, allowinggreater utilization of available sequencing capacity.Here, we benchmark our new sequencing protocolusing both sequencing of a mock community andrepeated sequencing of a standardized environmentalsample. We looked for possible bias effects of PCR cyclenumber, input template DNA amount, PCR indexing ofsamples, MiSeq vs. HiSeq, between libraries and betweenruns variation. These types of evaluation are necessaryto understand potential misinterpretations that couldresult from technical issues inherent in the design andpractice of characterizing bacterial communities.MethodsBriefly, the procedure starts with a PCR reaction (PCR1)for general amplification of the V4 515-806 region of the16S rRNA gene. Oligos used in this reaction includesthe dual index sequence necessary for multiplexing (seebelow) along with heterogeneity spacers for increasinglibrary complexity. Equal amounts of each amplifiedsample are then enriched in a normalization step andpooled. A second PCR reaction (PCR2) is then performed, using each amplicon pool as template, whichprimes on the ends of the oligos used for PCR1 (Fig. 1).This reaction adds a third index sequence and completesthe Illumina adapters required for sequencing. AmplifiedPCR2 products are cleaned and quantified, then blendedto make a single library before sequencing on the HiSeq2500 (rapid mode) or MiSeq.Oligo designThe primers used for PCR1 consists of four parts (Fig. 1):(1). the 3′ end primes the V4 region of the 16S rRNAgene [7] with 515fB and 806rB in forward and reverseprimer, respectively. (2.) A heterogeneity spacer (0–7 bp)as described by Fadrosh et al. [4]. (3.) Internal barcodeson both forward and reverse primers, also as describedby Fadrosh et al. [4], to allow 96–384 sample indexcombinations. (4.) The 5′ end contains partial Illuminaadapters. The forward primer used in PCR2 is the same
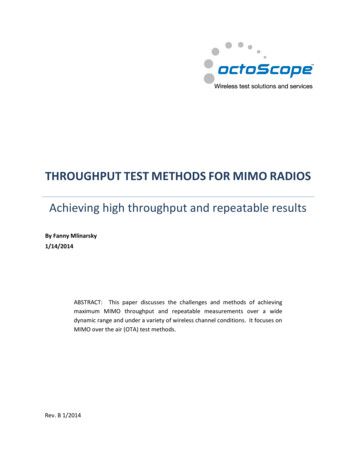
de Muinck et al. Microbiome (2017) 5:68Page 3 of 15Fig. 1 Triple indexing design. The triple indexing strategy incorporates two PCR steps. During the first PCR (PCR1), the template sequence ofinterest is targeted and amplified (green). The primers for this reaction also contain an indexing sequence and a heterogeneity spacer sequence(red), and a partial Illumina adapter (blue). A second PCR (PCR2) allows for the introduction of a third indexing sequence (dark blue) as well ascompletion of the Illumina sequencing adapterfor all the samples and contains the remaining Illuminaadapter that is necessary for sequencing. Reverse primerscontain the third index (6 nt Illumina TruSeq index) andthe remaining Illumina adapter. Complete lists ofprimers employed in this study are provided in Additionalfile 1: Table S1. All primers were purchased from Integrated DNA Technologies (Coralville, IA, USA) as 4 nmolultramers.Bacterial mock communityThe mock bacterial community used in this studywas generously provided by Prof. Lutgarde Raskin,Department of Civil and Environmental Engineering,University of Michigan and has been described elsewhere [8]. Briefly, near full length sequences of the 16SrRNA gene from 33 bacterial species representing morethan 25 different phyla (Additional file 2: Table S2,Additional file 3: Figure S1) were cloned into plasmids.Plasmid concentrations were then measured beforeblending to equal proportions at a final concentrationof 1e9 plasmids/μl.Library preparationFor an initial MiSeq sequencing run, the PCR1 amplification was carried out with the following reaction mixture:9 μl H2O, 10 μl 5Prime Hot Master Mix (Gaithersburg,MD, USA), 2.5 μl of 1 μM PCR1 forward primer, 2.5 μl of1 μM PCR1 reverse primer, and 1 μl mock communitytemplate at either 2.5e6 or 2.5e7 molecules/μl. The following program was used for amplification: 94 C for 3 minfor initial melting; 25, 30, or 35 cycles of 94 C for 10 s,50 C for 30 s, 72 C for 45 s; 72 C for 10 min. Productswere verified on a 1% agarose gel, and all samples werecleaned and normalized to equal concentrations using theSequalPrep Normalization Plate Kit (Invitrogen, Carlsbad,CA, USA) according to the manufacturer’s instructions.Samples assigned the same third index were pooledbefore the PCR2 reaction (Additional files 4, 5 and 6:Tables S3–5). PCR2 amplification was carried outwith the following reaction mix: 10 μl H2O, 20 μl5Prime Hot Master Mix, 5 μl of 1 μM PCR2 forwardprimer, 5 μl of 1 μM PCR2 reverse primer,10 μl templatepool at 1 ng/μl. The following program was used for amplification: 94 C for 3 min; 5 or 10 cycles of 94 C for 10 s,58 C for 30 s, 72 C for 45 s; 72 C for 10 min. Productswere again verified on a 1% agarose gel before cleaningwith the Agencourt AMPure XP PCR purification kit(Beckman Coulter, Brea, CA, USA) according to the manufacturer’s recommendations. DNA concentration andfragment size were measured on a Qubit fluorometer(Invitrogen, Carlsbad, CA, USA) and Agilent Bioanalyzer(Santa Clara, CA, USA), respectively. Samples with significant amounts of off-target fragment were cleaned oneadditional time with AMPure beads, but with the protocolmodified to a 1:1 mixture ratio of beads and samplein order to eliminate shorter fragments. Librarieswere blended in proportions to ensure similar coverage of all samples. For later HiSeq sequencing runs(Additional files 7, 8, and 9: Tables S6–8), the librarypreparation procedure was identical to the MiSeqprotocol with 35 and 10 cycles for PCR1 and PCR2, respectively, with the following exception: the repeatedmelting steps during both PCR amplifications wereincreased from 10 to 30 s.Illumina sequencingPaired-end sequencing was performed on a MiSeq(Illumina, San Diego, CA, USA) using v3 reagents,generating 300 bp reads per end, or on a HiSeq 2500(Illumina) in Rapid mode, with v2 reagents, producing250 bp reads per end, according to manufacturer’s instructions at the Norwegian Sequencing Centre (Oslo,
de Muinck et al. Microbiome (2017) 5:68Norway). In each case, Illumina spike-in (PhiX) wasincluded at 10% while loading was dropped to 80%normal recommended levels. Raw bcl files were processed using RTA v1.18.54 (MiSeq) and v1.18.66.3(HiSeq). Initial de-multiplexing of the data based onthe Illumina index reads (third index) was carried outusing bcl2fastq v.2.17.1.14, which also converted theraw data to fastq files. Quality of the sequenced datawas verified using FastQC v0.11.3 [9] and was summarised using multiqc v0.3.1 [10].Downstream analyses of mock community dataLow quality reads were trimmed, and Illumina adapterswere removed using Trimmomatic v0.36 [11] with defaultsettings. Reads mapping to the PhiX genome (NCBI id:NC 001422.1) using BBMap v36.02 [12] were also removed. De-multiplexing of data based on the dual indexsequences was carried out using custom scripts (https://github.com/arvindsundaram/triple index-demultiplexing).Internal barcodes and spacers were removed using cutadapt v1.4.1 [13], and paired reads were merged usingFLASH v1.2.11 [14] with default settings. Sequence fileswere then converted from fastq to fasta, and primers weretrimmed from merged read ends. For each mock community sample, reads were aligned against a local databaseconsisting of the 16S rRNA gene sequences of the 33bacterial species included in the mock communityusing BLAST [15] and only reads with full length alignment with 100% sequence identity were retained forsubsequent analyses, except for chimera detection.Chimera detection was carried out on the raw, mergedreads using the uparse [16] pipeline in usearchv8.1.1861 [17] with no minimum group size for thedereplication and clustering steps. Chimera formationrates were then found from the uparse output files.The BLAST tabular output files were then importedinto R [18]. Operational taxonomic unit (OTU) tableswere produced by counting the number of occurrencesof each bacterial species in the mock community. Sincethe resulting OTU tables were non-sparse with each OTUat an expected relative abundance of 3%, ordination wasdone using principal components analysis (PCA) with theprcomp function in R (stats package). Bray-Curtis distancematrix computation, adonis modeling (PermutationalMultivariate Analysis of Variance Using DistanceMatrices) and ANOSIM (using Bray-Curtis dissimilarities and 10000 permutations) were carried out usingthe R package vegan.Environmental sample sequencingA standardized environmental sample was made bysuspending a fresh fecal sample (32.5 g) from a healthyinfant in 500 ml of PBS. 1 ml aliquots of this suspensionwere then transferred to microtubes and immediatelyPage 4 of 15frozen at 80 C. 500 μl of sample material was used forDNA extraction with the PowerSoil 96 well DNA isolation kit (MO BIO Laboratories Inc., Carlsbad, CA,USA). A total of 54 standardized samples were DNAextracted on 19 different plates and were prepared aspart of 19 different sequencing libraries (Additional file8: Table S7), with 3 standardized samples per librarywith two exceptions (one library with two samples andone with only one). Library preparation and Illuminasequencing were carried out as described above, and thesamples were sequenced as part of two separate HiSeqsequencing runs (26 samples in one, 28 in the other).Sequence processing was performed as described aboveup to and including paired read merging. Further processing was carried out using a combination of vsearchv2.0.3 [16] and usearch v8.1.1861 [17]. Specifically, dereplication was performed with the –derep fulllengthfunction in vsearch with a minimum unique group sizeset to 2. OTU clustering, chimera removal, taxonomicassignment, and OTU table building were carried outusing the uparse pipeline [19] in usearch. Taxonomicassignment to the genus level was done against the RDPclassifier. Read depths were normalized by commonscaling [20]. This entails multiplying each OTU count ina given library with the ratio of the smallest library size(97,187 reads) to size of the library in question. Thisprocedure replaces rarefying (i.e., random sub-samplingto the lowest number of reads) as it produces the libraryscaling one would achieve by averaging over an infinitenumber of repeated sub-samplings. After conversion ofOTU counts to relative abundances, OTUs with an average relative abundance below 0.01% were removed fromthe data in order to reduce noise from artifacts. Kruskal’snon-metric multidimensional scaling was carried outusing the function isoMDS in the R package MASS withdefault settings.We also sequenced 25 fecal samples from 5 healthyadults. We analyzed 4–6 samples, collected on consecutive days, per individual. With one exception the sampleswere prepared as part of the same library, and all samples were sequenced in one HiSeq run. Sequencing andsubsequent analyses followed the exact same procedureas the standardized samples described above, with theexception that scaling was done against a smallest librarysize of 53,902 reads.For further comparison, 15 additional human sampleswere sequenced using the widely used earth microbiomeproject (EMP) protocol [7], targeting the exact same V4fragment of the 16S rRNA gene as our triple indexingapproach. Sample collection and extraction was performed as described in [21], but in this case, the actualsequencing was carried out at the Broad Institute(Cambridge, Massachusetts, USA) core sequencing facility and sequencing was done on a MiSeq instrument
de Muinck et al. Microbiome (2017) 5:68with 150 PE reads. We re-sequenced these samples usingthe triple indexing approach on the HiSeq at the NorwegianSequencing Centre (Oslo, Norway). Sequencing data wereprocessed as described above, with exception that scalingwas done to the smallest library size of 10,241 reads.ResultsWe evaluated several potential sources of bias in oursequencing strategy, using the total output from oneMiSeq run and partial output from two HiSeq runs,resulting in six separate datasets (Table 1). Bias caused bysample indexing both in PCR1 (Dataset 1, Additional file4: Table S3) and PCR2 (Dataset 2, Additional file 5: TableS4) reactions, as well as the effects of DNA templateamount used for PCR and PCR cycle number (Dataset 3,Additional file 6: Table S5), were evaluated by sequencingthe mock community 160 times in a single MiSeq run.We sequenced the mock community 24 additional timesas part of a HiSeq run (Dataset 4, Additional file 7: TableS6) in order to assess design optimization, as well as toprovide a basis for comparison between MiSeq and HiSeqresults. Furthermore, a standardized environmental sample was sequenced 54 times as part of two separate HiSeqruns (Dataset 5, Additional file 8: Table S7) in order to assess variability between sequencing libraries and sequencing runs. In addition, we sequenced, in a single HiSeqrun, 25 fecal samples collected on consecutive days from 5adult volunteers (Dataset 6, Additional file 9: Table S8), inorder to provide a baseline measure of variability in a realistic experimental setting, as well as to assess discriminatory power. Finally, we compared our sequencingtechnique with the widely used EMP protocol (Dataset 7,Additional file 10, Table S9).Effect of PCR1 indexingTwelve forward and eight reverse PCR1 primers were usedin this design to generate 96 PCR1 index combinationsPage 5 of 15(Dataset 1, Additional file 4: Table S3), i.e., a full standardplate. Since these primers contain different 12 bp indices,and have slightly different lengths due to the “heterogeneityspacer”, they can conceivably amplify with different efficiencies during PCR, which could bias results. To examine thiseffect, we amplified the same template (the mockcommunity library, 2.5e6 input molecules per reaction)using 96 PCR1 primer combinations, employing 35 cyclesof PCR1 and 10 cycles of PCR2 amplification (the samePCR2 forward and reverse primer was used for all reactions). These amplification conditions represent the maximum number of cycles (hence maximum possible bias)used in the study. The 96 samples were sequenced on theMiSeq platform yielding a mean of 80,330 ( 31,559 s.d.)reads per sample after quality filtering and paired readmerging.Variation in yield from each PCR reaction can beexpected due to amplification efficiency and technicalvariation caused by normalization prior to PCR2. Amplification efficiency was seen to be approximately equalfrom all reactions, as determined by running the products on an agarose gel (data not shown). However, indexcombinations where the same index sequence waspresent on both forward and reverse PCR1 primers clearlyproduced a lower yield of sequence data (Additional file 11:Figure S2), with mean read numbers at 8968 (same indexsamples, n 8) vs. 86,818 (different index samples, n 88).However, apart from the relatively low read numbers, thespecies relative abundances measured in these samples didnot differ noticeably from other samples, and thus wereincluded in further analyses.Based on the blending estimates described in Pintoand Raskin [8], the expected proportion of each specieswas 3%. Overall relative abundance estimates generallycentered on the expectations (Fig. 2), with a meandeviation from the expected value by 1.34 ( 0.91 s.d.).However, some species deviated more than others fromTable 1DatasetSequencer*EvaluationData derived fromPrimer list, read numbers andother information1MiSeqPCR1 index96 mock community samplesAdditional file 4: Table S32MiSeqPCR2 index20 mock community samplesAdditional file 5: Table S43MiSeqPCR cycle number and input template amount48 mock community samplesAdditional file 6: Table S54HiSeqHiSeq protocol24 mock community samplesAdditional file 7: Table S65HiSeqEnvironmental samples 154 standardized fecal samplesAdditional file 8: Table S76HiSeqEnvironmental samples 225 fecal samples from 5 healthy adultsAdditional file 9: Table S87MiSeq**, HiSeqEarth microbiome project15 fecal samples from 15 healthy adultsAdditional file 10: Table S9*MiSeq - MiSeq v3 600 cycle kit: 300 bp paired end run*HiSeq - HiSeq 2500 rapid v2 500 cycle kit: 250 bp paired end run**MiSeq - MiSeq v2 150 cycle kit: 300 bp paired end runPrimer lists, read numbers, and other pertinent information for datasets 1–7 can be found in Additional files 4–10: Tables S3–9, respectively. Environmentalsamples were DNA extracted using the PowerSoil 96 well DNA isolation kit (MO BIO Laboratories Inc.) and were processed as part of 19 separate sequencinglibraries and 2 different HiSeq sequencing runs
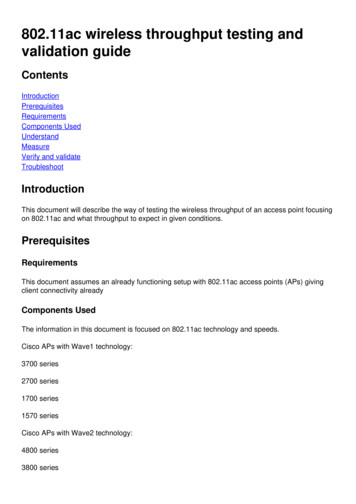
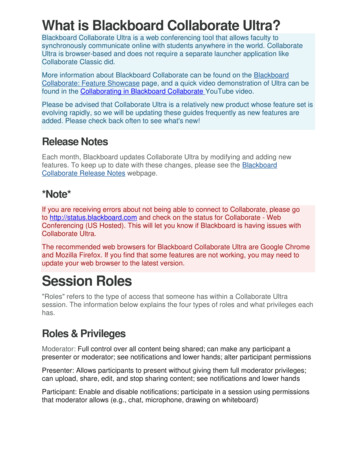
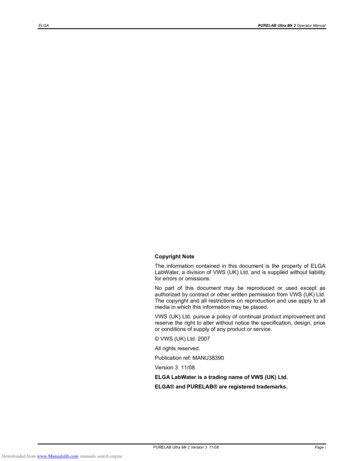
de Muinck et al. Microbiome (2017) 5:68Page 6 of 15Fig. 2 Relative abundances of the 33 bacterial species in the mock community sample estimated from both the MiSeq (dataset 1, n 96) andHiSeq (dataset 4, n 24) data (Additional file 4: Table S3, Additional file 7: Table S6). Species abundance estimates are shown side-by-side withMiSeq estimates labeled ‘MS’ and HiSeq estimates labeled ‘HS’. For enhanced visualization, each pair of colored bars (blue or white) depicts theestimated relative abundances for one species. The dotted red line shows the relative abundance expectation given perfectly equal blending. Eachbox represents the interquartile range while the whiskers represent 1.5 times the interquartile range. Points outside the whiskers represent outliersexpectation. In particular, Thermomicrobium roseum wasdetected, at very low abundances, in only 7 of the 96sequenced samples. Notably, this is the species with thehighest GC content (69%) in the mock community, solow sequencing efficiency of the rDNA from this bacterium is unsurprising, as Illumina sequencing is not effective on sequences with extreme GC content [22].Overall, significant spread in relative abundance estimates within species was observed, with a mean standard deviation of 0.66%. This could largely be attributedto bias effects from the primers used for PCR1 amplification causing significant structure in the data (Fig. 3,Additional file 12: Figure S3), with 74.4% of the intersample variation in Bray-Curtis distances explained bysamples having been amplified with different PCR1 reverse primers (p 0.001, ANOSIM) and 18.7% ascribedto the forward primers (p 0.003, ANOSIM), accountingfor a total of 93.1% of observed variation.Observed effects were primarily associated with theoligo indices designated r1, r10, and r13 (Fig. 3a). TheseFig. 3 Scores plot based on a principal component analysis model computed from the matrix of species relative abundances from dataset 1(Additional file 4: Table S3). a. Samples are colored according to the reverse primer used for PCR1. b. Samples are colored according to theforward primer used for PCR1. In both a and b, the first two dimensions, explaining 62% of the total variance, are shown
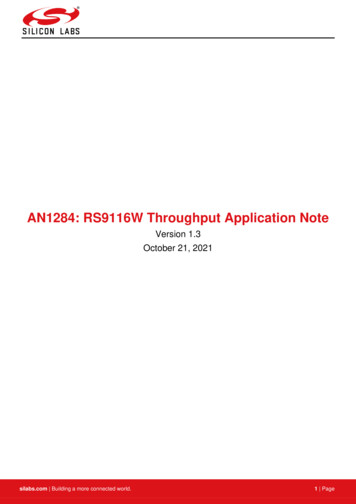
de Muinck et al. Microbiome (2017) 5:68effects were again associated with specific bacterialspecies (Additional file 13: Figure S4), e.g., r1 appearedto be biased in favor of Mycobacterium orale and anuncultured Bacteroidetes while r10 and r13 favored anuncultured Cyanobacterium and an uncultured Verrucomicrobium. In general, there was good agreementbetween the 96 measured mock communities with anaverage Spearman correlation of 0.85 between thevectors describing relative species abundances, but therelatively poorer agreement between samples processedwith the r1 primer and those amplified with the r10 andr13 primers was evident, with correlations even fallingbelow 0.5 (Additional file 14: Figure S5). We alsoobserved a significant negative relationship between estimated mean relative abundances and GC content ofsequenced fragments (p 0.002, linear regression; Fig. 4),with relative abundance decreasing by 0.18% for each 1%increase in GC content. Chimera formation rates, at amean of 17% ( 2.2 s.d.), were not significantly associatedwith specific oligo combinations, except for a slightly elevated rate for samples amplified with primer r13 (p 0.001,linear model, (Additional file 15: Figure S6). Furthermore, itwas evident that the large majority of chimeric sequencesoccurred only once in any given sample, with a mean proportion of singleton chimeras at 90%.Page 7 of 15however, indices were only present on the reverse primer, were shorter (6 bp), and no heterogeneity spacerswere required. Furthermore, the priming sequence usedfor this amplification did not contain wobble-bases(Additional file 1: Table S1), further reducing the potential for bias. We compared relative species abundancesmeasured in five sets of PCR1 products (four per set fora total of 20 samples) amplified using 35 cycles, witheach set of 4 samples using a different PCR2 index primer (Dataset 2, Additional file 5: Table S4) and 10 cyclesof amplification. The samples were sequenced on theMiSeq platform yielding and average of 144,171( 100,253 s.d.) reads. PCR2 was again performed for10 cycles of amplification, to introduce the maximumpossible bias. By far, the largest proportion of intersample variation in Bray-Curtis distances was explainedby differences caused by PCR1 reverse priming oligos(82.7%, Adonis model), with the main difference between samples amplified using r1 and r10 (Additionalfile 16: Figure S7). Conversely, only 8.6% (Adonis model)of the observed distance variation could be related todifferences between oligos used for PCR2 amplifications,and these effects were not found to be statisticallysignificant (p 0.98, ANOSIM).Effects of PCR cycle number and template amountEffects of PCR2 indexingSimilar to the analysis above, we attempted to quantifybias emerging from the use of different index sequencesintroduced in PCR2 amplification. In the case of PCR2,Fig. 4 Relationship between mean relative abundance estimatesand GC percentage for datasets 1 and 4. There is a significantnegative linear relationship for both the MiSeq (p 0.002, n 96,Additional file 4: Table S3) and HiSeq (p 0.012, n 24, Additionalfile 7: Table S6) data. Estimates drop by 0.18 and 0.16% for each 1%increase in GC content for the MiSeq and HiSeq estimates, respectivelyPCR has on numerous occasions been shown to introduce amplification bias [23]. We therefore wished toexamine how the number of amplification cycles, duringPCR1 and PCR2, affected sequencing results. To thisend we sequenced 48 mock community samples (MiSeq,mean of 104,705 ( 43,026 s.d.) reads per sample)according a factorial design (Dataset 3, Additional file 6:Table S5). Briefly, we performed PCR1 amplificationusing either 25, 30, or 35 cycles (16 samples per treatment). To investigate the effect of PCR2 cycle number,PCR1 products were further amplified with either 5 or10 cycles (24 samples per treatment). Furthermore,within each combination of PCR cycle number regimes,initial PCR1 amplification was carried out using eitherrelatively low (2.5e6 molecules) or high (2.5e7 molecules)
gene amplicon sequencing method to date. Triple-indexing greatly reduces the number of long custom DNA oligos required for library preparation, while the inclusion of variable length heterogeneity spacers minimizes the need for PhiX spike-in. This design results in a significant cost reduction of highly multiplexed amplicon sequencing. The .