Transcription
PowerChart (eChart) Resource GuideViewing Lab ResultsContentsOverview . 2A Lab Story - From Order to Posted Result . 3Result Legend . 5Results with Comments . 6Corrected Results . 9Filtering Result Range .10Filtering to Display Specific/Categories of Results .12Point of Care Testing .14Displaying Results in Different Formats .15Graphing Results .17Getting Detailed Information about a Result .19Using the Seeker to Find Results .20November 20131 of 20
PowerChart (eChart) Resource GuideViewing Lab ResultsOverviewA summary of all labs ordered and resulted for C&W are posted and displayed in the ResultsFlowsheet. In addition to the Flowsheet, there are views within PowerChart that display anotification to clinicians of new or modified results. This guide serves to provide the details ofhow to find lab results and enhance your practice by utilizing the notification features withinPowerChart.Flowsheet information displays in aspreadsheet with flexible display features thatmake it possible to create an optimal view.The Flowsheet is divided into two majorsections – The Navigator and the ResultsDisplay.As patient information becomes available theresults Flowsheet will grow horizontally andvertically.The Left section isthe Navigator(electronic index).By selecting acategory, you canzoom immediatelyto its contents,which aredisplayed as valuesin the grid on theright.The Right section is the Results Display.You can control both sections to displaythe information that is most meaningfulto you. The default is to display the last300 posted results in the past 5 years/documents/reports.November 20132 of 20
PowerChart (eChart) Resource GuideViewing Lab ResultsA Lab Story - From Order to Posted ResultClinician completes written lab requisition and forwards to the Lab.Requisition is received in Lab and processed in Sunquest (Lab). The requisition will crossthrough into Cerner as an order. The order status displays as In Progress until the order isresulted.Test Completed and Result VerifiedYou can view order details by doubleclicking on the test.Note you can find the accession # in theorder details.Results Posted to the Results FlowsheetNovember 2013When you hover over a result, thereference range is displayed in the lowerleft corner.Double click on a result to review resultdetails.3 of 20
PowerChart (eChart) Resource GuideViewing Lab ResultsNotification Alerts posted to the Patient Access List (PAL)Double click on the icon to view results.Note to clear the icon, click ‘Apply’ and then close the windowResults Posted to the Overview (Since Last Time) TabOrder and Results posted to Since Last Time.This view displays all the results posted sinceYOU last reviewed the patient’s chart andDate/Time Stamped the view.November 20134 of 20
PowerChart (eChart) Resource GuideViewing Lab ResultsResult LegendText is displayed on a patient's Flowsheet in several different colors and alpha indicators.L - LowC - CriticalH - HighWithin NormalRangeTo view the color-coded Result Legend explainingthe current notable data display scheme, completethe following steps.1. Click on the Options menu from the TaskMenu Bar.2. Select Result Legend from the drop downmenu.November 20135 of 20
PowerChart (eChart) Resource GuideViewing Lab ResultsResults with CommentsLaboratory staff can qualify or add details to a result with a comment.1.Comments with an Asterisk*If a result is prefaced with an asterisk (*) there isadditional information added as a comment.1. Right click on the cell.2. Select, View Comments from the dropdownmenu.Comment is displayedNovember 20136 of 20
PowerChart (eChart) Resource GuideViewing Lab Results2.*Comments without an AsteriskIf a cell contains text, hover over toreveal the comment.Hovering over the cell reveals comment. In thisexample, the comment is truncated with ‘ ’ alertingthe viewer that there is more to the comment.To view the rest of the comment Right click on the cellFrom the dropdown menu, select‘View Details’November 20137 of 20
PowerChart (eChart) Resource GuideViewing Lab ResultsThe entire comment is included in the Result Details. Use thescroll bar to view the text to the end.Note If you would like to print the result with thecomment, click print. The entire comment will beprinted.November 20138 of 20
PowerChart (eChart) Resource GuideViewing Lab ResultsCorrected ResultsAlert notifications of any corrected results will display on yourPALAll results that have been corrected will bepreceded by (c) in the cellYou can view more informationon the corrected resultRight-click on the cellSelect View Details from thedropdown menuResult Details window opens Result History displays in top pane with boththe previous and current result(s)In this example, there is a comment attached to the result. To viewthe correction, click on the ‘Comments’ tabNovember 20139 of 20
PowerChart (eChart) Resource GuideViewing Lab ResultsFiltering Result RangeYou can manipulate the amount of data that is displayed to suit your clinical needs. The defaultis to display the last 300 results but you can filter to display a broader/narrower result count,specific date ranges, only today’s results or all results posted for an admission.To make a quick adjustment to the display rangeThe arrows on either end of the information baradjust the display range.Hovering over the arrow reveals the tool tipdisplaying the adjustment range.In addition to the quick range adjustment described aboveyou can you the use the Search Criteria tool to search forresults using very specific range criteria including: clinicalrange, posting range, result count and admission to currentdate.Right Click on the blue Information ToolbarClick ‘Change Search Criteria’ from the drop downmenuNote if you just want to see today’s results, click ‘Set toToday’November 201310 of 20
PowerChart (eChart) Resource GuideViewing Lab ResultsThe Clinical Range is the date of theeventi.e., if a specimen was taken Jan 1and resulted Feb 1, Jan 1st would bethe clinical dateResult Count (default) instructs thesystem to retrieve the quantity of resultsthat you specify within the number ofyears time-frame.Enter a number in the ‘Number ofResults’ box to indicate the last ( )results that are to be retrieved.Enter a number in the ‘Year ResultLimit’ box to indicate the results are tobe retrieved within the last ‘X’ years.The Posting Range is the time range forwhich the result entered the patientscharti.e., if a specimen was taken Jan 1 andresulted Feb 1, Feb 1st is the posting dateAdmission Date to Current Dateretrieves all results entered for thepatient from the time the patient wasadmitted for that encounter to thecurrent time.You can enter a number from 1 to 999in the ‘Number of Hours Previous tothe Admit Date’ box to indicate thatresults entered within hours prior tothe patient's admission are to beretrieved.Once you have selected your ‘Search Criteria’ click ‘OK’ tocomplete the actionNovember 201311 of 20
PowerChart (eChart) Resource GuideViewing Lab ResultsFiltering to Display Specific/Categories of ResultsIn addition to filtering the range of results that are displayed you can filter for groups of resultsas well as specific individual results.You can search for groups of results by eitherChoosing a result group from the ‘Level’ drop down menu, ORDe-selecting unwanted result categories in the NavigatorDon’t Panic – the results never go away from the flowsheet. To see the all theresults again, click ‘ALLRESLTSECT’ in the Level filter and/or ensure all thecategories in the Navigator are selectedYou can search for specific procedures or teststhat have been completed. For example you canfilter the information so that all hemoglobinresults are displayed.Click on the dashboardFlowsheet Field.to the right of theClick here to see amenu tree of allthe tests availableNovember 201312 of 20
PowerChart (eChart) Resource GuideViewing Lab ResultsThe ‘Procedure Selection’ dialog box opens with thecursor in the Procedure field.Enter the name (or the first few letters) of the nameof the test or procedureclick ‘Enter’ on the keyboard to view a list of itemsrelated your searchHighlight a test/procedure and click ‘OK’. You arereturned to the Flowsheet, which now displays onlythe category of results you requested.Note how only the hemoglobinresults are displayed. When youhave reviewed the information andwish to return to the ‘All ResultsFlowsheet’ go to the flowsheetdropdown menu and select ‘allresults flowsheet’.November 201313 of 20
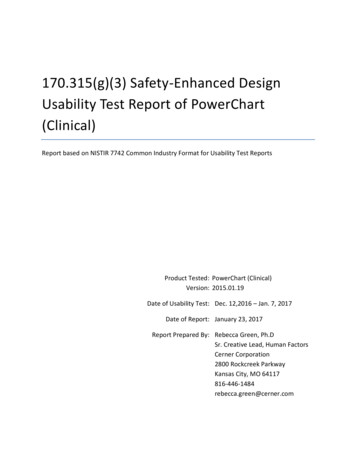
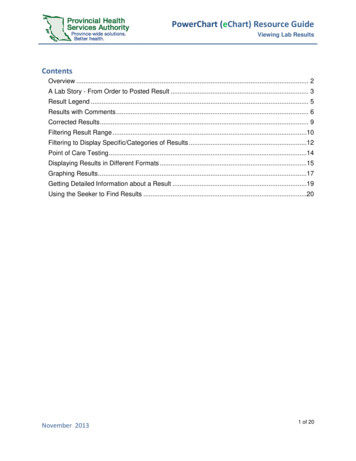
PowerChart (eChart) Resource GuideViewing Lab ResultsPoint of Care TestingArterial Blood Gas analysis in the PICU and NICU is an example of Point of Care (POC) testingthat is resulted in PowerChart. The POC testing is resulted and acted upon immediately;however, there is a delay in posting the information in PowerChart. Because of this delay, theresults of POC testing will not trigger notification in the Patient Access List (PAL).Point of Care Tests are prefacedwith POCNovember 201314 of 20
PowerChart (eChart) Resource GuideViewing Lab ResultsDisplaying Results in Different FormatsSeveral view formats are available for displaying results inthe Results Flowsheet:Table view (default)Group viewList viewTo display the different views, click on the appropriateradio buttonTable ViewThe Table View displays theevent descriptions and datesrespectively as the x and y axis ofthe results display.Note This is the default viewNovember 201315 of 20
PowerChart (eChart) Resource GuideViewing Lab ResultsGroup ViewThe Group View displays the headingfor a group of events in the left column(y axis) of the results display. The eventdates are under each heading in thefirst column. The event descriptions arecolumn headers (x axis). You need toscroll down to view additional databeyond the bottom of the screen.List ViewThe List View displays patient events and results in alinear list format. Results are displayed in aspreadsheet with column headings such as eventdate, event, result, reference range, and status. Thelist can be sorted by the event name or date.November 201316 of 20
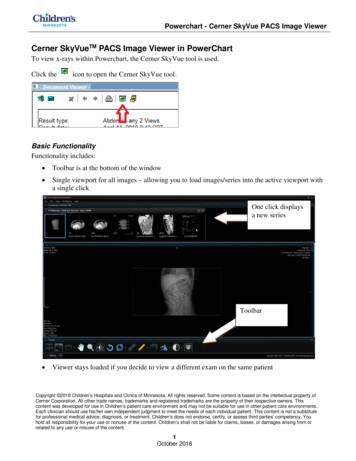
PowerChart (eChart) Resource GuideViewing Lab ResultsGraphing ResultsWhile you are viewing a patient's Flowsheet, you can generate a graphic representation of thenumeric results values. The graph plots the values and displays units of measure along the yaxis. To view or print a graph of all results of a certain type, complete the following steps:Select the name of a specific test(s) orprocedure(s) for which results are given ina numeric value. You can either select thename or the check box just to the left ofit.) This marks the box with a check mark.Click ‘Graph’icon.Want to save favorite graph-types? Go to the Advanced Graphing ResourceGuideThe systemgenerates anddisplays a graphfor each type oftest you selectedClick ‘Combine’if you wouldlike to combinethe results intoone graphNovember 201317 of 20
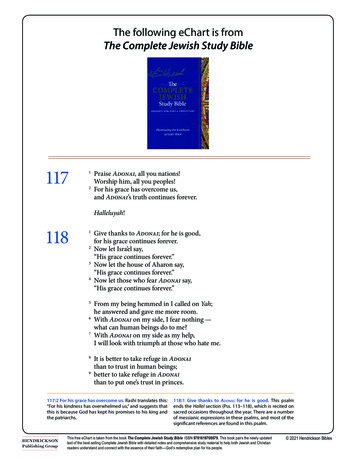
PowerChart (eChart) Resource GuideViewing Lab ResultsThis is an example of graph a displaying a combination of 2result typesClick ‘Print’ to print the graphNote If 2 different graphs are displayed in a dialogue; dialogbox will prompt you to select which graph or graphs you wantto print.You can access the additional information window about any value representedon the graph by clicking the circle or shape surrounding the plotted value. See‘Getting More Information about a Result’.November 201318 of 20
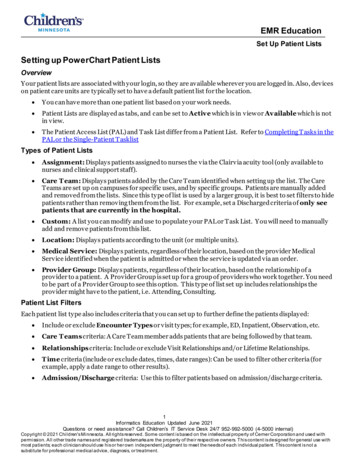
PowerChart (eChart) Resource GuideViewing Lab ResultsGetting Detailed Information about a ResultWhen you review the posted results for a patient, you can drill down on a result to view detailsregarding the result collection and values.To view the details of a resultdisplayed in a cellDouble-click on a result , ORRight-click on a result and select‘View Details’The ‘Result Details’ opensup to display a range ofinformation includingreference rangesClick ‘Close’ to close the boxNovember 201319 of 20
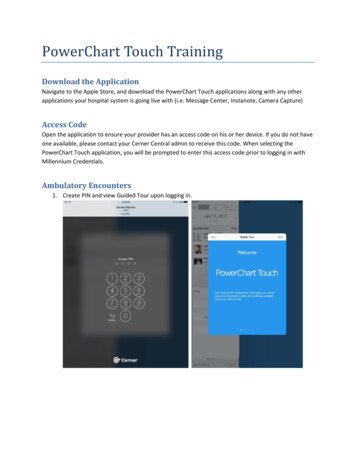
PowerChart (eChart) Resource GuideViewing Lab ResultsUsing the Seeker to Find ResultsThe Seeker is a quick locator tool that enables you to view athumbnail sketch of the entire results flowsheet and focus on anarea containing a cluster of results. Vertical line segments representresults in the sequence they occurred. Red lines represent criticalresult values. A period of intense result activity causes the lines tomerge into solid blocks. The Seeker is especially helpful in spottingcritical result values (in red) out of view in the flowsheet window.Also, it is easy to spot result density, which often reflects a majorclinical occurrence. The Seeker enables you to scroll quickly to thislocation in the flowsheet for a closer look. Since it is small, you candrag the Seeker to a corner of your desktop and continue workingwith flowsheet.Open the Flowsheet Seeker byclicking on the ‘Seeker’ IconWhen the Flowsheet Seeker isdisplayed, it represents the portion ofFlowsheet matching the searchcriteria you entered. The rectangleoutlined represents the currentscreen display area.November 201320 of 20
PowerChart (eChart) Resource Guide Viewing Lab Results November 2013 14 of 20 Point of Care Testing Arterial Blood Gas analysis in the PICU and NICU is an example of Point of Care (POC) testing that is resulted in PowerChart. The POC testing is resulted and acted upon immediately; however, there is a delay in posting the information in PowerChart.