Transcription
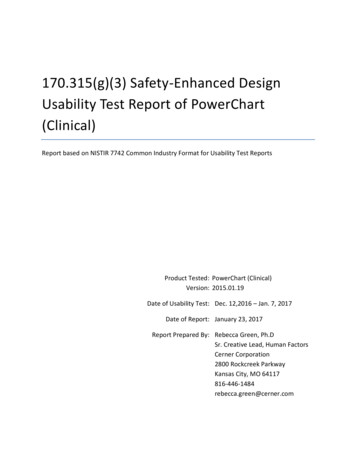
170.315(g)(3) Safety-Enhanced DesignUsability Test Report of PowerChart(Clinical)Report based on NISTIR 7742 Common Industry Format for Usability Test ReportsProduct Tested: PowerChart (Clinical)Version: 2015.01.19Date of Usability Test: Dec. 12,2016 – Jan. 7, 2017Date of Report: January 23, 2017Report Prepared By: Rebecca Green, Ph.DSr. Creative Lead, Human FactorsCerner Corporation2800 Rockcreek ParkwayKansas City, MO 64117816-446-1484rebecca.green@cerner.com
TABLE OF CONTENTSEXECUTIVE SUMMARY . 4INTRODUCTION. 8METHOD . 9Participants . 9Study Design. 13Tasks . 13Procedures . 13System Tested . 14Test Location and Environment . 14Usability Metrics . 14Test Forms and Tools . 15Participant Instructions . 15USABILITY SCORING . 16RESULTS . 18Workflow 170.315 (a) (1) CPOE Medications . 18Workflow 170.315 (a) (2) CPOE Imaging . 19Workflow 170.315 (a) (3) CPOE Labs . 19Workflow 170.315 (a) (4) Drug – Drug / Drug – Allergy Interaction Checking . 20Workflow 170.315 (a) (5) Patient Demographics . 21Workflow 170.315 (a) (6) Problem List . 22Workflow 170.315 (a) (7) Medications List . 23Workflow 170.315 (a) (8) Allergy List . 25Workflow 170.315 (a) (14) Implant Device List . 25Workflow 170.315 (b) (2) Clinical Information Reconciliation . 27Workflow 170.315 (b) (3) Electronic Prescribing . 29Summary of Measures by Task . 31Overall Satisfaction Ratings . 33DISCUSSION OF FINDINGS . 34Participant Comments . 34AREA(S) FOR IMPROVEMENT . 36APPENDIX A: DEMOGRAPHICS SURVEY . 38Cerner CorporationConfidential Information Cerner Corporation. All rights reserved. This document contains confidential information which may notbe reproduced or transmitted without the express written consent of Cerner.Page 2 of 48
APPENDIX B: PARTICIPANT BRIEFING/DEBRIEFING . 41APPENDIX C: TEST SCRIPT FOR PHYSICIANS . 42APPENDIX D: TEST SCRIPT FOR NURSES. 46Cerner CorporationConfidential Information Cerner Corporation. All rights reserved. This document contains confidential information which may notbe reproduced or transmitted without the express written consent of Cerner.Page 3 of 48
EXECUTIVE SUMMARYA usability test of Cerner’s PowerChart (Clinical) was conducted on remotely on Dec. 12,2016through Jan. 7, 2017 by Cerner. The purpose of this test was to test and validate the usability ofthe current user interface, and provide evidence of usability in the EHR Under Test (EHRUT).During the usability test, 24 healthcare providers matching the target demographic criteriaserved as participants and used the EHRUT in simulated, but representative tasks.This study collected performance data on tasks typically conducted on an EHR: Find information in Patient Summary screenAdd, Remove and Edit the Problem ListReview Vitals and LabsAdd, Remove and Edit the Medication Allergy ListAdd, Remove and Edit the Medication ListReconcile outside records with the Patient’s chartReview the Patient’s implanted device listAdd, Remove and Edit Physician Orders, and if relevant, route them to the patient’spreferred pharmacyDuring the 60-minute one-on-one usability test, each participant was greeted by theadministrator and asked to review and provided a recorded verbal agreement to an informedconsent/release form; they were instructed that they could withdraw at any time. Participantshad prior experience with the EHR. The administrator introduced the test, and instructedparticipants to complete a series of tasks (given one at a time) using the EHRUT. During thetesting, the administrator timed the test and recorded user performance data electronically.The administrator did not give the participant assistance in how to complete the task unlessrequired for task workflow. Participant screens and audio were recorded for subsequentanalysis.The following types of data were collected for each participant: Number of tasks successfully completed within the allotted time without assistanceTime to complete the tasksNumber and types of errorsPath deviationsParticipant’s verbalizationsParticipant’s satisfaction ratings of the systemCerner CorporationConfidential Information Cerner Corporation. All rights reserved. This document contains confidential information which may notbe reproduced or transmitted without the express written consent of Cerner.Page 4 of 48
All participant data was de-identified – no correspondence could be made from the identity ofthe participant to the data collected. Following the conclusion of the testing, participants wereasked to complete a post-test questionnaire. Various recommended metrics, in accordancewith the examples set forth in the NIST Guide to the Processes Approach for Improving theUsability of Electronic Health Records, were used to evaluate the usability of the EHRUT.Following is a summary of the performance and rating data collected on the EHRUT.nTaskSuccess% (SD)PathDeviations(Obs./Optimal)MeanOptimalTask Timein sec. (SD)MD1. (a)(5)DemographicsMD2. (b)(2) CIR:ProblemsMD3. (a)(6) ProblemListMD4. (a)(7) Meds List& (b)(2) CIR:Medication ListMD5. (a)(4) Drug-DrugIxCMD6. (a)(7) Meds List1392 (0.28)11 / 99)Task Description1377 (0.44)130 / 613100 (0)4/21369 (0.48)34 / 91090 (0.32)4/41392 (0.28)12 / 4MD7. (a)(1) CPOE13100 (0)6/5MD8. (a)(1) CPOE1392 (0.28)9/5MD10. (a)(3) CPOEImagingMD11. (a)(2) CPOELabsMD12. (a)(14) DeviceListMD14. (a)(6) ProblemListMD15. (a)(1) CPOE,(b)(2) CIR: MedicationList, & (b)(3) eRxMD16. (b)(3) eRx1392 (0.28)15 / 91392 (0.28)12 / 512100 (0)34 / 41392 (0.28)14 / 61392 (0.28)36 / 713100 (0)2/3Cerner 8.53(51.23)150.61(63.12)8.74 1.78(63.11)MeanDeviationTask TimeTask(Obs./Errors RatingsOptimal)(SD)(SD)0.86.258 / 51512 / 3026 / 44364 / 367 / 2180 / 3141 / 3890 / 4895 / 677/2165 / 0110 / 42271 / 2825 / )0.9(0.9)2.6(1.8)1.1(1.0)2.8(2.2)4.2(1.5)5.8 )4.6 (2)6.1(0.9)5.2 (0)Confidential Information Cerner Corporation. All rights reserved. This document contains confidential information which may notbe reproduced or transmitted without the express written consent of Cerner.Page 5 of 48
RN1. (a)(5)DemographicsRN2. (a)(8) MedAllergy ListRN3. (b)(2) CIR:Allergy ListRN4. (b)(2) CIR:Problem ListRN5. (a)(7) Med List1173 (0.47)49 / 71191 (0.30)9/81173 (0.47)37 / 51164 (0.50)46 / 411100 (0)5/6RN6. (a)(7) Med List1191 (0.30)18 / 8RN7. (a)(4) IxC &(a)(8) Med-Allergy ListRN9. (a)(14) DeviceList1191 (0.30)6 /121030 (0.42)53 / 8.82)84.31(16.45)122.71(59.88)88.62(42.14)228 / 3359.18(127.66)207 / 053 / 39132 / 24194 / 820 / 61106 / 646 / 8(1.7)4.6(1.5)5.8(1.8)5.0(1.5)6.2(0.9)3.5(1.4)The results from the System Usability Scale scored the subjective satisfaction with the systembased on performance with these tasks to be: 54 for all clinicians.In addition to the performance data, the following observations and recommendations basedon those findings were made: Most of the deviations and task failures were related to a baseline level of lustinesswhile working through tasks with new functional capabilities or due to configurationartifacts of the usability testing.The highest impact problem identified was in relation to Workflow 170.315(b)(2)Clinical Information Reconciliation when performing medication reconciliation. Theerrors for these tasks pertained to the duplication of Discern Alerts associated withthe warfarin regimen. Cerner’s Discern Alerts depend on configuration by the clientto ensure they are well designed for the type of care and venue within the facility.Proper configuration and a balanced alerting hierarchy by the organization willmitigate this usability issue.The second high impact problem identified was in relation to Workflow170.315(a)(14) Implanted Device when reviewing modifying device data. The higherror rate for this task pertainined to the default display provided for the test device.Mitigation for these problems can be achieved through display rules for the devicetype.Cerner CorporationConfidential Information Cerner Corporation. All rights reserved. This document contains confidential information which may notbe reproduced or transmitted without the express written consent of Cerner.Page 6 of 48
A additional high impact problem regarding Workflow 170.315(a)(4) DrugDrug/Drug-Allergy Interaction Checking was found to be related to the layout andcontent of the alert messages. The physicians were observed having difficultyperforming a clinical decision based on a lack of visual differentiators indicating thepriority and type of alert. Proper configuration and a balanced alerting hierarchy bythe organization will mitigate this usability issue.Cerner CorporationConfidential Information Cerner Corporation. All rights reserved. This document contains confidential information which may notbe reproduced or transmitted without the express written consent of Cerner.Page 7 of 48
INTRODUCTIONThe purpose of this document is to report on summative testing performed by CernerCorporation to evaluate the usability of its PowerChart (Clinical) electronic health record (EHR)software within the intended use of the product for specified workflows. To evaluate andprovide evidence of the usability of this system, the effectiveness, efficiency and usersatisfaction were measured by collecting success rates, error and deviation rates, time on taskand user satisfaction ratings as reported in this document. The areas of improvement providedetailed information about the test results and recommendations for resolving problems. Alltesting artifacts used to perform the usability evaluations are included in the appendices.Cerner CorporationConfidential Information Cerner Corporation. All rights reserved. This document contains confidential information which may notbe reproduced or transmitted without the express written consent of Cerner.Page 8 of 48
METHODParticipantsRecruited participants had a mix of backgrounds and demographic characteristics conformingto the solution and role tested. The following is a table of participants by characteristics,including demographics, professional experience, computing experience. Participant nameswere replaced with Participant IDs so that an individual’s data cannot be tied back to individualidentities.A total of 24 participants were tested on PowerChart (Clinical) software over the course ofthree weeks for 1 hour sessions. Participants in the test were clinical staff representingphysician and nursing roles.See Table 1 for the detailed participant information.Cerner CorporationConfidential Information Cerner Corporation. All rights reserved. This document contains confidential information which may notbe reproduced or transmitted without the express written consent of Cerner.Page 9 of 48
Table 1. All Participants Demographics.1ID # RoleSpecialty0251 MD Psychiatry20546 MDEmergencyMedicine30850 RNCritical Care41158 MDOB/GYN51436 MDFamily Practice61606 MDSurgery71666 MDEmergencyMedicine81744 MDInternalMedicineCerner CorporationEducationDoctoratedegree (e.g.,MD, DNP,DMD, PhD)Doctoratedegree (e.g.,MD, DNP,DMD, PhD)AssociatedegreeMaster'sDegreeDoctoratedegree (e.g.,MD, DNP,DMD, PhD)Doctoratedegree (e.g.,MD, DNP,DMD, PhD)Doctoratedegree (e.g.,MD, DNP,DMD, PhD)Doctoratedegree (e.g.,AgeGender e Experience Experience Computer Male30-39161165NoMale60-6940134NoConfidential Information Cerner Corporation. All rights reserved. This document contains confidential information which may not be reproduced or transmitted withoutthe express written consent of Cerner.Page 10 of 48
91745 MD10 1746 MD11 1748 MD12 1749 MD13 1750 MD14 1751 MD15 1753 RN16 1754 RN17 1755 RNCerner CorporationMD, DNP,DMD, PhD)PediatricsDoctoratedegree (e.g.,MD, DNP,DMD, PhD)NeurologyDoctoratedegree (e.g.,MD, DNP,DMD, PhD)EmergencyDoctorateMed.degree (e.g.,MD, DNP,DMD, PhD)Am. InternalDoctorateMed.degree (e.g.,MD, DNP,DMD, PhD)Family Medicine Doctoratedegree (e.g.,MD, DNP,DMD, PhD)Family Medicine Doctoratedegree (e.g.,MD, DNP,DMD, PhD)NursingAssociatedegreeMedical/Surgical AssociatedegreeMedical/Surgical AssociateMale40-49200 fidential Information Cerner Corporation. All rights reserved. This document contains confidential information which may not be reproduced or transmitted withoutthe express written consent of Cerner.Page 11 of 48
18 1756 RN19 1757 RN20 1758 RN21 1759 RN22 1762 RN23 1763 RN24 1765 RNdegreeFamily Medicine Some collegecredit, nodegreePed. CriticalAssociateCaredegreeMedical/Surgical AssociatedegreeNursingAssociatedegreeCritical eICU/Acute Care 4NoFemale40-49216105NoFemale20-297175No*Computer proficiency is a self-reported rating of comfort with computers, where 5 – very comfortable.Cerner CorporationConfidential Information Cerner Corporation. All rights reserved. This document contains confidential information which may not be reproduced or transmitted withoutthe express written consent of Cerner.Page 12 of 48
Study DesignThe objective of this test was to gather information about Cerner PowerChart (Clinical) usabilitywithin the product’s intended use in acute care or inpatient settings. For the purpose of thisreport, usability is defined as the efficiency, effectiveness and satisfaction of participantsutilizing the system to complete specific task workflows. The results of this test will be used toprovide Cerner product management staff with data to drive future requirements.Tasks and the supporting data setup were designed by Cerner in-house clinicians to simulateclinical practice and to cover the required safety-enhanced design workflows. These materialswere then reviewed by a physician from a client site to further ensure their verisimilitude.Artificiality factors were inadvertently inserted as a result of the data setup and these causedsome challenges for the test participants. Examples of the data setup factors include poor orunrealistic organization of picklists; poor spelling or capitalization in the naming of items to beordered. Additionally, as the environment was shared, data setup was complicated byconflicting configuration requirements so that the testing team encountered unexpectedsystem behaviors at every site.TasksTest tasks were designed to be realistic examples of the tasks a clinician would perform in anacute care setting. A clinical scenario was designed by Cerner in-house clinicians to provide thecontext or background for both sets of tasks. The tasks themselves were written to cover boththe safety-enhanced design workflows required for system certification by the Office of theNational Coordinator for Health Information Technology and additional safety featuresavailable within PowerChart (Clinical). The complete set of tasks and research questionscovered in this usability test are included in Appendices A and B of this document.ProceduresTest participants were scheduled for 60-minute test sessions and arrived as individualparticipants. Each participant was assigned a number to identify results while detaching theidentity of the individual from the responses and observations. A moderator conducted eachtest and introduced the purpose of the testing and its procedures and instructions verbally.Participants completed an online demographic data collection form during the recruitingprocess as part of determining eligibility for the sessions.Cerner CorporationConfidential Information Cerner Corporation. All rights reserved. This document contains confidential information which may notbe reproduced or transmitted without the express written consent of Cerner.Page 13 of 48
Each participant was provided with a clinical scenario providing the background context for thetask workflows. Each participant was given the chance to read the scenario and ask anyquestions, then began to perform the tasks required to achieve the desired outcome. Eachsession was recorded with the Morae software. The facilitator took notes on the participant’sinteraction with the system. Tasks were timed primarily via Morae, starting from the pointwhen the participant clicked the “Start Task” button and ending when the participant clicked“End Task”. In a few cases when participating physicians were obliged to interrupt a task inorder to respond to patient care questions, the recording was paused and resumed followingany interruptions. After each task, the participant was asked to answer one subjective questionrelated to the ease of completing the task.Upon completing all of the tasks, the participant was asked to respond to standard SystemUsability Scale (SUS) questions. Finally, they were encouraged to respond to open-endedquestions and describe any likes or dislikes in regards to the system and their interactions withit.System TestedThe usability testing that was performed is representative of the state of the UI design as itexisted at the time of the usability testing performed on December 12, 2016 to January 7, 2017.Test Location and EnvironmentRemote desktop testing was conducted on a remote desktop using a screen sharing application.The participants used a mouse and keyboard when interacting with the EHR. The testapplication itself was running on a public server using a test database on a LAN/WANconnection. The application was set up according to the solution documentation describing theminimum hardware, software and network configurations. The participant’s interaction withthe EHR was captured and recorded digitally with screen capture software running on the testmachine.Usability MetricsThe system was evaluated for effectiveness, efficiency and satisfaction as defined by measurescollected and analyzed for each participant.The goals of the test were to assess:1. Effectiveness by measuring participant success rates and errors.Cerner CorporationConfidential Information Cerner Corporation. All rights reserved. This document contains confidential information which may notbe reproduced or transmitted without the express written consent of Cerner.Page 14 of 48
2. Efficiency by measuring the participants’ task time and path deviations.3. Satisfaction by measuring ease of use ratings.Test Forms and ToolsDuring the testing, the following forms and tools were used to present and collect data: The Demographics questionnaire collected as part of the recruiting process (SeeAppendix A)Morae Recorder was used to record each test session, time the tasks, and collect datafrom the subjective surveys. The online survey included System Usability Scalequestionnaire. Data collected in Morae was later downloaded to an Excel spreadsheetfor analysis and reporting.General Instructions to participant (See Appendix B)Scenario, Task instructions and Task Rating (See Appendix C & D)Participant InstructionsAppendix B provides the script used by the test moderator when explaining the test proceduresand the purpose of the usability testing.Within the testing sessions when encountering an unfamiliar task workflow (e.g., one nottypically used at the participant’s facility), participants were instructed to try their best to figureit out. Only if they indicated verbally that they were stuck or needed help were participantsprompted as to the use of the system. This provided useful insights on the intuitiveness andlearnability of the user interface.Cerner CorporationConfidential Information Cerner Corporation. All rights reserved. This document contains confidential information which may notbe reproduced or transmitted without the express written consent of Cerner.Page 15 of 48
USABILITY SCORINGThe quantitative information collected consisted of measurable results that we analyzed todetermine how the test participants performed compared to established benchmarks. Some ofthe quantitative information we collected included time spent on task, the percentage of testparticipants succeeding or failing at tasks, and so on. The following table (Table 2) details howtasks were scored, errors evaluated, and the time data analyzed.Table 2. Details of How Observed Data were scored.MeasureScoringEffectiveness: Task SuccessA task was counted as “Passed” if the participant was able toachieve the correct outcome, without assistance. If theparticipant abandoned the task, did not reach the correct answeror performed it incorrectly the task was counted as “Failed”.The total number of successes were calculated for each task andthen divided by the total number of participants that attempted.Successful tasks were evaluated on a threshold of 80% assuccessful.On a qualitative level, an enumeration of errors and error typeswere collected.Effectiveness: Deviation RateThe participant’s path (i.e., steps) through the application wasrecorded. Deviations occur if the participant, for example, wentto a wrong screen, clicked on an incorrect menu item, followedan incorrect link, or interacted incorrectly with an on-screencontrol. This path was compared to the optimal path identifiedfor the task or solution tested.The deviation rate was calculated as the total number of errorsover the total chance for errors across all participants based onthe optimal path.Efficiency: Task TimeEach task was timed from when the participant selected a “StartTask” button until the participant selected an “End Task” button.The task times were then recorded as part of the sessionrecording based on the participant’s selection of the Start andEnd task button. Only task times for tasks that were successfullycompleted were included in the average task time analysis.The average time on task for all participants was used as thebaseline.Satisfaction: System UsabilityParticipant’s subjective impression of the ease of use of theScale (SUS)application was measured by administering a standardized posttask questionnaire.Cerner CorporationConfidential Information Cerner Corporation. All rights reserved. This document contains confidential information which may notbe reproduced or transmitted without the express written consent of Cerner.Page 16 of 48
Satisfaction: Single Ease of UseQuestionScores under 60 represent systems with poor usability; scoresover 80 would be considered above average.At the end of each task, the participant was presented with theSingle Ease of Use survey question. Using a Likert scale (with 1 asvery difficult and 7 as very easy), they were asked to rate thedifficulty of the task.Some of the information collected was qualitative, consisting of subjective impressions andopinions about the solution. Some of the qualitative data collected included: facial expressions,verbal comments when participants “thought out loud”, spontaneous verbal expressions(comments), and miscellaneous activities performed by the participant during the test session.While much of the qualitative commentary was collected during testing, qualitative feedbackwas also gathered in the questionnaires and post-test interviews.To prioritize area(s) of improvement, a categorization of problem severity classification will beused in the analysis of the data collected during evaluation activities. The approach treatsproblem severity as a combination of three factors: the frequency of users experiencing theproblem during the evaluation (likelihood of occurrence), the probability of detecting a problembased on the total number of participants’ evaluated (likelihood of detection), and thelikelihood that harm would occur (severity). The combination of these three factors can be usedto identify a Risk Priority Number (RPN).Critical – RPN values representing high impact problems that prevent a user fromcorrectly completing one or more product functions and may be of serious risk topatient safety.High – RPN values representing moderate to high impact problems that often prevent auser from correctly completing one or more product functions and may be frequent,persistent, or affect many users.Medium – RPN values representing moderate frequency problems with low tomoderate impact that causes users moderate confusion or irritation.Low – RPN values representing low frequency problems with low impact that causeusers mild confusion or irritation. These may include minor inconsistencies that causehesitation or small aesthetic issues.Cerner CorporationConfidential Information Cerner Corporation. All rights reserved. This document contains confidential information which may notbe reproduced or transmitted without the express written consent of Cerner.Page 17 of 48
RESULTSThe results of the usability test were calculated according to the methods specified in theUsability Metrics section above. The data should yield actionable results that, if corrected,produce a material, positive impact on user performance. Any data exlusions or details oftesting irregularities that affected data collection are indicated in each section below. Thequantitative and qualitative summary of responses is indicated for each task below.Workflow 170.315 (a) (1) CPOE MedicationsParticipating physicians were assigned three tasks (see tasks MD7, MD8, and MD15) in whichthey ordered medications or revised existing medication orders.Task Success RateTask Failure RateDeviation RateAverage User sability Results for TaskCerner PowerChart (Clinical) provides configuration options for the end-user personally and forthe facility generally. Participants were warned not to expect to find their personal favorites oreven the departmental picklists that they were accustomed to using in their daily practice. As aresult, they worked a bit slower than usual while learning how medication orders wereorganized in the testing environment. Participating physicians did not encounter any difficultiesin either finding, ordering, or revising the patient’s medications. However, only one of thephysicians demonstrated their knowledge of the provider view functionality and performed thetask using the optimal method through the provider work
Product Tested: PowerChart (Clinical) Version: 2015.01.19 Date of Usability Test: Dec. 12,2016 - Jan. 7, 2017 Date of Report: January 23, 2017 Report Prepared By: Rebecca Green, Ph.D Sr. Creative Lead, Human Factors Cerner Corporation 2800 Rockcreek Parkway Kansas City, MO 64117 816-446-1484 rebecca.green@cerner.com
