Transcription
Decreasing PatientThroughput Time andIncreasing OperationalEfficiency in an OutpatientFamily Medicine ClinicMATIANA GONZALEZ-WRIGHT, EDD, MEDJANUARY – JUNE 20141
TeamMembersCSE Team MemberPGY3PGY2PGY1Matiana Gonzalez-Wright, EdDEdurardo Candanosa, M.D.Gabriela Walsman, M.D.Vladimir Semilla, M.D.Cesar Garza, M.D.Isabel Reyna, M.D.Salvador Elizarraras, M.D.Pamela Venegas, M.D.Heidi Pareja, M.D.Mylien Huynh, M.D.Sr. Research AssistantYusef Mohamed, ALMOffice ManagerMarivel BarreraFront OfficeVerificationMedical AssistantLaboratoryCashierLetty MunozSylvia HernandezMarisa TrevinoRonnie MendozaGracie GarzaPete MartinezMaryanne Vargas2
Background Patient throughput optimization is an essential managementstrategy Cycling patients efficiently and effectively through a clinic assures efficient use of resources enhances patient access improves service Understanding throughput requires a systems perspectiveThe Chartris Group. (2007, Fall). White Paper. Retrieved March 31, 2014, fromhttp://www.chartis.com/files/pdfs/chartis group dfWillis, D (2005, April). Making every minute count: Tools to improve office efficiency. Family Practice Management, 12(4), 61-6.3
What We Are Trying to Accomplish?The aim of the project is to decrease total patient visittime (patient sign to check out) at the McAllen FamilyMedicine Residency Clinic by 60%, with the goal of 60min. and no more than 90 min. by December 2014.4
What is the problem? Patients, physicians and clinic staff have complained that patients arewaiting too long for their visit Physicians commented that they are ready to see a patient at 8:30 butwon’t see one until 10 am Patient Satisfaction survey comments Waiting always more than an hourDid not complete, left after 82 minTold by phone did not need appointment, to come in before 10AMLeft without being seenMinimize the paperwork; Marvin Baker patient since inception of this clinic!!!!!!!5
Understanding the ProblemInterdepartmental interdisciplinary team meetings Clinic administrative staff, physician faculty and residents, andnurses Brainstorming Process Map Cause and Effect /Fishbone Diagram6
Process Analysis – Process MapAttendingis asked tochoose aphysicianpatientwill seePhysicianassignmentsheet madefor patientAssignmentsheet is givento nurse toassign aphysicianForm is takenback to thefront deskInformationis enteredinto Cernerand SMS byfront staffEstablishedwalk-inNurseAssignsphysicianto patientMA reviewspatient info labs, meds,etcMDdocumentsvisit inCernerSchedulerschedules afollow upappointmentPatientSigns InPatient hasinsurancePatient mayneed PCPchangePatient goesto cashierfor copayPatient doesnot haveinsurancePatientrefered tosocial workerfor potentialcoveragePatientwaits to seeMD or visit isrescheduledPatientWaits to becalled byMAMA checksschedule andlist of patientsready to beseenMA callspatient inand checksvitalsMA putspatient inroom andinforms MDMD entersroom to seepatientMD informsMA thatvisit iscompleteMDcompletesvisitPatient takespaperwork tocashier/schedulerVerifyinsuranceWalk-inPrivate paypatients paybillIs patientOB?YesNOMA goesback in tosee patientNew walk-inPaperworkgiven topatientPatient returnscompletedpaperworkInformationis enteredinto SMS andEMD7
Process Analysis – Process MapMA reviewspatient info labs, meds,etcPatientSigns InScheduledPatient hasinsurancePatient mayneed PCPchangePatient goesto cashierfor copayPatient doesnot haveinsurancePatientrefered tosocial workerfor potentialcoveragePatientwaits to seeMD or visit isrescheduledPatientWaits to becalled byMAMA checksschedule andlist of patientsready to beseenMA callspatient inand checksvitalsMA putspatient inroom andinforms MDMD entersroom to seepatientMDdocumentsvisit inCernerSchedulerschedules afollow upappointmentMD informsMA thatvisit iscompleteMDcompletesvisitPatient takespaperwork tocashier/schedulerVerifyinsurancePrivate paypatients paybillIs patientOB?YesPaperworkgiven topatientPatient returnscompletedpaperworkInformationis enteredinto SMS andEMDMA goes back in to seepatient8
Process Analysis – Fishbone DiagramCommunicationLack of communicationPatient phone callsPharmacy CallsTrainingNumber of staff at front deskNumber of MasAttentiveness of MATaking or not taking vital signsStaffResidents & FacultyNumber of faculty available in clinicResidents as role modelsMultiple consults w/o document sharingFamiliarity with EMRMDs eating at nursing stationAbsent or late MDTextingNumber of patients seen per dayScheduled vs. walk-inAttitudeTimelinessMultiple Co-morbiditiesCompleting demographic sheetPatient educationFirst time patientPatientsMethodsProcedure schedulingInsurance izationPrice of service (change in pricing)Medications not in chartVolume in the labDouble chargesDouble registrationLabs not in fileAssign walk-in to resident or attendingRegistration process3 systemsAvailability of internetSMSPrinter not workingCerner trainingMachinesTime of dayDay of weekMeasurementEnvironmnentRooms AvailablePatientThroughputBP monitor not workingTrainingMaterials9
Baseline StatusRetrospective chart review (EMR)Stratified random sampleFebruary 11 to 28, 20145 am & 5 pm visits, M-F (n 119)Both genders, all ages and who had a physician visitCycle time measurement was performed to help reveal bottlenecks andwasteStatistical analysis using Excel10
Baseline Data Collection ToolMFPRC - Patient Throughput Data Collection ToolDate:Pt. Name:Physician Name:Time Intervals:TimeSign InCheck-inSeen by NurseCheck-outPatient Information (for completion by QI data collector)ScheduledAppointment time:Walk-inNew PatientPrivate PayEstablished PatientMedicareMedicaidFollow-upInsuranceLabMD Visit11
Baseline Data Collection SOPPatient Throughput: Chart Audit Form SOPOpen Cerner PM to access patient schedule1. Go to assigned date and randomly select 5 morning and 5 afternoon patients for each day, makingsure to only select patients that were fully checked out and were not here for just labs2. The name, MRN, physician, and insurance can recorded before selecting patient name3. After clicking on patient name, go to ‘Past Appointments’ tab, deselecting filters box ifappointment does not appear4. Right-click on appointment with physician as Resource (not lab), and select ‘Display AppointmentHistory’5. Select ‘Action History Details’ to record Check-in, Seen by Nurse, and Check-out times6. Vitals by Nurse time is the same as time of Chief Complaint on doctor’s note from PowerChart7. From PowerChart you can see whether patient is New/Established, Follow-Up/MD(initial visit)12
Decision MakingBaseline Data2/11 - 2/28; n 578 patients (excluding lab only)
No Show vs. Walk-in vs. Scheduled
Scheduled vs. Walk-In
Payment Type
Baseline PerformanceProcess Capability Report for Baseline Throughput TimeProcess DataLSL*Target60USL90Sample Mean 151.05Sample 0300350400Time (min)17
Baseline PerformanceI-MR Chart of Baseline11Individual Value300UCL 267.5200X 151.11000LCL 34.611529431Moving Range20015015771Observation859911312711UCL 143.010050MR 43.818
Baseline PerformanceMFMRP Clinic ThroughputTarget: 60 minUSL: 90 minn 140Yy1y2y3Clinic Sign-in to Check-outSign-in to Admission/Check-inAdmission/Check-in to Nurse receives patientNurse receives patient to Check-outBaselineTAT (min)MeanStd. Dev.151.143.44823.329.420.573.738.119
Baseline PerformanceData Collection Period2/11/14- 2/28/14n 140BASELINEMood's MedianY Patient Throughput nceP-ValueStatisticallySignificantDifferenceHo: There is no difference in throughput time by day ofweek0.301NO0.239NOHo: There is no difference in throughput time by time ofday (morning/ afternoon)0.310NO0.009YESHo: There is no difference in throughput time by patientstatus (established/new)0.353NO0.114NOHo: There is no difference in throughput time byinsurance class (Medicaid, Medicare, Hidalgo CountyIndigent, Commercial Insurance, & Private Pay)0.259NO0.264NOHo: There is no difference in throughput time by visit type(scheduled/ walk-in)0.314NO0.922NOHo: There is no difference in throughput time by visit type(initial/follow-up)1.000NO0.691NO20
Time of DayTest for Equal Variances: Y: Baseline Total Throughput Time vs Morn/AftrMultiple comparison intervals for the standard deviation, α 0.05Multiple ComparisonsP-Value0.023P-Value0.009Levene’s TestMorn/Aftram3035404550556065If intervals do not overlap, the corresponding stdevs are significantly different.21
Time of Dayn 140n 70n 70
Decision MakingAttendingis asked tochoose aphysicianpatientwill seePhysicianassignmentsheet madefor patientAssignmentsheet is givento nurse toassign aphysicianForm is takenback to thefront deskInformationis enteredinto Cernerand SMS byfront staffEstablishedwalk-inNurseAssignsphysicianto patientMA reviewspatient info labs, meds,etcMDdocumentsvisit inCernerSchedulerschedules afollow upappointmentPatientSigns InPatient hasinsurancePatient mayneed PCPchangePatient goesto cashierfor copayPatient doesnot haveinsurancePatientrefered tosocial workerfor potentialcoveragePatientwaits to seeMD or visit isrescheduledPatientWaits to becalled byMAMA checksschedule andlist of patientsready to beseenMA callspatient inand checksvitalsMA putspatient inroom andinforms MDMD entersroom to seepatientMD informsMA thatvisit iscompleteMDcompletesvisitPatient takespaperwork tocashier/schedulerVerifyinsuranceWalk-inPrivate paypatients paybillIs patientOB?YesNOMA goesback in tosee patientNew walk-inPaperworkgiven topatientPatient returnscompletedpaperworkInformationis enteredinto SMS andEMDRank Ordering23
Improvement EffortsPATIENT ADMITTING/REGISTRATIONBEFOREStaff members assumed specific tasksAFTERStaff were cross-trained to schedule appointments,verify benefits and enter patient information intothe EMRStaff had offices througout the clinicStaff were moved to front office so that they areeasily accessible/availableGreeter would sign in patient then be responsible foradmitting and registering the patientGreeter now signs in patient, gives patientpaperwork and asks patient if he/she requiresassistanceFront office staff (2-3) were responsible for entering all Completed paperwork it is handed to the first staffregistration into EMRmember (6) available to enter into the EMR24
Improvement EffortsSCHEDULING25
Improvement Efforts26
Improvement EffortsSCHEDULINGBEFOREScheduled and walk-in patients waitedappoximately the same time to be seen.Patients learned it was easier to come in as awalk-inAFTERScheduled patients are prioritized; separatetracking sheets help identify scheduled vs. walkin patientsPatients who had been seen were asked to callthe clinic to schedule a follow-up appointmentGoal is to make physician schedule available atleast 3 months outPatients who called the clinic were told to come Patients who call the clinic are given anin before 3pm if they wanted to be seen thatappointment, including same day appointmentsdayScheduler placed reminder calls the day before Automated appointment reminder calls nowscheduled appointmentsoccur in the evening before 6- 8 pm two daysbefore an appointmentNo-shows did not receive a follow-up call toreschedulePatient no-shows and cancelled appointmentsare rescheduled27
Pilot 1 Improvements: February 28 - March 10, 2014 Similar data collection methodology Retrospective chart review (EMR) Stratified random sampleMarch 11-24, 20145 am & 5 pm visits, M-F (n 119)Both genders, all ages and who had a physician visit28
Process Capability Report for Baseline Throughput TimePilot 1 - ResultsMETRICSBASELINEPILOT Maximum348minutes389minutesProcess DataLSL*Target60USL90Sample Mean 151.05Sample 0300350400Time (min)Process Capability Report for Pilot 1 Throughput TimeProcess DataLSL*Target60USL90Sample Mean 136.731Sample N119Shape2.83165Scale152.589Target USLHypothesis TestingP-Value(Baselineto Pilot 1)Levene’s Testp 0.920Mann Whitneyp 0.0050100150200250Time (min)30035040029
Pilot 1 - ResultsYy1y2y3MFMRP Clinic nd Time (minutes)MeanStd. Dev.Mean Std. Dev.p valueClinic Sign-in to Check-out151.143.4136.747.60.920.00Sign-in to Check-in to Nurse receives patient29.420.525.920.70.700.01Nurse receives patient to Check-out73.738.177.541.40.640.2530
Pilot 1 - ResultsData Collection PeriodBaseline: 2/11/14- 2/28/14Pilot 1: 3/11/14- 3/26/14PILOT 1Mood's MedianLevene'sY Patient Throughput TimeP-ValueStatistically nt DifferenceHo: There is no difference in throughput time by day of week0.863NO0.919NOHo: There is no difference in throughput time by time of day(morning/ afternoon)0.648NO0.821NOHo: There is no difference in throughput time by patientstatus (established/new)0.018YES0.130NOHo: There is no difference in throughput time by insuranceclass (Medicaid, Medicare, Hidalgo County Indigent,Commercial Insurance, & Private Pay)0.521NO0.466NOHo: There is no difference in throughput time by visit type(scheduled/ walk-in)0.793NO0.503NOHo: There is no difference in throughput time by visit E0.558NO31
Pilot 1 - ResultsBoxplot of Pilot 1 Throughput Time (min) vs Est/New127.5Est/Newe167n50100150200250Throughput Time (min)30035040032
Additional ImprovementsRN Present in clinic to help troubleshoot and manage patient flow Balance resident workload by distributing walk-ins Preps rooms for physicians to avoid additional movementClinic Staff Medical assistants help balance workload by assisting eachother with vitals No longer “my doctor” mindset33
Additional ImprovementsScheduling Wellness exams are scheduled 30-45 min Reschedule: no-show scheduled patients are called the same dayor no more than one business day from missed appointment 10:30 am and 3:30 pm reminder calls for scheduled appt. 5/20 – 6 pm reminder phone call day beforeFlow On Wednesdays, high-risk OB moved to another part of the clinicto free up patient exam rooms34
Pilot 2 - ResultsProcess Capability Report for Baseline Throughput TimeMETRICSBASELINEPILOT 1PILOT 2Dates2/11/20142/28/20143/11/20143/24/20144/21/14 imum348minutes389minutes234minutesProcess DataLSL*Target60USL90Sample Mean151.05Sample N140Shape3.47054Scale167.043P-Value(Baselineto Pilot 2)p 0.920100150200250300350400Time (min)Process Capability Report for Pilot 1 Throughput TimeTargetProcess DataLSL*Target60USL90Sample Mean136.731Sample 0400Time (min)Process Capability Report for Pilot 2Process DataLSL*60TargetUSL90Sample Mean119.866Sample N97Shape3.34331Scale133.348Levene’s TestUSL50Hypothesis TestingP-Value(Baselineto Pilot 1)TargetTargetUSLMann Whitneyp 0.00Levene’sTestp 0.304MannWhitneyp 0.0050100150200250Time (min)30035035400
Pilot 2 - ResultsBefore/After I-MR Chart of Baseline vs Pilot 2Moving RangeIndividual ValueBaseline300Pilot 2UCL 267.5UCL 224.4X 151.1X 119.9150LCL 15.30LCL 34.6200UCL 143.0UCL 128.5100MR 39.3MR 43.8LCL 00125497397121145169193217LCL 036
Pilot 2 - ResultsBefore/After Xbar-S Chart of Baseline vs Pilot 2Mean200150LCL 112.29StDevLCL 85.1UCL 68.20UCL 61.10S 39.74S 35.604020UCL 154.6X 119.9X 151.0510060Pilot 2BaselineUCL 189.81LCL 11.271357911131517192123LCL 10.1037
Pilot 2 - ResultsYy1y2y3Clinic Sign-in to CheckoutSign-in to Check-inCheck-in to NurseNurse to Check-out Mean151.148.029.473.7MFMRP Clinic ThroughputBaselinePilot 2Throughput Time (minutes)Std. Dev.MeanStd. 9.2Levene'sMann- er documentationResident conducts wellness exam; attending will repeat exam (2 visits)Checkout pending completion of doctor’s documentationHealthWorks (May)38
Pilot 2 - ResultsData Collection Period Baseline:2/11/142/28/14Pilot 1: 3/11/143/26/14Pilot 2: 4/21/14- 5/2/14PILOT 2Mood's MedianY Patient Throughput nceP-ValueStatisticallySignificantDifferenceHo: There is no difference in throughput time by dayof week0.022YES0.689NOHo: There is no difference in throughput time by timeof day (morning/ afternoon)0.92NO0.967NOHo: There is no difference in throughput time bypatient status NOHo: There is no difference in throughput time byinsurance class (Medicaid, Medicare, Hidalgo CountyIndigent, Commercial Insurance, & Private Pay)0.152NO0.072APPROACHINGSIGNIFICANCEHo: There is no difference in throughput time by visittype (scheduled/ walk-in)0.039YES0.388NOHo: There is no difference in throughput time by visittype (initial/follow-up)0.525NO0.241NOEntries39
Total OTReturn on 0.13166.0824.37830.4315.13515.2762% decreaseClinicalSupport54.8666.58 111.2232.0354.8657.96 111.2227.9954.8649.95 111.2226.1254.8617.18 111.2212.9554.8613.63 111.2210.74274.3205.3 556.1109.8369446.27 1,174.38 5,087.48Annualized: 30,052.8040
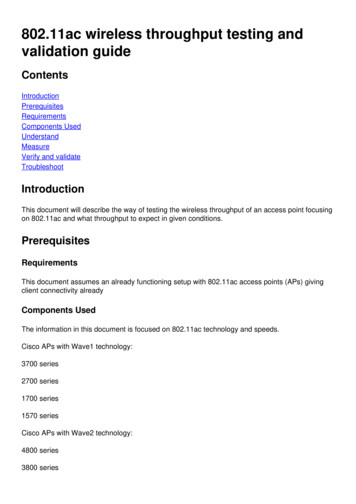
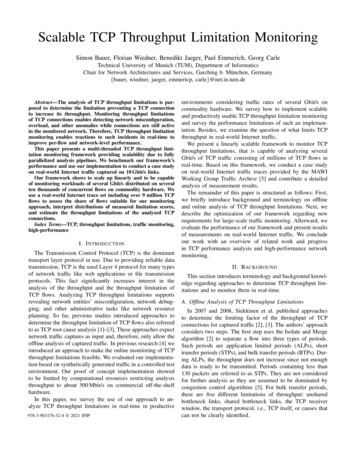
Patient Satisfaction SurveyEase of Getting CarePhysicianNurses/MA'sAll othersFacilityOverall12345678910111213SURVEY QUESTIONSHours center is openConvenience of center’s locationAbility to get in to be seenListened to your concernsExplained your problem and plans for treatment clearly and understandablyAnswered your questions to your satisfactionTook enough time with youFriendly and helpful to youAnswered your questionsFriendly and helpful to youAnswered your questionsNeat and cleanOverall Quality of Care
Patient Satisfaction Survey42
Patient Satisfaction Survey2/21-3/19n 1624/15 - 4/22n 7143
Thank you!44
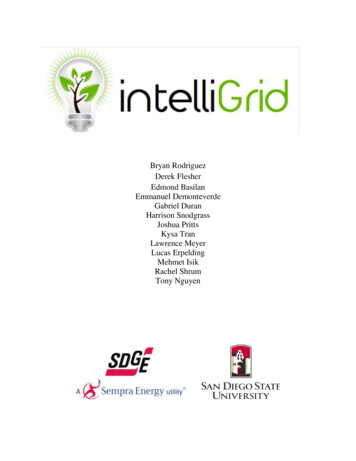
Return on InvestmentJuly 2012 – April 2013July 2013 – April 20143% increase (n 190)Total Net Revenue 15,127.8045
Return on InvestmentMETRICSMarchApril2012 -20135966152013 -2014681739increase85124% increase14.3%20.2%46
47
Established vs. NewTotal Throughput Established vs. New Box Plot381.25331.25Time New48
Scheduled vs. Walk-inTotal Throughput by Patient Status Box Plot378328Time (min)2782281781287828ScheduledWalk-in49
Payment TypeTotal Throughput by Payment Type Box Plot375325Time Private Pay50
Day of WeekTotal Throughput by Day of the Week Box Chart416366316Time yFriday51
Visit TypeTotal Throughput by Visit Type Box Blot378.75328.75Time itial Visit52
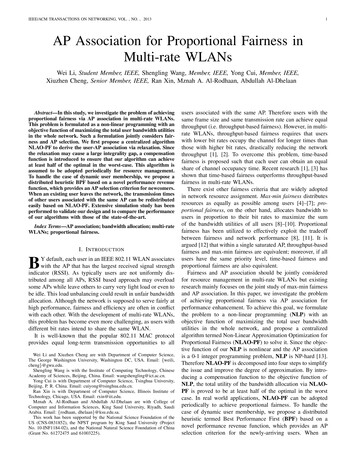
Patients Seen by MD ClassificationPGYBeginning of Year –clinic pts / day16 - 206- 8426 - 32321Total# ResidentsPGY 1PGY2PGY3Pts NeededPGY 1PGY 2PGY 3# patients neededPatients SeenPGY 1PGY 2PGY 3# patients% metEnd of Year –clinic pts / day24106 -840 - 42Mon Tues Wed ThursFriTues Wed ThursFriMon Tues Wed ThursFri Total11-Feb 12-Feb 13-Feb 14-Feb 17-Feb 18-Feb 19-Feb 20-Feb 21-Feb 24-Feb 25-Feb 26-Feb 27-Feb 2131%34%24%36%40%57%33%42%57%54%43%48%47%39%42%
Residents Scheduled vs. PatientsSeenMon# ResidentsPGY hursFriTotal11-Feb 12-Feb 13-Feb 14-Feb 17-Feb 18-Feb 19-Feb 20-Feb 21-Feb 24-Feb 25-Feb 26-Feb 27-Feb 081112141210124008412612079% metPGY 2PGY 101083%101033%1010252150%10850%10866%185120% metPGY 3PGY 265%708179% s Needed vs. Actual*PGY 1PGY 1*
Retrospective chart review (EMR ) Stratified random sample February 11 to 28, 2014 5 am & 5 pm visits, M-F (n 119) . Vitals by Nurse time is the same as time of Chief Complaint on doctor's note from PowerChart 7. From PowerChart you can see whether patient is New/Established, Follow-Up/MD(initial visit) 12. Decision Making.