Transcription
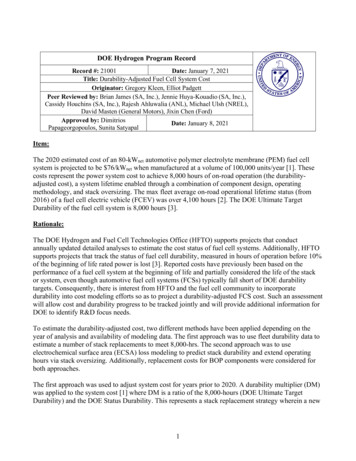
DOE Hydrogen Program RecordRecord #: 21001Date: January 7, 2021Title: Durability-Adjusted Fuel Cell System CostOriginator: Gregory Kleen, Elliot PadgettPeer Reviewed by: Brian James (SA, Inc.), Jennie Huya-Kouadio (SA, Inc.),Cassidy Houchins (SA, Inc.), Rajesh Ahluwalia (ANL), Michael Ulsh (NREL),David Masten (General Motors), Jixin Chen (Ford)Approved by: DimitriosDate: January 8, 2021Papageorgopoulos, Sunita SatyapalItem:The 2020 estimated cost of an 80-kWnet automotive polymer electrolyte membrane (PEM) fuel cellsystem is projected to be 76/kWnet when manufactured at a volume of 100,000 units/year [1]. Thesecosts represent the power system cost to achieve 8,000 hours of on-road operation (the durabilityadjusted cost), a system lifetime enabled through a combination of component design, operatingmethodology, and stack oversizing. The max fleet average on-road operational lifetime status (from2016) of a fuel cell electric vehicle (FCEV) was over 4,100 hours [2]. The DOE Ultimate TargetDurability of the fuel cell system is 8,000 hours [3].Rationale:The DOE Hydrogen and Fuel Cell Technologies Office (HFTO) supports projects that conductannually updated detailed analyses to estimate the cost status of fuel cell systems. Additionally, HFTOsupports projects that track the status of fuel cell durability, measured in hours of operation before 10%of the beginning of life rated power is lost [3]. Reported costs have previously been based on theperformance of a fuel cell system at the beginning of life and partially considered the life of the stackor system, even though automotive fuel cell systems (FCSs) typically fall short of DOE durabilitytargets. Consequently, there is interest from HFTO and the fuel cell community to incorporatedurability into cost modeling efforts so as to project a durability-adjusted FCS cost. Such an assessmentwill allow cost and durability progress to be tracked jointly and will provide additional information forDOE to identify R&D focus needs.To estimate the durability-adjusted cost, two different methods have been applied depending on theyear of analysis and availability of modeling data. The first approach was to use fleet durability data toestimate a number of stack replacements to meet 8,000-hrs. The second approach was to useelectrochemical surface area (ECSA) loss modeling to predict stack durability and extend operatinghours via stack oversizing. Additionally, replacement costs for BOP components were considered forboth approaches.The first approach was used to adjust system cost for years prior to 2020. A durability multiplier (DM)was applied to the system cost [1] where DM is a ratio of the 8,000-hours (DOE Ultimate TargetDurability) and the DOE Status Durability. This represents a stack replacement strategy wherein a new1
stack is purchased for the power plant so the total life may be extended to 8,000 hours. The DOE StatusDurability is based on testing conducted at NREL’s National Fuel Cell Technology Evaluation Center(NFCTEC) and adopts their values for on-road max fleet average durability hours [2] as this is judgedto most closely represent the durability of fuel cell vehicles in the field. The durability-adjusted FCScost equation is shown below where Cstack is the status stack cost (for a given year) and CBOP is thestatus balance of plant (BOP) cost, all costs in /kWnet. Stack cost is multiplied by the DM to representthe cost of the original stack plus any replacement stacks needed to achieve 8,000 hours of totaloperation. BOP cost is multiplied by 130% to represent the cost of the original BOP components(100%) plus the cost (30%) of BOP components that may not currently last 8,000 hours. 1 The costportion of the BOP to be replaced is based on the cost of (1) valves and hoses that contain rubber ornylon, (2) the membrane air humidifier 2 (if used) whose ionomer membrane is subject to degradationunder relative humidity (RH) cycling, freeze/thaw cycles, and exposure to high temperatures, (3)coolant pumps, thermostat valves, and other miscellaneous components that may be similar to ICEVcomponents that require periodic replacement, and (4) installation cost of the replacement components.Installation cost is approximated as a value equal to the BOP replacement component cost (i.e., a50%/50% split between labor and materials). 3 This approach has the advantages of being simple toapply and appropriately reflects the general trends as lifetime and cost are varied. Future efforts areanticipated to improve the cost estimation methodology and accuracy.Durability-Adjusted FCS Cost 𝐷𝐷𝐷𝐷 (𝐶𝐶𝑠𝑠𝑠𝑠𝑠𝑠𝑠𝑠𝑠𝑠 ) (1.3) (𝐶𝐶𝐵𝐵𝐵𝐵𝐵𝐵 )In 2020, DOE-funded analyses projected the durability-adjusted cost of FCSs (using the secondapproach) through both material improvements and system design and operation. Argonne NationalLaboratory modeled operating protocols that allow the stacks to produce their targeted power levels butunder stack conditions that minimize degradation. 4 These operating protocols, which primarily limithigh cell voltages by controlling the relative humidity and air flow rate through the stack, are projectedto reduce electrode degradation from ECSA loss and extend stack operation. The operatingtemperatures and RH were selected to be benign toward membrane stability, but further work isrecommended to verify this conclusion. Argonne projected light duty vehicle fuel cell power systemlifetime can be extended to 8,000 hours when coupled with an increase in total Pt loading(0.175mgPt/cm2), stack oversizing, 5 and other features. 6 Consequently, the system cost for 2020 doesnot employ a stack replacement strategy as used in past years, but rather a stack operation andIndustry feedback suggests BOP components may achieve the full 8,000 hours; estimates will be updated in future years.Based on ANL modeling, the 2020 system does not include a humidifier. W. B. Johnson, “Materials and Modules for LowCost, High Performance Fuel Cell Humidifiers,” Final Report, DE-EE0000465, 2015.3If a H2 recirculation pump were used, an additional 30% of BOP cost would be included as a replacement BOP cost. Allsystem cost results presented here do not include a H2 recirculation pump. Air compressors are assumed to last the full8,000 hour life of the vehicle.4R. K. Ahluwalia, X. Wang, J-K Peng, V. Konduru, S. Arisetty, N. Ramaswamy, and S. Kumaraguru, “Achieving 5,000-hand 8,000-h Low-PGM Electrode Durability on Automotive Drive Cycles,” Submitted for publication in Journal ofElectrochemical Society, Dec. 2019.5Stack oversizing refers to use of a physically larger stack so that power degradation only lowers system power to theacceptable level (i.e., only a 10% reduction below beginning of life rated power). 2020 stack oversizing is estimated to be23% of total active area.6A variety of features are postulated for the system to meet 8,000 hours without a stack replacement: voltage monitoringsystem, dummy cells at each end of the stack, and 10% system cost contingency to account for non-enumerated systemchanges for durability.122
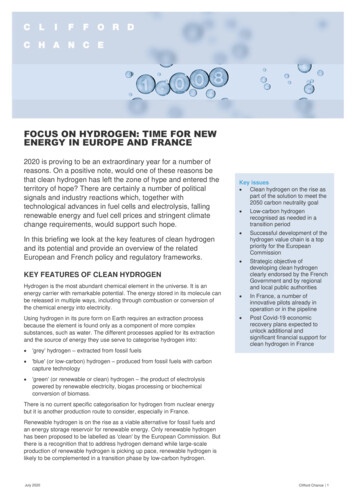
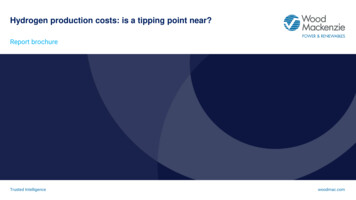
oversizing strategy to achieve 8,000 hours. This type of oversizing or end-of-life based analysis issimilar to the battery electric vehicle cost analysis conducted by Argonne. An additional 30% of BOPreplacement costs were also included for the 2020 system, as detailed in the previous paragraph.The unadjusted cost (initial system purchase cost), durability hours, corresponding DM, and durabilityadjusted cost for each year at 500k and 100k units per year manufacturing rate are listed in Table 01720182019UnadjustedCost at500kunits/yr( /kW)1401188476635755545352534445452020 946YearUnadjustedCost at 100kunits/yr( /kW)StackDurability(hrs) 7, DurabilityAdjustedCost at 500kunits/yr( urabilityAdjusted Costat 100k units/yr( y toAchieve 8,000hoursStack ReplacementStack ReplacementStack ReplacementStack ReplacementStack ReplacementStack ReplacementStack ReplacementStack ReplacementStack ReplacementStack ReplacementStack ReplacementStack ReplacementStack ReplacementStack ReplacementStackOperation/OversizeTable 1. Unadjusted and adjusted cost, stack durability in hours, and durability multiplier for eachyear. *Represents a year in which status hours were documented in the DOE 2016 Durability Record[2]. Years without an asterisk and prior to 2016 use extrapolation between recorded status years. Inyears 2017 to 2019, the status hours for 2016 are repeated due to limited data after 2016.The durability-adjusted cost for each year at 100,000 units per year is shown in Figure 1. The DOEUltimate Cost Target of 30/kW is logically assumed to meet the 8,000 hour DOE target lifetime.Error bars are shown for each projected system for the years in which cost uncertainty analysis wasconducted. The uncertainty bars represent the middle-90% confidence band in durability-adjusted costand were determined by combining the unadjusted-cost uncertainty with the durability multiplieruncertainty. Cost uncertainty was estimated using Monte Carlo analysis. 10 Durability uncertainty wasNote that the increase in values each year was not due to technological changes, but in fact more data allowing higherprojections with a reasonable certainty.8Hours of operation to reach 10% voltage degradation.9As the 2020 system does not require a stack replacement, the durability adjusted cost equation does not apply to the 2020system. Instead, as mentioned in the body of the document, the durability adjusted cost contains four main categoriessumming to 24/kW at 100k sys/yr: (1) cell voltage monitor and dummy cells, 2/kW, (2) durability adjusted operatingconditions and oversizing, 6/kW, (3) 10% system cost contingency for durability, 6/kW, and (4) 30% BOP replacement, 10/kW. Note that 52/kW (at 100k sys/yr) includes adjustments from previous studies, such as an increase in ionomer cost.10Monte Carlo analysis results for each year are reported in the corresponding year’s DOE Cost Record. Each analysisstochastically varies approximately 17 fuel cell stack and system parameters to project the probability distribution of FCScost.73
estimated from the NFCTEC on-road stack durability data. 11 Note that the uncertainty in stackdurability is largely due to sparseness of data and is the predominant cause of the large error bars from2014 to 2019. In contrast, the 2020 projection is not based on the stack durability data as it uses stackoversizing to achieve full lifetime. Instead, the durability uncertainty is represented by a /-20%variation in stack oversizing based on the anticipated uncertainty in the stack degradation rate. Overall,the 2020 total system error bars are narrower as they are predominantly determined by cost projectionuncertainty, rather than stack oversizing uncertainty. Note that the current analysis focused on theprimary mechanisms for performance loss―degradation of the cathode electrode due to Pt dissolution,leaching of transition metal, ECSA loss by Pt dissolution/migration/growth, and rearrangement ofcatalyst particles within the pores of the catalyst support. Other life-limiting degradation mechanismsresponsible for carbon corrosion and membrane instability may also need to be considered in the futureas more information becomes available.Figure 1. Durability-adjusted cost of an 80-kWnet PEM fuel cell system based on projection to highvolume manufacturing at 100,000 units/year, reported in 2016 .Stack durability for each year was varied by /-30%. Reported NREL durability values varied considerably year to year.This durability uncertainty value is to be further investigated in the future.114
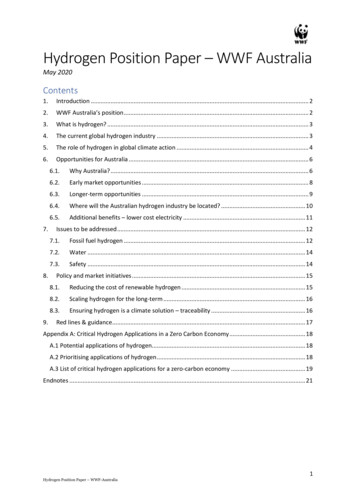
08080Net system power87.787.988.8kWgross88.488.4Gross stack power525254%5252Stack rated power efficiencyb0.6590.6630.677V0.6570.657Cell voltage at rated power1.41.51.51.51.5Air stoichiometric ratiob2.52.52.52.52.5atmStack inlet pressurebStack exit maximum C9494959592coolant l PGMc loadingb312015g1919Total Pt usage over life7491,0951,240dmW/cm21,1831,183MEA areal power density0023%%00Active area oversizinge1.451.451.451.451.45kW/ CQ/ TUnadjusted system cost /kWnet6049505052(100k sys/yr)Adjusted system cost (100k /kWnet9978797976sys/yr)aThe LDV system cost model was not updated in 2019, therefore all characteristic values are the sameas in 2018.bOptimization parameter.cPGM: platinum group metal.d2020 power density is a design point prior to accounting for oversizing the active area. Operationalpower density would be around 1,006 mW/cm2.eQ/ T is a measure of radiator size and is defined as [Stack Gross Power x (1.25 V – Cell Voltage atRated Power) / (Cell Voltage at Rated Power)] / [(Stack Coolant Exit Temperature ( C) - ambienttemperature (40 C)].Table 2. System design parameters and system cost evaluated at rated power from 2016 to 2020.While the fuel cell system costs (prior to durability adjustment) are based on a series of annual costrecords [4], from 2007 to 2017, they require further adjustment to enable a fair comparison across theyears. As described in the 2013 Cost Record #14012, cost values from 2012 and earlier were adjustedto account for higher platinum price, realigned compressor and expander efficiencies, and the Q/ΔTrequirement introduced in 2013. Furthermore, all costs were adjusted to 2016 (as they had beenpreviously reported in nominal year dollars).One point of note in the current method of durability-adjusted cost estimation is that the cost values foreach year are for state-of-the-art fuel cell catalysts and systems that do not exactly match up with theon-road durability-tested FCEVs in that same year. For example, a FCEV on the road likely has anolder technology catalyst and higher Pt loading than what is assumed for a state-of-the-art (lab tested)system in the same year. However, without long term, real-world durability data on current state-ofthe-art fuel cell systems, the only available independently validated durability data based on real-worldoperation of FCEVs was used in this analysis.5
References[1] B. D. James, J. M. Huya-Kouadio, and C. Houchins, “Final Report: Mass Production CostEstimation of Direct H2 PEM Fuel Cell Systems for Transportation Applications 2020,” StrategicAnalysis Inc., Arlington, VA (United States), [Preprint] (January 2021).[2] A. Wilson, J. Marcinkoski, and D. Papageorgopoulos, “On-Road Fuel Cell Stack Durability 2016,” U.S. DOE Fuel Cell Technologies Office, Record # 16019 (2016).https://www.hydrogen.energy.gov/pdfs/16019 fuel cell stack durability 2016.pdf[3] “Fuel Cell Technologies Office Multi-Year Research, Development, and Demonstration Plan Section 3.4 Fuel Cells.” U.S. DOE Fuel Cell Technologies Office 7/05/f34/fcto myrdd fuel cells.pdf[4] “Fuel Cell System Cost,” U.S. DOE Fuel Cell Technologies Office, Records # 8002, 8019, 9012,10004, 10004, 11012, 12020, 14012, 15015, 16020, 17007 ram records.html#fuel cells6
The 2020 estimated cost of an 80-kW. net. automotive polymer electrolyte membrane (PEM) fuel cell system is projected to be 76/kW. net. when manufactured at a volume of 100,000 units/year [1]. These . DOE Hydrogen Program Record 21001: Durability-Adjusted Fuel Cell System Cost .