Transcription
Hydrogen InsightsA perspective on hydrogen investment,market development and costcompetitivenessFebruary 2021
Published in January 2021 by the Hydrogen Council. Copies of this document are available uponrequest or can be downloaded from our website:www.hydrogencouncil.com.„This report was authored by the Hydrogen Council in collaboration with McKinsey & Company.“The authors of the report confirm that:1. There are no recommendations and/or any measures and/or trajectories within the report thatcould be interpreted as standards or as any other form of (suggested) coordination betweenthe participants of the study referred to within the report that would infringe EU competition law;and2. It is not their intention that any such form of coordination will be adopted.Whilst the contents of the Report and its abstract implications for the industry generally can bediscussed once they have been prepared, individual strategies remain proprietary, confidential andthe responsibility of each participant. Participants are reminded that, as part of the invariablepractice of the Hydrogen Council and the EU competition law obligations to which membershipactivities are subject, such strategic and confidential information must not be shared orcoordinated – including as part of this Report.Hydrogen Insights Report 2021Hydrogen Council, McKinsey & Company
ContentsExecutive summaryiiiI. Introduction and methodology2— Hydrogen Insights is a leading global perspective on hydrogen2— The Hydrogen Insights report methodology3II. Deployment and investment6— Tremendous momentum exists, with over 200 H2 projects announced worldwide6— More than USD 300 billion in H2 investments through 20307— Regulation and government support drive this momentum8III. Hydrogen supply12— Renewable hydrogen could break even with gray H2 before 2030 in optimal regions12— Electrolyzer capex savings can reduce costs quickly in a rapid global scale-up15— Expected electrolyzer learning curves could be too conservative15IV. Hydrogen distribution and global supply chains18— The optimal H2 transport mode will vary by distance, terrain and end-use:no universal solution exists18— Hydrogen pipelines20— Hydrogen carriers21— Hydrogen global transport can cost less than USD 2-3/kg24V. End applications26— The cost competitiveness of hydrogen applications26— Hydrogen production cost breakeven27A. Road transport and mining equipmentB. AmmoniaC. SteelD. Sustainable shipping fuelsE. Aviation2831323437VI. Implementation: bringing it all together to capture the promise of hydrogenHydrogen Insights Report 2021Hydrogen Council, McKinsey & Company42iii
Executive summaryHydrogen is gathering strong momentum as a key energy transitionpillarUnderpinned by a global shift of regulators, investors, and consumers toward decarbonization,hydrogen (H2) is receiving unprecedented interest and investments. At the beginning of 2021,over 30 countries have released hydrogen roadmaps, the industry has announced more than 200hydrogen projects and ambitious investment plans, and governments worldwide have committedmore than USD 70 billion in public funding. This momentum exists along the entire value chain andis accelerating cost reductions for hydrogen production, transmission, distribution, retail, and endapplications.Similarly, having grown from 60 to over 100 members since 2020, the Hydrogen Council nowrepresents more than 6.6 trillion in market capitalization and more than 6.5 million employees globally.This report provides an overview of these developments in the hydrogen ecosystem. It tracksdeployments of hydrogen solutions, associated investments and the cost competitiveness ofhydrogen technologies and end applications. Developed collaboratively by the Hydrogen Council andMcKinsey & Company, it offers a fact-based, holistic, quantitative perspective based on real industrydata. Along with the report, the Hydrogen Council is launching Hydrogen Insights - a subscriptionservice that provides granular insights and data about the hydrogen ecosystem and its development.Deployment and investments: Announced hydrogen investmentshave accelerated rapidly in response to government commitmentsto deep decarbonizationMore than 200 hydrogen projects now exist across the value chain, with 85% of global projectsoriginating in Europe, Asia, and Australia, and activity in the Americas, the Middle East and NorthAfrica accelerating as well.If all projects come to fruition, total investments will exceed USD 300 billion in hydrogen spendingthrough 2030 – the equivalent of 1.4% of global energy funding. However, only USD 80 billion ofthis investment can currently be considered “mature,” meaning that the investment is either in aplanning stage, has passed a final investment decision (FID), or is associated with a project underconstruction, already commissioned or operational.On a company level, members in the Hydrogen Council are planning a sixfold increase in their totalhydrogen investments through 2025 and a 16-fold increase through 2030. They plan to direct most ofthis investment toward capital expenditures (capex), followed by spending on merger and acquisition(M&A) and research and development (R&D) activities.The global shift toward decarbonization backed by government financial support and regulationis supporting this momentum. For instance, 75 countries representing over half the world’s GDPhave net zero carbon ambitions and more than 30 have hydrogen-specific strategies. Governmentshave already pledged more than USD 70 billion and included new capacity targets and sector levelregulation to support these hydrogen initiatives. For example, the EU has announced a 40-gigawatt(GW) electrolyzer capacity target for 2030 (up from less than 0.1 GW today) and more than 20countries have announced sales bans on internal combustion engine (ICE) vehicles before 2035.In the US, where federal emission standards for new vehicles have lagged behind those in the EU,state-level initiatives in California and 15 other states have set ambitious targets to transition notonly passenger cars but also trucks to zero-emission status by 2035. In China, the 2021-24 fuel cellsupport program will see the equivalent of USD 5 billion spent on fuel cell vehicle deployment, with astrong emphasis on the development of local supply chains.ivHydrogen Insights Report 2021Hydrogen Council, McKinsey & Company
Supply: If scaled up with the right regulatory framework, cleanhydrogen costs can fall faster than expectedWith the advent of hydrogen giga-scale projects, hydrogen production costs can continue to fall.For renewable hydrogen, the biggest driver is a quicker decline in renewables costs than previouslyexpected, driven by at-scale deployment and low financing costs. 2030 renewable costs could beas much as 15% lower than estimated just a year ago. The strongest reductions are expected inlocations with optimal resources such as Australia, Chile, North Africa and the Middle East.But lower renewable costs are not enough: for low-cost clean hydrogen production, value chains forelectrolysis and carbon management need to be scaled up. This will not happen on its own: a furtherstep-up of public support is required to bridge the cost gap, develop low-cost renewable capacitiesand scale-up carbon transportation and storage sites. For the cost projections in this report, weassume an ambitious development of the use of hydrogen in line with the Hydrogen Council vision.For electrolysis, for example, we assume 90 GW deployment by 2030.Such a scale-up will lead to a rapid industrialization of the electrolyzer value chain. The industry hasalready announced electrolyzer capacity increases to over approximately 3 GW per year, and will needto scale rapidly beyond that. This scaling can translate into system costs falling faster than previouslyestimated, hitting USD 480-620 per kilowatt (kW) by 2025 and USD 230-380 per KW by 2030. Systemcosts include stack and balance of plant but exclude transportation, installation and assembly, costs ofbuilding and any indirect costs.At-scale deployment of renewable hydrogen will require the development of giga-scale hydrogenproduction projects. Such projects with purpose-built renewables can boost utilization by mergingmultiple renewable sources, such as a combined supply from onshore wind and solar photovoltaics(PV), and by overbuilding renewables supply versus electrolyzer capacity.In combination, projections show that renewable hydrogen production costs could decline to USD1.4 to 2.3 per kilogram (kg) by 2030 (the range results from differences between optimal and averageregions).1 This means new renewable and gray hydrogen supply could hit cost parity in the bestregions by 2028, and between 2032 and 2034 in average regions.In parallel to renewable hydrogen production, low-carbon hydrogen production from natural gas hascontinued to evolve technologically. With higher CO2 capture rates and lower capex requirements,low-carbon hydrogen production is a strong complementary production pathway. If carbon transportationand storage sites are developed at scale, low-carbon hydrogen could break even with gray hydrogenby the end of the decade at a cost of about USD 35-50 per ton (t) of carbon dioxide equivalent (CO2e)1.Distribution: Cost-efficient transmission and distribution required tounlock hydrogen applicationsWith hydrogen production costs falling, transmission and distribution costs are the next frontier whenit comes to reducing delivered hydrogen costs. Longer-term, a hydrogen pipeline network offers themost cost-efficient means of distribution. For example, pipelines can transmit 10 times the energyat one-eighth the costs associated with electricity transmission lines and have capex costs similarto those for natural gas. The industry can partially reuse existing gas infrastructure, but even newlyconstructed pipelines would not be cost prohibitive (assuming leakage and other safety risks areproperly addressed). For example, we estimate the cost to transport hydrogen from North Africa1These costs reflect pure production costs and assume a dedicated renewable and electrolysis system for renewable hydrogen.They do not include costs required for baseload supply of hydrogen (e.g., storage and buffers), costs for redundancies, servicesand margins; they also do not include any cost for hydrogen transportation and distribution.Hydrogen Insights Report 2021Hydrogen Council, McKinsey & Companyv
to central Germany via pipeline could amount to about USD 0.5 per kg of H2 – less than the costdifference of domestic renewable hydrogen production in these two regions.In the short- to medium-term, the most competitive setup for large-scale clean hydrogen applicationsinvolves co-locating hydrogen production on- or near-site. The industry can then use this scaledproduction to supply the fuel to other hydrogen users in the vicinity, such as refueling stations fortrucks and trains, and smaller industrial users. Trucking the fuel to such users typically offers themost competitive form of distribution, with costs below USD 1 per kg of H2.For longer-distance transport by ship, hydrogen needs to be converted to increase its energy density.While several potential hydrogen carrier approaches exist, three carbon-neutral carriers – liquidhydrogen (LH2), liquid organic hydrogen carriers (LOHC) and ammonia (NH3) – are gaining mosttraction.2 The cost-optimal solution depends on the targeted end-use, with deciding factors includingcentral versus distributed fueling, the need for reconversion, and purity requirements.At-scale, international distribution could arrive by 2030 at total costs of USD 2-3/kg (excluding costof production), with the lion s share of costs needed for conversion and reconversion. For example, ifthe targeted end application is ammonia, shipping costs add only USD 0.3-0.5/kg to the total cost. Ifthe targeted end application is for liquid hydrogen or hydrogen with a high purity requirement, shippingas liquid hydrogen might add only USD 1.0-1.2/kg, with additional benefits for further distribution fromport. These cost levels would enable global trade in hydrogen, connecting future major demand centerssuch as Japan, South Korea, and the EU to regions of abundant low-cost hydrogen production meanslike the Middle East and North Africa (MENA), South America or Australia. Like hydrogen production,carriers need substantial initial investments, and the right regulatory framework to bridge the cost deltain the first decade.End applications: Falling clean hydrogen costs and applicationspecific cost drivers improve the cost competitiveness of hydrogenapplicationsFrom a total cost of ownership (TCO) perspective (including hydrogen production, distribution andretail costs) hydrogen can be the most competitive low-carbon solution for 22 end applications,including long haul trucking, shipping and steel. However, pure TCO is not the only driver ofapplication adoption: future expectations on environmental regulations, demands from customersand associated “green premiums,” as well as the lower cost of capital for ESG-compliant investmentswill all influence investment and purchase decisions.In industry, lower hydrogen production and distribution costs are particularly important for costcompetitiveness as they represent a large share of total costs. Refining is expected to switch tolow-carbon hydrogen over the next decade. For fertilizer production, green ammonia producedwith optimized renewables should be cost competitive by 2030 against gray ammonia producedin Europe at a cost of less than USD 50 per ton of CO2e. Steel, one of the largest industrial CO2emitters, could become one of the least-cost decarbonization applications. With an optimized setupusing scrap and hydrogen-based direct reduced iron (DRI), green steel could cost as little as USD515 ton of crude steel, or a premium of USD 45 per ton of CO2e by 2030.In transport, lower hydrogen supply costs will make most road transportation segments competitivewith conventional options by 2030 without a carbon cost. While battery technology has advancedrapidly, fuel cell electric vehicles (FCEVs) are emerging as a complementary solution, in particular forheavy-duty trucks and long-range segments. In heavy-duty long-haul transport, the FCEV option canachieve breakeven with diesel in 2028 if hydrogen can be made available for USD 4.5 per kg at the2viSynthetic methane produced from biogenic or air-captured CO2 represents a potential fourth candidate to be studied further.Hydrogen Insights Report 2021Hydrogen Council, McKinsey & Company
pump (including hydrogen production, distribution and refueling station costs). Furthermore, hydrogencombustion (H2 ICE) offers a viable alternative in segments with very high power and uptimerequirements, including heavy mining trucks.Hydrogen is likewise advancing in trains, shipping, and aviation. Clean ammonia as a shipping fuelwill be the most cost-efficient way to decarbonize container shipping by 2030, breaking even withheavy fuel oil (HFO) at a cost of about USD 85 per ton of CO2e.3 Aviation can achieve competitivedecarbonization via hydrogen and hydrogen-based fuels. The aviation industry can decarbonizeshort- to medium-range aircrafts most competitively through LH2 directly, at a cost of USD 90-150per ton of CO2e. Long-range aircrafts can be decarbonized most competitively using synfuels, at acost of about USD 200-250 per ton of CO2e, depending on the CO2 feedstock chosen.Other end-applications such as buildings and power will require a higher carbon cost to becomecost competitive. However, as large-scale and long-term solutions to decarbonize the gas grid, theywill still see strong momentum. In the United Kingdom, for example, multiple landmark projects arepiloting the blending of hydrogen into natural gas grids for residential heating. Hydrogen as a backuppower solution, especially for high power applications like data centers, is also gaining traction.Implementation: Capturing the promise of hydrogenStrong government commitment to deep decarbonization, backed by financial support, regulationand clear hydrogen strategies and targets, has triggered unprecedented momentum in the hydrogenindustry. This momentum now needs to be sustained and the long-term regulatory framework set.These ambitious strategies must now be translated into concrete measures. Governments, withinput from businesses and investors, should set sector-level strategies (e.g., for the decarbonizationof steel) with long-term targets, short-term milestones, and the necessary regulatory framework toenable the transition. The industry must set up value chains for equipment, scale up manufacturing,attract talent, build capabilities, and accelerate product and solution development. This scale up willrequire capital, and investors will play an outsized role in developing and pushing at-scale operations.All this will require new partnerships and ecosystem building, with both businesses and governmentsplaying important roles.To get things started, strategies should aim at the critical “unlocks,” like reducing the cost ofhydrogen production and distribution. We estimate roughly 65 GW of electrolysis are required to bringcosts down to a break-even with gray hydrogen under ideal conditions, which implies a funding gapof about USD 50 billion for these assets. Support is also required to scale up carbon transport andstorage; hydrogen shipping, distribution and retail infrastructure; and the take up of end applications.One place to support deployment is the development of clusters with large-scale hydrogen offtakersat their core. These will drive scale through the equipment value chain and reduce the cost of hydrogenproduction. By combining multiple offtakers, suppliers can share both investments and risks whileestablishing positive reinforcing loops. Other smaller hydrogen offtakers in the vicinity of such clusterscan then piggy-back on the lower-cost hydrogen supply, making their operations breakeven faster.We see several cluster types gaining traction, including:— Port areas for fuel bunkering, port logistics, and transportation— Industrial centers that support refining, power generation, and fertilizer and steel production— Export hubs in resource-rich countries3Alternatives such as synthetic methane from biogenic or air-captured CO2 in current liquefied natural gas (LNG) vessels were notin the scope of this report and require further study.Hydrogen Insights Report 2021Hydrogen Council, McKinsey & Companyvii
Successful clusters will likely involve players along the entire value chain to optimize costs, tap intomultiple revenue streams and maximize the utilization of shared assets. They should be open toadditional players and infrastructure should allow for ready access where possible.The next few years will be decisive for the development of the hydrogen ecosystem, for achievingthe energy transition and for attaining the decarbonization objective. As this report shows, progressover the past year has been impressive, with unprecedented momentum. But much lies ahead. Thecompanies in the Hydrogen Council are committed to deploying hydrogen as a critical part of thesolution to the climate challenge and Hydrogen Insights will provide a regularly updated, objectiveand global perspective on the progress achieved and the challenges ahead.viiiHydrogen Insights Report 2021Hydrogen Council, McKinsey & Company
Hydrogen Insights Report 2021Hydrogen Council, McKinsey & Companyix
Hydrogen Insightsdraws upon thecollective knowledgeof Hydrogen Councilmembers109companies 6.8 6.5tm market cap1Hydrogen Insights Report 2021Hydrogen Council, McKinsey & Companymn employees
I Introduction and methodologyHydrogen Insights is a leading global perspective on hydrogenThe 109 members of the Hydrogen Council represent over USD 6.8 trillion in market capitalizationand more than 6.5 million employees. Hydrogen Insights represents a collaborative effort betweenHydrogen Council members and McKinsey & Company to bring forth an objective, holistic andquantitative perspective on the use of hydrogen as a decarbonization option based on real industrydata.As such, Hydrogen Insights aspires to offer the pre-eminent industry perspective on marketdeployment, investment momentum and cost competitiveness within the hydrogen industry. Alongwith the report, the Hydrogen Council is launching Hydrogen Insights as a subscription service,providing granular insights and data about the hydrogen ecosystem and its development.Exhibit 1: Hydrogen Council MembersHydrogen Insights Report 2021Hydrogen Council, McKinsey & Company2
The Hydrogen Insights report methodologyBefore explaining the results, the following provides a description of the methodological approachused in this analysis.Evaluating hydrogen investment, deployment, and market momentumThe report team estimated the total hydrogen investment through 2030 based on an analysis ofthree main investment funding categories: direct investment into private sector projects, governmentproduction targets and public funding, and upstream/indirect investment required to supportannounced project investments.Direct private sector investment. The report team’s estimates of company investments inhydrogen projects came from a database of publicly announced projects across the globe, validatedby the members of the Hydrogen Council. Using public deployment information and internalprojections, the team estimated required funding for these projects. It also classified projects bymaturity level, depending on whether they were at an early stage, in the planning phase, or alreadyhad committed funding. By combining these insights with investment data from Hydrogen Councilmembers that an independent third-party clean team collected, processed, and aggregated, thereport team gained insights into the relevant investment trends in the market.Government production targets and public funding. The report team reviewed announcedgovernment targets and compared them with the project pipeline to quantify the additionalcapacity required to reach the targets. This additional capacity was then costed and included in theinvestment total as announced investment. Countries such as China, Japan and Korea, which relymore heavily on announced public funding targets instead of capacity targets, were considered asa special case. In these countries, the report team reviewed announced government funding andcompared it with announced private investment from the project pipeline. By assuming that theexisting private projects received on average one-third of their total investment from the government(in most cases this information is not made public), the team could quantify the additional investmentexpected from these governments and include it in the announced investment category.Upstream investment. Lastly, the team estimated the upstream investment required to realizedirect private sector investments using industry revenue multipliers. It treated fuel cell and on-roadvehicle platforms separately, with a bottom-up estimation of R&D and manufacturing costs.Evaluating hydrogen cost-competitiveness: production, distribution and applicationThe cost competitiveness analysis in the report built on the Hydrogen Council Study 2020 report,“Path to hydrogen competitiveness: a cost perspective”. This year s report focused on adding newtechnologies and applications (such as shipping and aviation) and revisited areas where technology,costs and underlying assumptions have changed.Data for both perspectives were provided by Hydrogen Council members through an independentthird party “clean team” who collected, aggregated and processed the data to preserve anonymity.In addition to these data, the report builds upon McKinsey Energy Insights modelling of renewablescosts and capacity factors, McKinsey Hydrogen Supply modelling, other proprietary assets, andnumerous benchmarks from external data providers and databases. The report team also tested andvalidated the findings from these analyses via over 25 expert interviews before the results and keyfindings were presented to the Hydrogen Council study group. The study group, which consisted of20 members of the Hydrogen Council, then validated, co-developed and tested these findings. Thefull steering group of the Hydrogen Council subsequently reviewed and approved the report.Volume ramp ups. The study assumed several deployment scenarios for hydrogen technology.While not forecasts, these scenarios provided a way to analyze the effect of scale on cost3Hydrogen Insights Report 2021Hydrogen Council, McKinsey & Company
competitiveness. Volume ramp up assumptions reflected the required low-carbon and renewablehydrogen production volume scales needed to meet 18% of global final energy demand by 2050 (inline with the 2 C goal).Hydrogen production costs. Throughout this report, “low-carbon” and “renewable” hydrogenare used as shorthand to describe the production of hydrogen from natural gas through a reformingprocess with carbon capture (low-carbon hydrogen) and/or the production of hydrogen via waterelectrolysis from renewable electricity (renewable hydrogen). The focus on these two main pathwaysdoes not exclude other production pathways that can form part of a hydrogen economy, such asthe reforming of biogas, pyrolysis, coal gasification, and others. Where the report mentions thesealternative pathways, it describes them as such.The report team analyzed hydrogen production costs using a specific production configuration thatreflected the “base costs” of clean hydrogen production. This production configuration includesa dedicated renewable energy and electrolysis system (excluding grid connection fees or addedtransmission line infrastructure), and fully flexible production (zero minimum load requirements thatrequire storage and oversizing of the generation capacity). Furthermore, it considered only rawproduction costs (distinct from supply prices that include services, redundancies and margins) for ascaled industry to support the cost-down (90 GW installed by 2030).Carriers and application analysis. Carriers and applications with specific low-carbon andconventional alternatives underwent total cost of ownership (TCO) comparisons. For example, oneanalysis compared fuel-cell electric vehicles with battery electric vehicles (BEVs) with diesel vehicles.Likewise, fuels for aviation compared hydrogen versus synfuels versus kerosene (jet fuel).The report team developed TCO trajectories for each hydrogen application and technology and itscompeting low carbon and conventional alternatives to identify relevant cost components. Moreover,the team pinpointed factors driving cost reductions and break-even points among competingsolutions. Generally, it based hydrogen cost estimations on the average of low-carbon hydrogen(produced from natural gas reforming with carbon capture and storage) and renewable hydrogen(produced via renewable power and electrolysis).Nevertheless, for some specific applications, a particular production method was assumed to reflectvariations across regions and their respective settings.CO2 analysis. Throughout the report, CO2 played two different roles. On one hand, it could functionas feedstock for applications such as methanol (MeOH) shipping fuel. On the other, it representedgreenhouse gas emissions that harm the environment. Although various ways exist to capture orobtain CO2 feedstock (e.g., industrial capture or biogenic CO2), this report assumed it was extractedfrom the atmosphere using direct air capture (DAC) technology. Hence, the report assumed theresulting product was produced in a carbon-neutral way.The team conducted all analyses without assuming that implicit CO2 emission costs penalizedapplications and technologies that emit CO2. However, for some specific cases it did apply CO2costs. In those cases, the analysis clearly describes the implicit CO2 emission costs.Currency. All financial figures are in US dollars (USD) and refer to global averages unless otherwiseindicated.Hydrogen Insights Report 2021Hydrogen Council, McKinsey & Company4
InvestmentsHydrogenInsightsintohydrogendraws uponarethegatheringmomentumcollective knowledgeof Hydrogen Councilmembers 200109projects have been announced globally withcompanies 6.8 6.5 80bntm marketin capmn employeesmature hydrogen investment5Hydrogen Insights Report 2021Hydrogen Council, McKinsey & Company
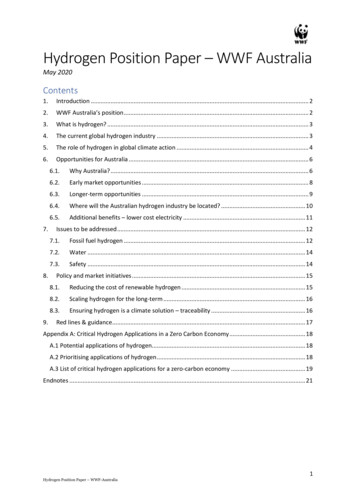
II Deployment and investmentTremendous momentum exists, with over 200 H2 projects announced worldwideGlobally, there are 228 hydrogen projects across the value chain (see Exhibit 2). Of these, 17 arealready-announced giga-scale production projects (i.e. more than 1 GW4 for renewable and over 200thousand tons a year for low-carbon hydrogen), with the biggest in Europe, Australia, the Middle Eastand Chile.Exhibit 2: Global hydrogen projects across the value chainProjects per region:126Europe46Asia24Oceania19North America8Middle East and Africa5Latin America17Giga-scale production:renewable H2 projects 1GW and low-carbon H2projects 200 kt p.a.22890Large-scale industrialusage: refinery, ammonia,power, methanol, steel,and industry feedstockannounced projects5345Transport: trains, ships,trucks, cars and otherhydrogen mobilityapplicationsIntegrated H2 economy:cross-industry, andprojects with differenttypes of end-uses23Infrastructure projects:H2 distribution,transportation,conversion, and storageEurope leads globally in the number of announced hydrogen projects, with Australia, Japan, Korea,China and the USA following as additional hubs. Of all announced projects, 55% are located inEurope. While Europe is home to 105 production projects, the announced projects cover the entirehydrogen value chain including midstream and downstream.In expected major demand centers like Korea, Japan and Europe, the focus is on industrial usage
Contents Executive summary iii I. Introduction and methodology 2 — Hydrogen Insights is a leading global perspective on hydrogen 2 — The Hydrogen Insights report methodology 3 II. Deployment and investment 6 — Tremendous momentum exists, with over 200 H