Transcription
Combining Raman Spectroscopy withGravimetric Vapour Sorption Analysis forPharmaceutical MaterialsDVSApplicationNote 46Dan Burnett, Duncan Pearse and Nishil Malde, Surface Measurement Systems Ltd.Raman spectroscopy is a widely used physical characterization technique used in the pharmaceutical industry. Thecombination of Raman spectroscopy and Dynamic Vapour Sorption (DVS) allows for a more complete understandingof vapour-solid interactions for pharmaceutical materials as it relates to structural properties. This paper overviewsthe DVS-Raman capabilities and gives several examplesIntroductionTheoryThe interactions of water vapour with solidmaterials have impact over a wide range ofindustries and materials. In particular, in thepharmaceutical industry the physical andchemical performance (i.e. flow, compaction,dissolution, stability, storage, and formulation) ofdrugs, excipients, and packaging materials aredependent on the presence and interaction of/withwater [1]. Dynamic gravimetric vapour sorptioninstruments have now become the standardmethod for investigating the vapour sorptionproperties for pharmaceutical materials. Thecombination of additional techniques with DVScan further enhance the understanding of howvapour interacts with solid materials. Forinstance, in-situ optical microscopy can confirmstructural changes indicated by the gravimetricdata [2,3]. Additionally, vibrational spectroscopictechniques, such as Near-IR [4,5] and Ramanspectroscopy [6] have also been combined withgravimetric sorption methods. This paperdescribes the first ‘turn-key’ solution for thecombination of Raman spectroscopy withgravimetric vapour sorption analysis.Raman spectroscopy is a technique used to studyvibrational, rotational, and other low-frequencymodes in a system [7]. Monochromatic radiationcan interact with a material by reflecting,absorbing, or scattering the light. Ramanspectroscopy is the measurement and detectionof the wavelength and intensity of inelasticallyscattered light from molecules, i.e. the Ramaneffect. When electromagnetic radiation passesthrough matter, most of the radiation continues inits original direction but a small fraction isscattered in other directions, such as: Rayleighscattering (light that is scattered at the samewavelength as the incoming light) or Ramanscattering (light that is scattered at a differentwavelength due to vibrations in molecules oroptical phonons in solids). Raman spectroscopycan be used to study the crystal lattice andintermolecular vibrations and has proved to be auseful tool to investigate structural properties.Raman spectroscopy is ideal for use in the DVSfor several reasons. First, sampling techniquesare relatively straightforward since the onlyrequirement is that the laser irridates the materialand the scattered radiation can be focused on adetector [8]. Also, sample prep is minimal andRaman spectroscopy requires small samplesP-SCI-265 v1.0 12MAR2012
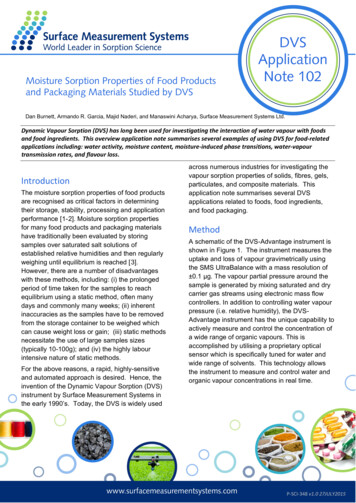
(typically a few milligrams). Glass and stainlesssteel are common holders for Raman samples,making DVS pans ideal for Raman spectroscopy.In particular, glass is a very weak Ramanscatterer. In particular to DVS experiments,Raman is an ideal spectroscopic choice oftechnique due to the low Raman activity of watervibrations [9].MethodA picture of the DVS-Advantage system withintegrated Raman probe is shown in Figure 1a.The close up picture in Figure 1b illustrates howthe Raman probe interfaces with the DVSchamber. The laser used has a wavelength of785nm. The details of the Raman system(detector and spectrometer) are listed in Table 1.The temperature range of the simultaneous DVSRaman system is 5 C to 50 C. The Ramanprobe is 130mm in length. The abovespecifications are for the DVS-Ramanmeasurements done in this study. However, it ispossible to interface virtually any Raman system,provided the Raman probe is of compatible sizewith the DVS-Advantage system.Figure 1(a.)Figure 1(b.)Figure 1. DVS-Advantage system with Ramanprobe (a.) and close-up view of Raman probe port(b.).
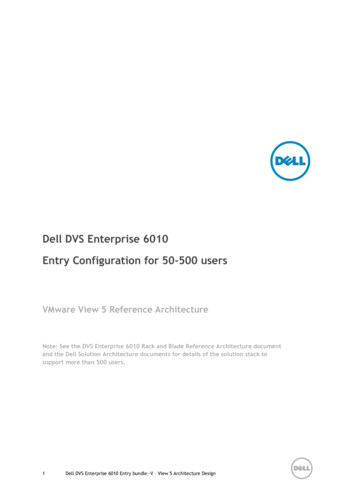
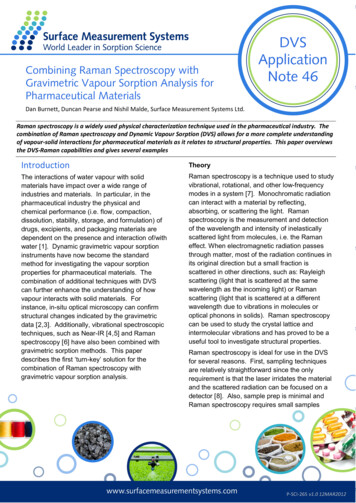
Table 1. Raman detector and ationTypeHamamatsu S7031-1003Range200-1100 nmPixels1024 x 58 (1044 x 64total pixels)Pixel size24.576 µm square sizePixel welldepth3000,000electrons/well; 1.5millionelectrons/column22 electrons/count forall wavelengths; 250nm: 26 photons/count90% peak; 65% at rtyWavelength tionDarknoiseDynamicRangeIntegration timeStray nt 0.14-7.7 nmFWHM1000:1 (at fullsignal)16 bit3 RMS counts7.5x109 (system);25000:1 for asingle acquisition8 ms to 15minutes 0.08% at 600nm; 0.4% at 435nm 99.8%ResultsPolymorphic Formsspecies as the humidity was increased from 60%RH to 75% RH (at 25 C) [6]. Differences inRaman spectra between hydrate and anhydrateforms has even been detectible in the presence ofexcipients [13].Figure 2 displays the DVS moisturesorption/desorption isotherms for anhydroustheophylline (Figure 2a) and correspondingRaman spectra (Figure 2b) taken at the end ofeach humidity step. Theophylline remainsanhydrous until the 70% RH sorption step. Thesharp mass increase is indicative of hydrateformation [14]. On the desorption side, thesample remains hydrated until the humiditydecreases below 30% RH. As Figure 2bindicates, the spectra for the anhydrous material(0% RH adsorption, 50% RH adsorption, and 0%RH desorption steps) are clearly different than thespectra for the hydrated species (90% RHadsorption and 80% desorption steps). Similardifferences in Raman spectra were observedpreviously for anhyhdrous and hydrated materials[6,12].Raman spectroscopy can probe the latticevibrations that are associated with the solid,crystalline state. The lattice vibrations fordifferent polymorphs will result in unique,characteristic spectra for each polymorph [8,10].Therefore, Raman spectroscopy has long beenused in the pharmaceutical industry to identifydifferent polymorphic forms. In addition, Ramanspectroscopy has been used to quantitativelydetermine different polymorphic mixtures ofcortisone acetate [11].HydratesRaman spectroscopy can be especially sensitiveto spectra shifts due to changes in hydrogenbonding. Therefore, Raman spectroscopy is anideal complement with DVS data to confirmhydration/dehydration phenomena. To illustrate,the Raman results for anhydrate andmonohydrate forms of baclofen produced uniquespectra for each species [12]. Additionally,Raman spectra confirmed the transformation ofsulfaguanidine anhydrate to the monohydrateFigure 2(a.)
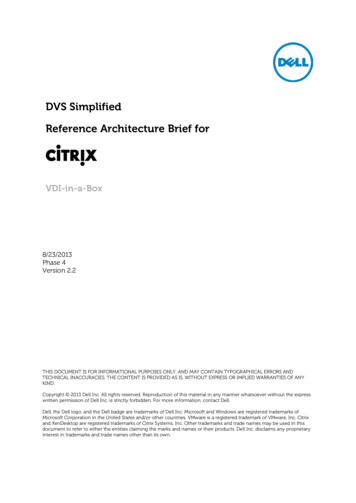
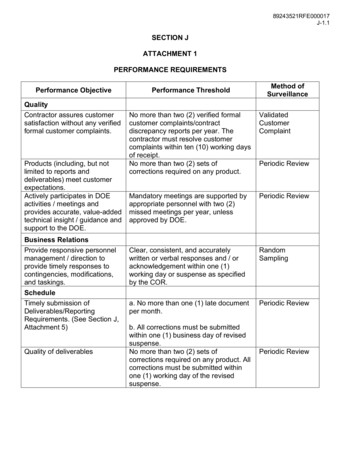
clearly defined than the amorphous spectra. Thisis typical for Raman spectra on the amorphousphase.Raman scan - ty (counts)5000AnhydrousTheophylline40000%RH ads50%RH ads90%RH ads80%RH des0%RH 00Wavelength (nm)Figure 2(b.)Figure 2. DVS water sorption/desorption isotherm(a.) and in-situ Raman spectra (b.) fortheophylline at 25 C.Amorphous MaterialsRaman spectroscopy has also been used todifferentiate between the amorphous andcrystalline phases of the same material. Thisusually manifests in a broadening of the spectraby the amorphous material compared to thecrystalline phase [10]. In fact, Ramanspectroscopy has been used to quantify varyingamorphous contents [15]. However, carefulconsideration must be used towards obtainingrepresentative Raman spectra for mixtures.Figure 3 shows the water sorption/desorptionprofile (a,) and corresponding Raman spectra (b.)for amorphous lactose at 25 C. The DVSsorption profile clearly shows the humidityinduced crystallization for amorphous lactose atthe 60% RH step. This is a well-known and wellcharacterized phenomenon for amorphouslactose [16]. In essence, the amorphous materialhas a greater water vapor sorption capacity thanthe crystalline material, due to increased voidspace, free energy, and/or surface area. Whenthe material undergoes an amorphous tocrystalline transition, the water sorption capacitydecreases drastically, resulting in a net mass lossas excess water is desorbed duringcrystallization. The corresponding Raman resultsin Figure 3b, shows a dramatic change in thespectra before crystallization versus aftercrystallization. The crystalline spectra are muchlower in intensity and the features are moreFigure 3(a.)Figure 3(b.)Figure 3. DVS water sorption/desorption results(a.) and in-situ Raman spectra (b.) for amorphouslactose at 25 C.OtherRaman spectroscopy can also be sensitive tochanges in hydrogen bonding and other subtlereorientation of the solid material. For instance,Raman spectroscopy has been previously used todetermine the changes in strength of hydrogen
bonding between water and differentpharmaceutical polymers [17]. In the same study,changes in Raman spectra due to waterplasticizing the polymers have been observed.Figure 4 displays the water sorption/desorption(a.) and Raman spectra (b.) for microcrystallinecellulose (MCC) at 25 C. MCC is not expectedto form a hydrated species or undergo andpolymorphic transformation when exposed toincreasing humidity. However, there are cleardifferences in the Raman spectra as the humidityis increased. MCC does experience a significantamount of bulk water absorption as humidity isincreased. Therefore, the changes observed inFigure 4b could be due to increased hydrogenbonding, decrease in void spaces, or otherstructural rearrangements. Raman spectroscopyhas also been previously used to identify sampledeliquescence as a sample of ranitidine HCl isexposed to a relative humidity above the criticaldeliquescence point [6].The combination of Raman spectroscopy andgravimetric vapor sorption analysis hasapplications ranging beyond the pharmaceuticalindustry. For instance, water sorption and Ramanstudies have been performed on different protonconducting membranes for fuel cell applications[18,19]. Combined water sorption and Ramanstudies on the hydration of Nafion membranesconfirm that the polymers retain the helical zigzagconformation of the polytetrafluoroethylene [18].Additionally, Raman spectra were able todifferentiate water sorption properties betweenporous and non-porous proton conductingpolymers [19]. Water sorption and Ramanspectroscopy studies have also been performedon different polymers, including Nylon 6 [20],Kevlar-49 [21], and poly(vinyl alcohol) [22].Further, the mechanisms of moisture sorption ondifferent barrier polymers for food packagingapplications has been previously investigated[23]. Researchers found that water associateswith the packaging materials greatly affects theoxygen barrier properties of the differentpolymers. Other materials for which Ramanspectroscopy has been used to study vaporsorption include silica gels [24], silver [25], carbonnanotubes [26], and starch [6]. In all, thecombination of Raman spectroscopy withgravimetric vapor sorption instrumentation has farreaching applications over a range of industries.Figure 4(a.)Figure 4(b.)Figure 4. DVS water sorption/desorption results(a.) and in-situ Raman spectra (b.) for MCC at 25 C.
ConclusionThe combination of gravimetric vapour sorptionand in-situ Raman spectroscopy can be apowerful tool in determining how water interactswith various materials. Raman spectroscopy isan ideal complementary technique to DVS due toits relatively low sample preparation and smallsample size requirements and weak interactionswith water molecules. These combinedtechniques can investigate a range ofpharmaceutical applications:hydration/dehydration, polymorphidentification/transformation, amorphous tocrystalline transformation, hydrogen-bonding, anddeliquescence. In addition, when used in tandem,these techniques have various applications fordifferent materials and industries.References1 Khankari, R.K. and Zografi, G., Sorption of water by solids. In: BrittainH.G., editor. Physical Characterization of Pharmaceutical Solids. New York:Marcel Dekker, Inc., pp 387-418.2 SMS Application Note 103 D.J. Burnett, N. Malde, and D. Williams, Pharm. Technology Asia Pacific,December (2008) 19-22.4 R.A. Lane and G. Buckton, Int. J. Pharm., 207 (2000) 49-56.5 K.L. Vora, G. Buckton, and D. Clapham, Eur. J. Pharm. Sci., 22 (2004) 97105.6 A.D. Gift and L.S. Taylor, J. Pharm. And Biomedical Analysis, 43 (2007) 1423.7 D.J. Gardiner, Practical Raman Spectroscopy, Springer-Verlag, New York1989.8 D.E. Bugay, Advanced Drug Delivery Reviews, 48 (2001) 43-65.9 A.M. Amado, M.M. Nolasco, and P. J.A. Ribeiro-Claro, J. Pharm. Sci., 96(2007) 1366-1379.10 L. Yu, S.M. Reutzel, and G.A. Stephenson, PSTT, 1 (1998) 118-127.11 C.M. Deeley, R.A. Spragg, and T.L. Threlfall, Spectromchim. Acta, 47A(1991) 1217-1223.12 S. Mirza, I. Miroshnyk, J. Rantanen, J. Aaltonen, P. Harjula, E. Kiljunen, J.Heinamaki, and J. Yliruusi, J. Pharm. Sci., 96 (2007) 2399-2408.13 S. Airaksinen, P. Luukkonen, A. Jørgensen, M. Karjalainen, J. Rantanen,and J. Yliruusi, J. Pharm. Sci., 92 (2003) 516-528.14 SMS Application Note 36.15 L.S. Taylor and G. Zografi, Pharm. Res., 15 (1998) 755-761.16 D.J. Burnett, F. Thielmann, and J. Booth, Int. J. Pharm., 287 (2004) 123133.17 L.S. Taylor, F.W. Langkilde and G. Zografi, J. Pharm. Sci., 90 (2001) 888901.18 A. Gruger, A. Regis, T. Schmatko, and P. Colomban, VibrationalSpectroscopy, 26 (2001) 215-225.19 D.I. Ostrovskii, L.M. Torell, M. Paronen, S. Hietala, and F. Sundholm,Solid State Ionics, 97 (1997) 315-321.20 B.H. Stuart, Polymer Bulletin, 33 (1994) 681-686.21 B.H. Stuart, Polymer Bulletin, 35 (1995) 727-733.22 P.S. Thomas and B.H. Stuart, Spectrochimica Acta Part A, 53 (1997)2275-2278.23 J.M. Lagaron, E. Gimenez, R. Catala, and R. Gavara, MacromolecularChemistry and Physics, 204 (2003) 704-713.24 D. Krol, Journal of Non-Crystalline Solids, 68 (1984) 163-166.25 I. Pockrand, Surface Science, 122 (1982) L569-L573.26 S.C. Sharma, D. Singh, and Y. Li, Journal of Raman Spectrometry, 36(2005) 755-761.Head Office:United States Office:Surface Measurement Systems, Ltd, NASurface Measurement Systems, Ltd2125 28th Street SW, Suite I5 Wharfside, Rosemont RoadLondonHA0 4PE, UKAllentown PA, 18103, USATel: 1 610 798 8299Tel: 44 (0)20 8795 9400Fax: 1 610 798 0334Fax: 44 (0)20 8795 9401Email: science@surfacemeasurementsystems.com
the Raman probe interfaces with the DVS chamber. The laser used has a wavelength of 785nm. The details of the Raman system (detector and spectrometer) are listed in Table 1. The temperature range of the simultaneous DVS-Raman system is 5 C to 50 C. The Raman probe is 130mm in length. The above specifications are for the DVS -Raman