Transcription
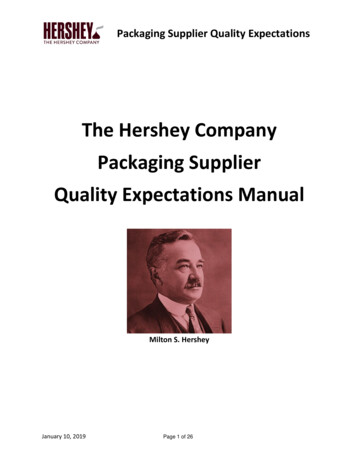
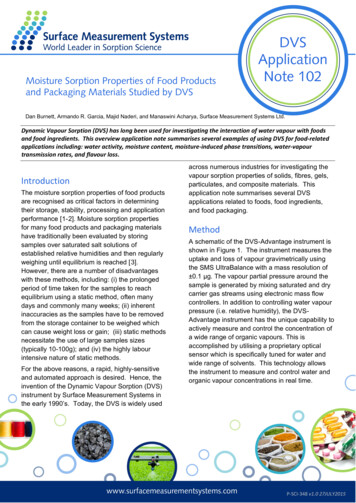
Moisture Sorption Properties of Food Productsand Packaging Materials Studied by DVSDVSApplicationNote 102Dan Burnett, Armando R. Garcia, Majid Naderi, and Manaswini Acharya, Surface Measurement Systems Ltd.Dynamic Vapour Sorption (DVS) has long been used for investigating the interaction of water vapour with foodsand food ingredients. This overview application note summarises several examples of using DVS for food-relatedapplications including: water activity, moisture content, moisture-induced phase transitions, water-vapourtransmission rates, and flavour loss.IntroductionThe moisture sorption properties of food productsare recognised as critical factors in determiningtheir storage, stability, processing and applicationperformance [1-2]. Moisture sorption propertiesfor many food products and packaging materialshave traditionally been evaluated by storingsamples over saturated salt solutions ofestablished relative humidities and then regularlyweighing until equilibrium is reached [3].However, there are a number of disadvantageswith these methods, including: (i) the prolongedperiod of time taken for the samples to reachequilibrium using a static method, often manydays and commonly many weeks; (ii) inherentinaccuracies as the samples have to be removedfrom the storage container to be weighed whichcan cause weight loss or gain; (iii) static methodsnecessitate the use of large samples sizes(typically 10-100g); and (iv) the highly labourintensive nature of static methods.For the above reasons, a rapid, highly-sensitiveand automated approach is desired. Hence, theinvention of the Dynamic Vapour Sorption (DVS)instrument by Surface Measurement Systems inthe early 1990’s. Today, the DVS is widely usedacross numerous industries for investigating thevapour sorption properties of solids, fibres, gels,particulates, and composite materials. Thisapplication note summarises several DVSapplications related to foods, food ingredients,and food packaging.MethodA schematic of the DVS-Advantage instrument isshown in Figure 1. The instrument measures theuptake and loss of vapour gravimetrically usingthe SMS UltraBalance with a mass resolution of 0.1 μg. The vapour partial pressure around thesample is generated by mixing saturated and drycarrier gas streams using electronic mass flowcontrollers. In addition to controlling water vapourpressure (i.e. relative humidity), the DVSAdvantage instrument has the unique capability toactively measure and control the concentration ofa wide range of organic vapours. This isaccomplished by utilising a proprietary opticalsensor which is specifically tuned for water andwide range of solvents. This technology allowsthe instrument to measure and control water andorganic vapour concentrations in real time.P-SCI-348 v1.0 27JULY2015
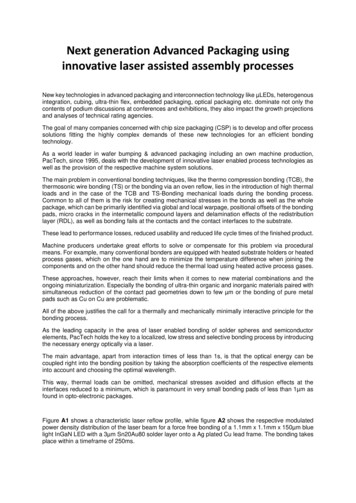
Date: 07 Dec 2001Time: 4:14 pmFile: ricestarch071201 reduced.XLSSample: rice starchTemp: 24.8 CMeth: duncan.saoM(0): 40.5303DVS Isotherm PlotCycle 1 SorpCycle 1 Desorp25Change In Mass (%) - Dry20Desorption1510Point: fromlast 3-5datapoints ofeachhumidity stepSorption5Hysteresis0010DVS - The Sorption Solution20304050Target RH (%)60708090100 Surface Measurement Systems Ltd UK 1996-2001Back to 0 reversible(b.)Figure 2. Moisture sorption kinetic (a.) and isotherm(b.) plots for starch at 25 C.Figure 1. Schematic overview of the SMS DVSAdvantage instrument.Moisture Content/Sorption IsothermThe DVS family of instruments has beenroutinely used to determine moisture contentisotherms. This is accomplished by exposing thesample to a certain relative humidity untilequilibrium has been established. Then, this isrepeated at numerous RH steps until a completesorption and/or desorption isotherm has beenestablished. Figure 2 displays typical moisturesorption/desorption kinetics (a.) and isotherms(b.) for a generic starch sample.Second cycleFirst cycleDate: 07 Dec 2001Time: 4:14 pmFile: ricestarch071201 reduced.XLSSample: rice starchTemp: 24.8 CMeth: duncan.saoM(0): 40.5303DVS Change In Mass (dry) Plotdm - dryTarget RH2510090807015605010405302000-52000SorptionDVS - The Sorption rptionTime/minsDrying(a.)Desorption Surface Measurement Systems Ltd UK 1996-2001Target RH (%)Change In Mass (%) - Dry20Unlike the desiccator jar method, the DVS allowscontinuous measurement of the sorption kinetics,which can be used to determine moisturediffusion coefficients. This will be discussed indetail later. Also, the DVS allows thedetermination of sorption and desorptionisotherms on the same sample; thus moisturesorption hysteresis can be measured. Finally,due to the constant flux of (partially) humidifiedcarrier gas, the DVS allows completesorption/desorption isotherms to be determined inhours/days instead of days/weeks/months for thedesiccator jar method.Moisture-Induced Phase ChangesAmorphous solids often absorb relatively largeamounts of water vapour compared to theircorresponding crystalline phases. Sorbed wateroften acts as a plasticising agent, thussignificantly lowering the glass transitiontemperature causing spontaneous phasetransitions and lyophile collapse. In fact, there isoften a critical humidity at which the glasstransition will occur at room temperature. Inaddition, this can lead to increased cohesiveness,powder caking and adhesion to other surfaces. Toillustrate, it was determined that cohesion wasrelated to the combined effects of temperatureand moisture [4]. Only investigating one (i.e.temperature or moisture content alone) is notsufficient to understand the likelihood of a powderto cake. The mechanism for sticking and caking of
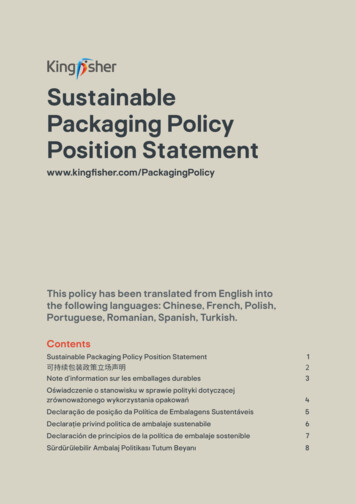
Detailed information and theory aboutmoisture-induced glass transitions can be foundin SMS Application Note 32 and in Reference[5]. In short, a linear RH ramping experiment isperformed, whereas several moisture-inducedphase transitions can be identified by the nonlinear moisture sorption response by the sample.This phenomenon is illustrated in Figure 3 for aspray-dried lactose sample.Temp: 25.0 CAmorphous Lactose% Change in MassRecrystallization141009012Bulk Absorption andSurface Adsorption10807060850Glass Transition640Surface AdsorptionSample RH (%)Net Change In Mass (%)Sample RH304202100-1000100DVS - The Sorption Solution300500700Time/mins900110013001500 Surface Measurement Systems Ltd UK 1996-2Figure 3. Relative humidity ramping experiment (6.0%RH/hour) for an amorphous lactose sample at 25.0 C.Similar experiments can be performed over arange of temperatures to establish a 2dimensional phase diagram (Figure 4). This canbe used to determine the ideal storage andprocessing conditions to limit any moistureinduced phase transformations and subsequentpowder caking.Humidity Induced Transitions for Spray-Dried LactoseHumidity at Glass Transition (%)Humidity at Crystallization (%)6560Crystalline Region55Relative Humidity (%)amorphous sugars is through the phase changeof the amorphous sugar from a glass to a rubberat conditions above the glass transition point [4].Therefore, determining the necessary thresholdtemperature and humidity conditions to prevent aglass transition is critical for storage andprocessing of amorphous food ingredients.5045Unstable Amorphous Region40353025Stable Amorphous Region2015152025303540455055Temperature ( C)Figure 4. Humidity-induced phase transitions for spraydried lactose measure via DVS.Moisture-Induced Flavour ReleaseThere are two main factors that trigger flavourrelease from encapsulated matrices: (1) physicochemical properties of the matrix and (2) volatilecompounds’ thermodyanamic and kineticproperties [6]. Regarding the encapsulatedmatrix, important properties include physicalstate, surface area, moisture content, wateractivity and glass transition temperature. Theprevious section describes how water vapour canaffect the glass transition and physical state (i.e.amorphous to crystalline transformation). Inaddition, the DVS instrument can directlymeasure moisture content and water activitydetermination will be discussed later. Therefore,the DVS instruments can add valuableinformation for the formulation and stability ofencapsulated flavours.Previous researchers have investigatedmoisture-induced flavour release using a varietyof matrices [7,8,9]. In one study, researchersfound a clear transition point around 60% RH forlimonene flavour loss in a yeast matrix. Theattributed mechanism was dependent on how theyeast cell wall structure/properties are related towater sorption/desorption. The flavour on/offrelease mechanism was strongly dependent onmoisture content [9]. In another study,benzaldehyde release from an amorphous glasswas studied as a function of relative humidity.The researchers found that benzaldehyde release
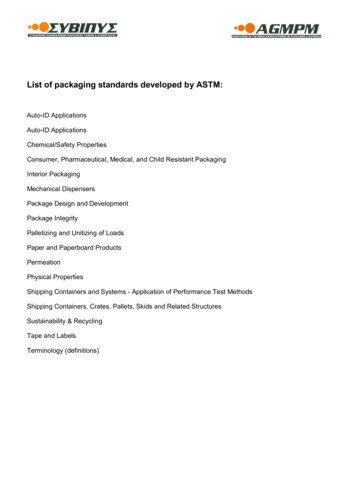
was significantly higher above 60% RH. This wasdue to water plasticizing the matrix and loweringthe Tg down to room temperature [7].Powder Caking and Amorphous ContentThe caking behaviour of powders can depend onthe amount of material present in the amorphousstate [10]. In addition, powders with greateramounts of amorphous lactose are more sensitiveto absorbing moisture, thus increasing thetendency to lumping and caking problems [11].There are several methods in the literature usinggravimetric vapour sorption techniques toquantify amorphous contents [12,13,14,15,16].Most of these methods are based on theamorphous phase sorbing more vapour than thecrystalline phase. Amorphous materials typicallyhave a higher surface area and vapour affinitythan their crystalline counterparts. For vapoursorption methods a calibration of knownamorphous contents is typically necessary. Then,the equilibrium vapour uptake at a particularvapour concentration is plotted versus the knownamorphous content. The result is a calibrationcurve to which unknown amorphous contents canbe compared. Due to the above mentionedchanges in crystalline state induced by water(solvation, polymorph conversion, etc.), use of anon-polar organic vapour is recommended forhydrophobic materials. To illustrate, Figure 5shows the octane vapour sorption isotherms (a.)and calibration curve (b.) for lactose samples withvarying amorphous contents. The error marginsin Figure 5b were based on the 1st standarddeviation for repeat measurements (n 3).Amorphous standards were created by makingphysical mixtures of 100% amorphous and 100%crystalline lactose. The resulting calibration curveand correlation coefficient (R2 0.9994) suggeststhat amorphous contents below 0.5% wereachievable with an accuracy of 0.3%.(a)(b)Figure 5. Octane vapor sorption isotherms (a.)and resulting calibration curve (b.) for lactosesamples with various amorphous fractions.Video MicroscopyThe physical changes inferred from thegravimetric data can be further supported by insitu microscopic images collected during theexperiment. This is done using the DVS-Videoaccessory. The long-working distance digitalmicroscope allows the automatic collection ofimages during a DVS experiment withmagnification up to 200X.Figure 6 shows 100x images ofamorphous lactose taken at 0% (A), 50% (B),60% (C), and 90% RH (D). This is the samematerial used in Figure 3. By 50% RH the sampleis clearly changed to the rubbery form due to thehumidity-induced glass transition. By 60% RH,the sample begins to crystallize, where at 90%RH crystallization of amorphous lactose is evidentby an increase in the opacity of the image. Whencombined with the change in mass results in
Figure 3, the images shown in Figure 6 clearlyidentify different humidity-induced phasechanges.However, there are clear differences in theRaman spectra as the humidity is increased.MCC does experience a significant amount ofbulk water absorption as humidity is increased.Therefore, the changes observed in Figure 7bcould be due to increased hydrogen bonding,decrease in void spaces, or other structuralrearrangements.Figure 6. In-situ images collected on amorphouslactose at 0% (A), 50% (B), 60% (C), and 90% RH(D).Raman/Near-IRVibrational spectroscopic techniques, such asNear-IR [17,18] and Raman spectroscopy [19]have also been combined with gravimetricsorption methods. As moisture is absorbed by asample, the intermolecular structure and forceswithin it adapt to accommodate water molecules.This leads to changes in the sample's molecularvibrational characteristics, which can bemonitored by changes in the Raman spectrum[20] or Near-IR spectrum [21].To illustrate, Raman spectroscopy can besensitive to changes in hydrogen bonding andother subtle reorientation of the solid material.For instance, Raman spectroscopy has beenpreviously used to determine the changes instrength of hydrogen bonding between water anddifferent pharmaceutical polymers [22]. In thesame study, changes in Raman spectra due towater plasticizing the polymers have beenobserved. Figure 7 displays the watersorption/desorption (a.) and Raman spectra (b.)for microcrystalline cellulose (MCC) at 25 C.MCC is not expected to form a stoichiometrichydrated species or undergo any first-order phasechange when exposed to increasing humidity.(a.)(b.)Figure 7. DVS water sorption/desorption results(a.) and in-situ Raman spectra (b.) for MCC at 25 C.
Diffusion/Flux ExperimentsReal-time mass change data can be collected asfrequently as once every second, which allowsthe determination of diffusion coefficients forvarious geometries. DVS has been successfullyused to measure diffusion coefficients for films,powders, and fibres. Diffusion into films can beparticularly useful for packaging applications.SMS Application Note 16 outlines the theory andmethod for thin film diffusion coefficientdetermination. In short, diffusion constants for thethin films utilises diffusion equations firstemployed by Crank and Park [23]. For a singlestep in humidity, and a thin film of knownthickness, the initial kinetics of sorption into thebulk may be used to determine the diffusioncoefficient. This can be performed over a rangeof temperatures to investigate a range of storageconditions. Figure 8 displays the water diffusioncoefficients into a fluoropolymer-copolymer filmover a range of temperatures.Combined with the diffusion coefficientsmentioned previously, WVTR determination canbe used for packaging/barrier applications.Cell openingUpper O’ringTest SpecimenCell LidLower O’ringDrying Agenti.e. Zeolite,Silica GelCell CupFigure 9. Experimental set-up for moisture vapourtransmission rate measurement.To illustrate the utility of this Payne cell, Table 1displays the steady-state water vapour flux valueson an electro spun PCL membrane over a rangeof humidity boundary conditions. As expected, asthe surrounding relative humidity increases, theflux across the membrane increases, as well.Table 1: Water vapour flux through electrospun PCLmembrane at varying relative humidity valuesFigure 8. Diffusion coefficients at 30 C (red), 50 C(blue), and 70 C (green) for a fluoropolymercopolymer film (183 microns).% RelativeHumidityDiffusion rateWater vapour 28500.0751289.94300.0432166.90Membrane Flavour FluxWater Vapour Transmission Rates (WVTR)A novel Payne style diffusion cell was designedand developed to measure the permeability/rateof diffusion of a thin film. The design of this cell isshown in Figure 9. Full description of the cell,including dry-cup and wet-cup methods, can befound in SMS Application Note 52. This cell canbe readily used to determine WVTR values.The Payne cell can also be used tomeasure flavour flux through packagingmembranes. To illustrate this application, acommercially available food storage bag wasused as a model membrane. The thickness was40 microns. Limonene, ethyl acetate, and amylacetate were used as model flavour compounds.Limonene was chosen as a hydrophobic
molecule, while ethyl acetate and amyl acetatewere chosen as more hydrophilic flavours. Thefollowing conditions were used: 25.0 C; 200sccm of dry flow outside of the Payne cell; andneat liquid with headspace inside the Payne cell.A summary of the results are shown in Table 2.Repeat experiments were performed with thelimonene vapour, indicating a reproducibility of /0.2 g/m2hr (n 2).Comparing molecules of similar chemistry,but different size, it is clear that the larger amylacetate vapour has a slower flux than the smallerethyl acetate vapour. Also, the morehydrophobic, limonene vapour has a higher fluxthan the hydrophilic amyl acetate. These twomolecules have similar molecular weights (130.19amu for amyl acetate and 136.24 amu forlimonene) and vapour pressures at roomtemperature (4 mmHg for amyl acetate and 2mmHg for limonene). Although other factorscannot be completely ignored, this data doesindicate that molecule chemistry does have aprofound effect on flavour loss through thispackaging material.Table 2: Flavor vapour flux through a food storage bag(40 micron thickness) at 25 C.FlavourMoleculeFlux[g/m2hr]Limonene18.4Ethyl Acetate37.7Amyl Acetate7.0Water Activity (Aw)The Payne cell can also be used in anovel method to determine the water activity of afood material. The methodology and validation ofthis technique is detailed in SMS ApplicationNote 62. The combination of DVS and the Paynecell has the following advantages for Awdetermination: inherently simple in concept; usesrelatively small samples; does not require periodiccalibrations; independent of chilled mirrorcalibrations; independent of surface temperaturecalibrations; and relatively fast and robust. Table2 displays the Aw values for some common foodsand their literature values. Note the excellentagreement with the DVS determined water activityvalues and those obtained using more traditionaltechniques.Table 2: Water activity values determined usingcombination of DVS and Payne cell.SampleDVS ValueLiterature ValueHoney0.57490.55 – 0.65Corn Starch0.39520.28 – 0.46Ketchup0.93060.93 – 0.95DriedCranberries0.51210.42 – 0.56Dried MilkPowder0.24530.2-0.4Bread Crumb0.9961 0.96Bread Crust0.89130.872-0.909
ConclusionUtilizing the functionality of DVS instrumentationfor the study of foods allows the vapour sorptioncharacteristics to be studied on raw materials,food ingredients, final food formulations, flavours,fragrances, and packaging materials. Watersorption on these materials can be vital inunderstanding material stability and improvingcustomer satisfaction. The use of a novel Paynecell allows barrier property characterisation andwater activity measurements. This overviewapplication note only summarises a handful ofthese applications, but hopefully illustrates howDVS technology could be applied to a wide rangeof food-related materials and challenges.[16] PM Young, H Chiou, T, Tee, D Traini, H-K Chan, F, Thielmann, and DBurnett,, Drug Development and Industrial Pharmacy, 33 :91-97 (2007).[17] RA Lane and G Buckton, International Journal of Pharmaceutics,207:49-56 (2000).[18] KL Vora, G Buckton, and D Clapham, Eur. J. Pharm. Sci., 22:97-105(2004).[19] AD Gift and LS Taylor, J. Pharm. And Biomedical Analysis, 43:14-23(2007).[20] SMS Application Note 507.[21] SE Hogan and G Buckton, International Journal of Pharmaceutics, 227:57-69 (2001).[22] LS Taylor, FW Langkilde and G Zografi, Journal of PharmaceuticalScience, 90:888-901 (2001).[23] J Crank and G. Park. Diffusion in Polymers, Academic Press New York(1968).References[1] T.P Labuza, Food Technology, 36-59 (1980).[2] C.J Lomauro, AS Bakshi, TP Labuza, Journal of Food Science, 50: 397-400(1985).[3] W Wolf, WEL Spiess, G Jung, H Weisser, H Bizot and R B Duckworth.Journal of Food Engineering, 3:51-73 (1984).[4] KD Foster, JE Bronlund, AHJ Paterson, Journal of Food Engineering,77:997-1006 (2006).[5] DJ Burnett, F Thielmann, and J Booth, International Journal ofPharmaceutic,. 287:123-133 (2004).[6] M Marin, I Baek, AJ Taylor, 2000. Flavor release as a unit operation: amass transfer approach based on a dynamic headspace dilution method.In: Roberts DD, Taylor AJ, editors. Flavor release. Washington, D.C.:American Chemical Society. p 153–65.[7] DM Bohn, KR Cadwallader, and SJ Schmidt, Food Engineering andPhysical Properties, 70: 109-116 (2005).[8] G Dardelle, V Normand, M Steenhoudt, P-E Bouquerand, M Chevalier,and P Baumgartner, Food Hydrocolloids, 21:953-960 (2007).[9] V Normand, G Dardelle, P-E Bouquerand, L Nicolas, and P Baumgartner,Journal of Agricultural and Food Chemistry, 53:7532-7543 (2005).[10] JJ.Fitzpatrick, M Hodnett, M Twomey, PSM Cerqueira, J O'Flynn, andYH Roos, Powder Technology, 178:119-128 (2007).[11] JJ Fitzpatrick, K Barry, PSM Cerqueira, T Iqbal, J O’Neill, and YH Roos,International Dairy Journal, 17:383-392 (2007).[12] BC Hancock and G Zografi, Journal of Pharmaceutical Science, 86:1-12(1997).[13] A Saleki-Gerhard, C Ahlneck, and G Zografi, International Journal ofPharmaceutics, 101 :237 (1994).[14] G Buckton, and P Darcy, Proc. 1st World Meeting APGI/APV, Budapest,9/11 (1995).[15] L Mackin, R Zanon, JM Park, K Foster, H Opalenik, and M Demonte,International Journal of Pharmaceutics, 231 :227 (2002).United States Office:Head Office:Surface Measurement Systems, Ltd, NASurface Measurement Systems, Ltd2125 28th Street SW, Suite I5 Wharfside, Rosemont RoadAllentown PA, 18103, USALondonHA0 4PE, UKTel: 1 610 798 8299Tel: 44 (0)20 8795 9400Fax: 1 610 798 0334Fax: 44 (0)20 8795 9401Email: science@surfacemeasurementsystems.com
This overview application note summarises several examples of using DVS for food -related applications including: water activity, moisture content, moisture-induced phase transitions, water-vapour transmission rates, and flavour loss. DVS Application . Moisture Sorption Properties of Food Products Note 102. and Packaging Materials Studied by DVS