Transcription
Journal of Theoretical and Applied Information Technology31st October 2020. Vol.98. No 20 2005 – ongoing JATIT & LLSISSN: 1992-8645www.jatit.orgE-ISSN: 1817-3195OPTIMUM WLAN PROTOCOL AND NETWORKARCHITECTURE IDENTIFICATION FOR VOIPAPPLICATION1ALI MOHD ALI, 2MAHMOUD DHIMISH, 3MALEK M. ALSMADI1,2Department of Engineering and Technology, University of Huddersfield, Queensgate HD1 3DH,Huddersfield, United Kingdom3Electrical and Computer Engineering Department, Lakehead University, Thunder Bay, Ontario, CanadaE-mail: 1a 90ali@hotmail.com, 2m.a.dhimish@hud.ac.uk, 3malsamdi@lakeheadu.caABSTRACTThis research developed a novel algorithm to evaluate Voice over Internet Protocol (VoIP) metrics ofdifferent IEEE 802.11 technologies in order to identify the optimum network architecture among BasicService Set (BSS), Extended Service Set (ESS), and the Independent Basic Service Set (IBSS). The proposedalgorithm will yield the rank order of different IEEE 802.11 technologies. By selecting the optimum networkarchitecture and technology, the best overall network performance that provides a good voice quality isguaranteed. Furthermore, it meets the acceptance threshold values for the VoIP quality metrics. Thisalgorithm was applied to various room sizes ranging from 2x3m to 10x14m and the number of nodes rangedfrom one to forty. The spatial distributions considered were circular, uniform, and random. The Quality ofService (QoS) metrics used were delay, jitter, throughput and packet loss.Keywords: VoIP, QoS, Performance Analysis; IEEE technologies.1.INTRODUCTIONHandling VoIP is currently a huge challenge in thecommunication industry. With the swift movementof business infrastructure and home users towardsWireless LAN (WLAN), it is vital to implement realtime traffic such as VoIP over WLAN. WLAN hasbecome popular these days because it is easy andsimple to deploy [1]. By providing reliable access tothe network resources and implementing real-timetraffic such as video and audio in business,institutional and home networks, WLAN hasbecome service-dominant and has increased inpopularity. WLAN performance directly depends onthe signal strength that operates through the air andvaries from topology to topology, which hascontributed to bringing about the flexibility of thenetwork establishment, the mobility of nodes, andcost reduction [2]. Internet-based services such asweb, email, and file transfers affect the usage ofWLANs in addition to voice over wireless networks.VoIP is a mechanism for transmitting time-sensitivevoice over the packet-switched network [3]. VoIPhas turned out to be a serious competitor to thetraditional public switched telephone network(PSTN) [4]. However, providing precise QoSconsidered as an issue for real-time multimediaapplications such as VoIP, video over IP and onlinegames. In order for VoIP to work adequately, theQoS parameters and characteristics performancehave to be fulfilled [5].In WLANs where VoIP application has beendeployed, a number of factors that affect the networkperformance should be addressed and evaluated suchas the wireless network architectures (BSS, ESS, andIBSS) and IEEE MAC layer technologies. Manyresearchers have analysed VoIP performance overWLAN standards. S. Mangold et al. [6] proposed aperformance evaluation study of IEEE 80211estandard and compared it to the legacy 802.11standard over BSS network architecture throughbuilding different simulation scenarios, andcharacterised their efficiency. The QoS parametersof VoIP services have been evaluated and monitoredin a number of studies [7-11]. S. Garg and M.Kappes [7] studied the behaviour of VoIP over IPnetworks and demonstrated that the VoIPperformance is reduced by clients’ spatialdistribution factor. They evaluate the VoIP overIEEE 802.11b network using 3 to 11 VoIP calls. Twoalgorithms were introduced by Y. Amir et al. [8] toimprove the performance of VoIP application anddemonstrate how the packet loss effects can beeliminated to provide better VoIP performance.Whereas K. Salah and A. Alkhoraidly [9] applied a3237
Journal of Theoretical and Applied Information Technology31st October 2020. Vol.98. No 20 2005 – ongoing JATIT & LLSISSN: 1992-8645www.jatit.orgnovel simulation approach on a typical network of asmall enterprise to evaluate the network readinessfor supporting VoIP services; while the VoIP QoSperformance metrics were investigated by L. Shi etal. [10] over IBSS network architectures. As anoutcome of this, VoIP is shown to provide betterperformance under light traffic. Furthermore, a QoSalgorithm was proposed by J. L. Chen et al. [11] toreduce the average delay time and jitter for VoIPapplication and its services. The relation betweenVoIP codec and QoS parameters was studied by Y.Labyad et al. [12] to investigate the bestperformance VoIP codec over IP network. At thesame time, there are initiatives to monitor IEEEstandards. On the other hand, QoS parameters suchas end to end delay and throughput were observed byV. Sharma et al. [13] across two IEEE technologies802.11, 11g and demonstrated that the IEEE 802.11atechnology performed better across BSS networkarchitecture. A. Mohd Ali et al. [14] aimed to builddifferent scenarios to evaluate VoIP QoScharacteristics and to examine the effect ofenhancement on the QoS. The evaluation, carried outusing the OPNET simulator, would involve thevarious parameters of the Wireless LAN802.11e tosee if this improvement of distributed channel accessimproves the efficiency of the Wireless LAN 802.11standard.The evaluation, implemented using the OPNETsimulator, will contain the different parameters ofWireless LAN 802.11e to see how this enhancementin distributed channel access increases theperformance over the Wireless LAN 802.11 standardSeveral schemes have been proposed to enhanceVoIP services [15, 16]. T. H. Hussain et al. [15]examined VoIP services over an existing network.As a result of this study, it was shown that the packetloss rate decreased, while a new scheme waspresented by P. Dong et al. [16] to enhance VoIPservices, and an improvement in the VoIP capacitywas guaranteed. An algorithm for assessing realtime services such as VoIP and video conferencingof various IEEE 802.11 technologies is proposed inA. Mohd Ali et al. [17].Various efforts have been developed to evaluatethe VoIP QoS parameters for the different number ofnodes that are configured over IEEE technologies[18-20]. S. Pérez et al. [18] introduced a simulationscenario to evaluate the IEEE 802.11e standard for anumber of VoIP nodes that varied from 5 to 45 nodes;as a result of this simulation scenario, it was shownthat there is an increase in average delay for VoIPapplication. K. AlAlawi, H. Al-Aqrabi [19]evaluated two QoS VoIP parameters, end-to-enddelay and throughput, over two IEEE technologiesE-ISSN: 1817-3195(802.11g and 11e), where it was shown that the VoIPservices improved over the enhanced IEEE standard.However, VoIP QoS performance metrics werestudied by A. M Sllame et al. [20] using differentrouting protocols. For instance, they used only 15nodes without considering the effect of physicallayer technologies, spatial distributions, or networkarchitecture.To the best of our knowledge, no previous workhas evaluated the VoIP QoS metrics of differentIEEE 802.11 technologies in order to identify theoptimum technology standard across infrastructureand independent network architectures, which willbe introduced in this article. The implementation ofQoS parameters such as delay, jitter and packet lossover VoIP networks is also considered as anenormous challenge. At the same time, the existenceof different IEEE 802.11 technologies requires alogical analysis to decide which technology shouldbe used and put into practice. Furthermore, theavailability of IBSS, BSS, and ESS have increasedthe difficulty of deciding which network architectureis best to use, regarding the assigned wirelessnetwork resources, to provide optimum networkquality. Moreover, as demonstrated in A. Mohd Aliet al. [21] the optimum performance of IEEEtechnologies deployed in real-time industrialcommunication systems not always guaranteed torecent technologies (802.11n) over the older one(802.11g), for this exact reason our work provides ananalysing study that suggests to the user theoptimum technology/technologies and networkarchitecture without wasting resources nor getting inthe issues of randomly choosing specifictechnologies then redesigning the wholeconfiguration.This article looks into the possibilities of havingany effects on network performance when using adifferent number of nodes and IEEE physical layertechnologies implemented across various spatialdistributions.2.PRELIMINARIES2.1 IEEE MAC layer technologiesThe Institute of Electrical and ElectronicsEngineers (IEEE) developed the 802.11 group as atechnology for WLAN technology. IEEE 802.11aoperates in the 5 GHz frequency band and 802.11boperates in the frequency band 2.4 GHz, IEEE802.11b supports transmission speeds of up to 11Mbps and IEEE 802.11a provides a transmissionspeed of 54 Mbps [22]. IEEE 802.11g supportstransmission speeds of up to 54 Mbps by applyingOrthogonal Frequency Division Multiplexing3238
Journal of Theoretical and Applied Information Technology31st October 2020. Vol.98. No 20 2005 – ongoing JATIT & LLSISSN: 1992-8645www.jatit.org(OFDM) in the 2.4 GHz band. IEEE 802.11n usesMultiple Input Multiple Output OrthogonalFrequency Division Multiplexing (MIMO-OFDM)techniques to achieve transmission speeds of up to300 Mbps. In case of using a channel bandwidth upto 40 MHz, IEEE 802.11n can provide transmissionspeeds of up to 600 Mbps [23]. IEEE 802.11standard does not support time-sensitive voiceapplications but only best-effort services. Afterseveral refinements and with the increasing call forreal-time multimedia applications, a newamendment named IEEE 802.11e was designed [24].Table 1 shows the main differences between theIEEE 802.11 standards.E-ISSN: 1817-31952.3 VoIP QoS performance metrics andImportance coefficientPerformance metrics are defined in terms ofQoS metric parameters for VoIP application. ForVoIP, a satisfaction criterion (acceptable threshold)for each QoS metric parameter is identified [27, 28]as shown in Table 2, which represents the key QoSrequirements and recommendations for VoIP (bearertraffic).Table 2: VoIP QoS metric parameters importanceQoS forDelay Jitte Throughpu RacketVoIP(sec)rtLoss(sec) (kbps)Rate(%)Table 1: Summary of IEEE 802.11 1nDCFDCFDCFDCFEDCAData Rate(Mbps)1, 2Up f SpatialStreamsFrequency Band(GHz)Up to54Up to600OFDM1, 2,5.5,11DSSSERPOFDM52.42.4MIMOOFDM2.4 &52020202020, or4011111, 2,3, or 4ImportanceHHMLThreshold0.150.04455Where: H High, M Medium and L Low2.2 IEEE networks infrastructuresIEEE 802.11 defines two basic modes ofcommunicationbetweenWLANnodes:Infrastructure and Independent which are known asAd Hoc Networks [25].The IEEE 802.11infrastructure networks use APs. AP supports waveextension by providing the integration pointsnecessary for network connectivity between multipleBSSs, thus forming an Extended Service Set (ESS).In addition, the IBSS or Ad-hoc network is aspecified group of nodes in a single BSS for thepurpose of internet working without the aid of acentralized coordination function [26] (i.e. accesspoint).The VoIP quality is directly affected by thefollowing QoS metric measurements: Packet End-to-End delay (sec): the time taken bydata/voice to travel from node A to node B on thenetwork, should be below 150 ms [27]. Jitter (sec): the variance in delay caused byqueuing, should be less than 40 ms [27]. Throughput (bit/sec): the total rate at whichpackets are transferred from the source to thedestination at a prescribed time period. Therequired throughput for a VoIP in one directionis 45 kbps [27, 28]. Traffic Sent (packet/sec) and Traffic Received(packet/sec): used to calculate packet loss rate,which is the percentage of packets that get lostalong the communication path after the packet istransmitted by the sender into the network, whichshould be below 5%.It is worth noting that an important coefficient isassigned to each of the VoIP parameters (VIP) interms of its impact on the call quality of the service.Table 2 shows the QoS qualitative importance ofeach QoS parameter and their related thresholdvalues for VoIP application. In order to be able toaccount for these qualitative factors in a simulation3239
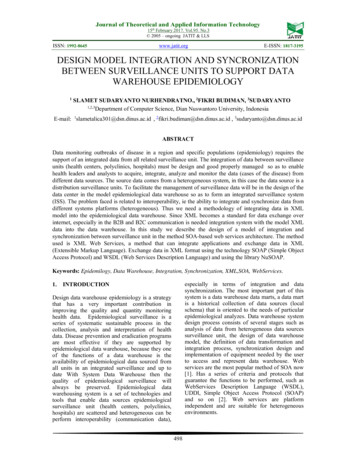
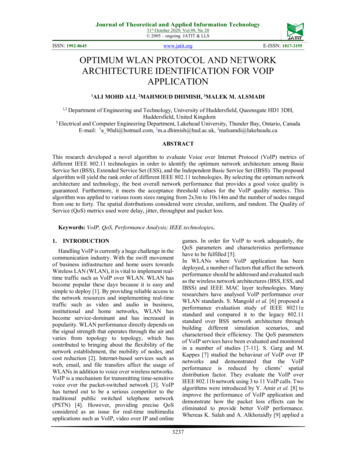
Journal of Theoretical and Applied Information Technology31st October 2020. Vol.98. No 20 2005 – ongoing JATIT & LLSISSN: 1992-8645www.jatit.orgthey have to be translated into numbers (H 1, M 0.5,L 0.1, and VL 0).3. PROPOSED ALGORITHM: PROTOCOLAND NETWORK ARCHITECTURESELECTIONE-ISSN: 1817-3195ParametersIEEE TechnologyValuesIEEE 802.11 (FHSS)IEEE 802.11a (OFDM)IEEE 802.11b (DSSS)IEEE 802.11g OFDM)IEEE 802.11e (QoS)Voice frame per packet1CodecCompression andDecompression delayTypes of service (TOS)G.7110.02 sec3.1 Building projects (Simulation environment)In this paper, an OPNET simulation platform[29] is used to build and analyse all VoIP scenarios.OPNET is a discrete event system simulator thatsimulates the system behaviour by modelling eachevent happening in the system and processing it by auser-defined process. OPNET Modeler allows you tostudy communications networks, equipment,applications and protocols with ease and scalability.The most successful technology companies use themodel to develop their research and developmentprocesses.Using OPNET simulation, we have consideredtwo main sources’ inputs for this algorithm: userconfigurations and technology specifications(standards). User configurations defines the numberof nodes that are needed in the network and spatialdistribution. Technology specifications (standards)defines the physical layer technologies and networkarchitectures.The top part of Figure 1 defines these factors.Network architectures specify how different wirelesscomponents connect together in either of two modes:the presence of access points (BSS and ESS) modeor the absence of access points (IBSS) mode, numberof nodes needed in this network which breaks downto four groups (0-5, 6-10, 11-20 and 21-40), spatialdistribution which specifies the topology in whichthese nodes will be distributed in a circular (oval)way, uniform (grid) way, or randomly scattered way.IEEE MAC Technologies defines the physical layertechnologies that will be used to build manydifferent scenarios.All network architectures (BSS, ESS, IBSS)have been configured and implemented across allthree spatial distributions (circular, uniform, random)for the four groups of nodes. Figures 2(a), (b) and (c)show some of these implemented scenarios.The performances of different scenarios for VoIPapplications have been investigated via an OPNETsimulator. The protocols used and the applicationsettings for the simulation are listed in Table 3.Table 3: Simulated Application and Protocols3240Interactive voiceFigure 1: Flowchart of the proposed algorithm
Journal of Theoretical and Applied Information Technology31st October 2020. Vol.98. No 20 2005 – ongoing JATIT & LLSISSN: 1992-8645www.jatit.orgaE-ISSN: 1817-3195bcFigure 2: Design of the three Network Architectures across three Spatial Distributions for VoIP(a) Basic Service Set (BSS), (b) Extended Service Set (ESS), (c) Independent Basic Service Set (IBSS)3.2 System model’s calculationThesystemcalculationsandthemathematical model are shown in phase II at thebottom part of Figure 1. The inputs for thealgorithm’s mathematical calculations are VoIP QoSThreshold values and Cumulative DistributionFunction (CDF) distribution. VoIP QoS Thresholdvalues (satisfaction criterion) are taken fromliterature as shown in Table 2 [26, 27]. CDFdistribution is produced for these QoS metricparameters from OPNET after running thesimulation scenarios.Mathematical calculations will be done todetermine how a particular scenario has satisfiedcertain performance metrics for VoIP application.The following steps are used to explain thecalculations of this algorithm and to analyse theresults for each of the above projects. QoS Performance Metric (QPM): as Figure 3illustrates, the value that is produced by applyingthe VoIP QoS metric parameter threshold value(PTV) for each QoS performance criterion nonce is represented in3241
Journal of Theoretical and Applied Information Technology31st October 2020. Vol.98. No 20 2005 – ongoing JATIT & LLSISSN: 1992-8645www.jatit.orgCDF distribution F(n), which is given by (1).𝑄𝑃𝑀𝐹 𝑝𝑡𝑣E-ISSN: 1817-31951.If ptv F(n): it means that the PTV has aspecific value on its CDF distribution equalto QPM for this metric parameter. QPM isweighted by VIP to produce QFM. Thenthe aggregation of all QFMs yields AFMwhich is used to classify IEEE technologies.2.If ptv F(n): it means that the QPM valueequals 1 and QFM has arisen.(1)1.2QPMjCDF probability10.83.0.60.4Jitter thresholdfor VoIP (PTVj)0.20‐0.0400.040.080.12Jitter (sec)Figure 3: QPM for Jitter QoS Fitness Metric (QFM): the value that isproduced by applying a weighting to the QPM(assigned by importance) for each QoS metricparameter (H 1, M 0.5, L 0.1, and VL 0) isexpressed by (2).𝑄𝐹𝑀𝑄𝑃𝑀 𝑉𝐼𝑃If ptv F(n): it means that the QPM valueequals 0 and QFM will be initialized.The value generated for the VoIP QoS metricparameters (jitter, delay, throughput and packet loss)will contribute to filling in Table 4 which leads to arank order of IEEE technologies for each networkarchitecture.All VoIP QoS metric parameters will becalculated as explained in the previous sectionsexcept for a packet loss parameter. OPNET Modeleris designed to produce the result of the packet lossparameter as a Boolean value (0.0 or 1.0) thatcorresponds to the acceptance or rejection of apacket, respectively. However, this work requires anumerical value for the packet loss.Table 4: IEEE technologies calculation and rank order listfor one projectA code has been programmed using MATLAB(2)VOIP The final step will be calculating the ApplicationFitness Metric (AFM) which is to aggregate allQFMs for n VoIP QoS metric parameters (delay,jitter, throughput and packet loss), for each IEEE802.11 technology j, as demonstrated by (3).𝐴𝐹𝑀𝑄𝐹𝑀Technology(3) Based on AFMs of the IEEE 802.11 technologies,the rank order of these five technologies will beproduced for each of the three built networkarchitectures. Hence, the best networkarchitecture performance will be identified for allgroups of nodes as will be explained later insection 4.The flowchart presented in Figure 1 illustrates thesemathematical steps which produce the AFM valuefor each IEEE MAC technology.As explained previously, CDF distributionF(n) [30] is going to be produced for all VoIP QoSmetric parameters from the OPNET Modelersimulation, then analysed against PTV as PLAFM11eTechnology5software to develop a method to calculate the packetloss percentage for VoIP application. This method islinked directly with the OPNET Modeler to producea specific packet loss percentage for a VoIPapplication. VoIP packet loss rate 𝜔 of a node i isthe ratio of dropped voice packet 𝑘 i to total voicepackets 𝜌 multiplied by 100%, as demonstrated by(4).3242
Journal of Theoretical and Applied Information Technology31st October 2020. Vol.98. No 20 2005 – ongoing JATIT & LLSISSN: 1992-8645𝜔www.jatit.org𝑘𝑖 𝜌 100%(4)This requires the traffic received/send ratevalues from OPNET Modeler to be integrated toproduce the total number of packets received andsent. Then, the exact packet loss ratio is producedand should be presented as a CDF diagram to enableidentification of the values of QPM, QFM and AFMusing the previously explained flowchart.Identical calculation steps were applied for theother three groups of nodes (0-5, 11-20 and 21-40),to ascertain the best performing IEEEtechnology/technologies and to produce all values ofQPMs, QFMs, and AFMs for all QoS metricparameters regarding VoIP application in allnetwork architectures across the three spatialdistributions.4. RESULTS AND PERFORMANCEEVALUATIONIn this article, the output of the proposedalgorithm identifies the options available for a client(user) based on the tables of the results that havebeen produced for all scenarios across three networkarchitectures. By options, the best performingtechnologies across all three network architectures(IBSS, BSS and ESS) is implied. All simulatedscenarios are applicable to the lab (room) sizes from2x3m to 10x14m.The format of the results is demonstrated basedon the presence of an access point; therefore, thetables of the results are interpreted (translated) intwo results’ flowcharts: generic flowchart and IBSSchart, as demonstrated in Figures 4 and 5,respectively. In case there is at least one access point in thenetwork, then the proposed algorithm in Figure 1and the result in Figure 4 will be applied. Thiscase is applicable to both infrastructurearchitecture layers (ESS and BSS). All scenariosare running in all five IEEE 802.11 technologiesand three spatial distributions: circular, uniform,and random. If the network is configured without any accesspoints, then the proposed algorithm in Figure 1and the IBSS result’s flowchart described inFigure 5 will be used. All scenarios are runningin all five IEEE 802.11 technologies and threespatial distributions: circular, uniform andrandom.Both results’ flowcharts start by identifying thenumber of nodes that will be used to configure therequired network and work for the environmentcomposed of 1 to 40 nodes.E-ISSN: 1817-3195Based on the user’s configuration and thenumber of nodes required to set up the designatednetwork, both results’ algorithms classify four keygroups of nodes, presented as follows:1. The first category, where 5 N 0, in the genericflowchart, as can be seen in Figure 4, if the clientis going to build a small network (number ofnodes less than or equal to five nodes), then ESSis the best network architecture across all threespatial distributions. Furthermore, all five IEEE802.11 technologies perform the same. However,in the case of the IBSS flowchart, all threetechnologies 802.11a, 11g, and 11e provide thebest performance across all spatial distributions,according to Figure 5.2. As shown in Figure 4, when 10 N 5, if theclient is implementing a network using a numberof nodes between 5 and 10, then both ESS or BSSprovide optimum performance across all threespatial distributions if they are implementedusing only three technologies including 802.11a,11g, and 11e. In the case of the IBSS result’sflowchart, the technologies 802.11a, 11g, and11e remain the optimum across all spatialdistributions.3. The third category, where 20 N 10, if theclient is going to build a medium size networkwith the number of nodes from 10 to 20, the BSSand ESS provide a number of options. For BSSarchitecture, IEEE 802.11a technology performsthe ideal technology across all three spatialdistributions. IEEE 802.11a, 11g, and 11e, areacknowledged as the preferable solutions forESS architecture. However, according to theIBSS flowchart, the IEEE 802.11a is theoptimum technology to be used.4. In the fourth category, where 40 N 20, thebest architecture for this large network is ESS.Subsequently, the client has a number of optionsto select according to the information provided inFigure 4. First, both technologies 802.11a and11g are optimal to use if the network is onlyconfigured in circular and random distributions;while the second-best option is to use IEEE802.11a technology that is configured uniformly.On the other hand, in the IBSS flowchart, allthree technologies 802.11a, 11g, and 11e give anidentical performance.3243
Journal of Theoretical and Applied Information Technology31st October 2020. Vol.98. No 20 2005 – ongoing JATIT & LLSISSN: 1992-8645www.jatit.orgE-ISSN: 1817-3195Figure 4: Generic flowchart of the proposed algorithm using various layers5.COMPARATIVE STUDYIn this section, a brief comparison between ourproposed method with multiple algorithms presentedin [7, 10, 18-20, 31 and 32] will be offered. Thefollowing features have been compared andsummarised in Table 5, features including: VoIPmetric parameters, number of nodes, networkarchitecture, IEEE technology, and the simulationmodel.As noticed, methods such as [7] and [10]evaluates the network on the basis of fixed numberof nodes, where metric parameters such as the packetloss is predominant in the calculations of theoptimum network configuration. Similarly, [20, 31,and 32] evaluates different IEEE technologies onfixed number of nodes, while only considering onenetwork architecture such as IBSS, ESS, andWiMAX.Despite the fact that recent studies such as [18]and [19] have integrated their model using variousnodes, 5-45 and 3-15, respectively. However, theirproposed approaches were only validated using BSSand ESS network architectures. Another drawbackassociated with [18] and [19] approaches, that it onlyconsiders the evaluation of the algorithm using oneIEEE standard, particularly IEEE 802.11e.By contrast with above limitations, in this article,we present the development of a novel evaluationparametric approach that is capable of identifyingthe optimum network configuration using threedifferent network architecture: BSS, ESS, and IBSS.The proposed approach has been evaluated usingdifferent node size (1 to 40) with respect to five3244
Journal of Theoretical and Applied Information Technology31st October 2020. Vol.98. No 20 2005 – ongoing JATIT & LLSISSN: 1992-8645www.jatit.orgE-ISSN: 1817-3195Figure 5: Flowchart of only IBSS’s resultsdifferent IEEE technology standers including:802.11, 802.11a, 802.11b, 802.11g, and 802.11e.6.(OFDM) modulation technique, which usessubchannels to transmit different signals (image andsound) at the same band simultaneously.CONCLUSIONThis work has developed a novel algorithm toassess VoIP QoS metrics of different IEEE 802.11technologies in order to choose the optimumnetwork architecture among BSS, ESS, and IBSS.The rank order of different IEEE 802.11technologies has been produced across differentspatial distributions. The results show that ESSarchitecture has the same performance for all spatialdistributions regardless of the network size. Inaddition, BSS performance is degraded when thenumber of nodes is more than twenty. Furthermore,IBSS can be worked efficiently with the 802.11a,802.11g and 802.11e technologies that implementthe Orthogonal Frequency Division Multiplexing3245REFERENCES[1] J. F. Kurose, K. W. Ross. ComputerNetworking: A Top-Down ApproachFeaturing the internet, Addison Wesley, 2012.[2] S. L. Wu, Y. C. Tseng. ‘‘Wireless Ad HocNetworking—Personal-Area,Local-Area,and the Sensory-Area Networks”. Taylor &Francis Group, 2007.[3] Meisel, J.B. and Needles, M. (2005), ‘‘Voiceover internet protocol (VoIP) developmentand public policy implications’’, 2005, Vol. 7no. 3, pp. 3-15.[4] K. O. Stoeckigt, H. L. Vu, "VoIP Capacity—Analysis, Improvements, and Limits in IEEE802.11 Wireless LAN," in IEEE Transactions
Journal of Theoretical and Applied Information Technology31st October 2020. Vol.98. No 20 2005 – ongoing JATIT & LLSISSN: 1992-8645www.jatit.orgE-ISSN: 1817-3195Table 5: Comparative results between the proposed approach and several methods available in the literatureReferenceApproachVoIP metricparametersNumberof del[7]Study the limitationsof the 802.11 (a/b) insupporting VoIP callsover a WLANPacket lossJitterRound-Trip time1BSS802.11bNAPacket lossBandwidthDelay6IBSS802.11OPNETAverage delayQueue size5-45BSS802.11eMöbius [10][18]Study the problem ofVoice applicationsupport in multi-hopIEEE802.11 ad hocnetworksEvaluate EDCA 802.11eprotocol conditions forsupporting QoS in an802.11a scenario at 36Mbps[19]Evaluate theperformance ofVoIP in 802.11 5ESS802.11eOPNET[20]VoIP QoS performancemetrics were studiedusing different routingprotocolsJitterLAN delayPackets size15IBSS802.11bOPNET[31]VoIP performance wascompared between LAN(802.3) and WLAN(802.11)Packet lossDelaylatencyJitter5ESS802.11eOPNET[32]Evaluate theperformance of variousVoIP codecs usingdifferent service classesThroughputAverage delayJitter2, 4, 6, 8and 10WiMAX802.16NS-2Present studyEvaluate VoIP metricsof different IEEE802.11 technologies inorder to identify theoptimum 11b802.11g802.11eOPNETDelayJitterThroughputPacket losson Vehicular Technology, vol. 59, no. 9, .[5] S. Seytnazarov, Y. Kim, "QoS-AwareAdaptive A-MPDU Aggregation Schedulerfor Voice Traffic in Aggregation-EnabledHigh Throughput WLANs," in IEEETransactions on Mobile Computing, vol. 16,no. 10, pp. 2862-2875, 1 Oct. 2017, doi:10.1109/TMC.2017.2672994.[6] S. Mangold, S. Choi, P. May, O. Klein, G.Hiertz, and L. Stibor. “IEEE 802.11e WirelessLAN for Quality of Service”. In Proc.European Wireless, vol. 2, pp. 32-39, (2002,February).3246[7] S. Garg, M. Kappes. Can I add a VoIP call?.In Communications.ICC'03.IEEEInternational Conference on, 2003, Vol. 2, pp.779-783. IEEE.[8] Y. Amir, C. Danilov, S. Goose, D. Hedqvist,& A. Terzis. “1-800-OVERLAYS: usingoverlay networks to improve VoIP quality”.In Proceedings of the international workshopon Network and operating systems supportfor digital audio and video, 2005, (pp. 51-56).ACM.[9] K. Salah, & A. Alkhoraidly. An OPNET‐based simulation approach for deployingVoIP. International Journal of NetworkManagement, 2006, 16(3), 159-183.
Journal of Theoretical and Applied Information Technology31st October 2020. Vol.98. No 20 2005 – on
from one to forty. The spatial distributions considered were circular, uniform, and random. The Quality of Service (QoS) metrics used were delay, jitter, throughput and packet loss. Keywords: VoIP, QoS, Performance Analysis; IEEE technologies. 1. INTRODUCTION Handling VoIP is currently a huge challenge in the communication industry.