Transcription
CHAPTER 4Steam power plantsE. KhalilDepartment of Mechanical Power Engineering,Cairo University, Cairo, Egypt.AbstractThe efficient utilization of fossil energy in power generation together with lowpollution in conventional thermal power plants is a topic that is gaining interestinternationally. The energy availability and sustainability scenario is an area ofgrowing interest and demand in many countries worldwide due to the greaterdesire to enhance standards of living, increase productivity and preserve a cleanenvironment. Efficient energy use is favorable for better productivity, product quality,costs, and quality of human life but the use of energy adversely impacts our environment. The fundamental concepts of power generation had been refined toenhance the power generation efficiency through the use of modern techniques ofwaste heat recovery and co-generation. This chapter summarizes the basic powercycles in steam power plants and outlines the various methods of improvement.The main goal of efficient power generation is, among others, to rationalize theuse of fossil fuels and enhance the combustion efficiencies. This is outlined inthis chapter through a review of the various combustion modeling techniquesfor furnace flames under steady and time dependent configurations. The abilityof numerical computations to predict the boiler furnace thermal behavior is anultimate goal. The heat transfer to furnace walls through thermal radiation isreviewed briefly to demonstrate the present capabilities. Boiler furnace walls aresubject to the major problems of fouling that result in deterioration of the performance and drastic reduction of the heat transfer characteristics. This workbriefly highlights the fouling problem in power plant water walls and proposesa monitoring, inspection, and maintenance schedule. The information provides aquick guide on the commonly faced operation problems and methods to enhanceenergy conversion efficiency.WIT Transactions on State of the Art in Science and Engineering, Vol 42, 2008 WIT Presswww.witpress.com, ISSN 1755-8336 (on-line)doi:10.2495/978-1-84564-062-0/04
100Thermal Engineering in Power Systems1 IntroductionCentralized power generation became possible when it was recognized thatalternating current power lines can transport electricity at low costs across greatdistances by taking advantage of the ability to raise and lower the voltage usingpower transformers. Since 1881, electricity has been generated for the purpose ofpowering human technologies from various sources of energy. The first powerplants were run on water power or coal, and today we rely mainly on coal, nuclear,natural gas, hydroelectric, and petroleum with a small amount from solar energy,tidal harnesses, wind generators, and geothermal sources. Rotating turbinesattached to electrical generators produce most commercially available electricity.Turbines are driven by a fluid, which acts as an intermediate energy carrier. Thefluids typically used are: Steam in steam turbines – Water is boiled by nuclear fission or the burning offossil fuels (coal, natural gas, or petroleum). Some newer plants use the sun asthe heat source: solar parabolic troughs and solar power towers concentratesunlight to heat a heat transfer fluid, which is then used to produce steam.Another renewable source of heat used to drive a turbine is geothermal power.Either steam under pressure emerges from the ground and drives a turbine orhot water evaporates a low-boiling liquid to create vapor to drive a turbine. Water in hydraulic turbines – Turbine blades are acted upon by flowing water,produced by hydroelectric dams or tidal forces. Wind – Most wind turbines generate electricity from naturally occurring wind.Solar updraft towers use wind that is artificially produced inside the chimneyby heating it with sunlight. Hot gases in gas turbines – Turbines are driven directly by gases produced bythe combustion of natural gas or oil.Combined cycle gas turbine plants are driven by both steam and gas. They generatepower by burning natural gas in a gas turbine and use residual heat to generateadditional electricity from steam. These plants offer efficiencies of up to 60%.Various other technologies have been studied and developed for power generation.Solid-state generation (without moving parts) is of particular interest in portableapplications. This area is largely dominated by thermoelectric (TE) devices, thoughthermionic (TI) and thermo-photovoltaic (TPV) systems have been developedas well. Typically, TE devices are used at lower temperatures than TI and TPVsystems. Piezoelectric devices are used for power generation from mechanicalstrain, particularly in power harvesting. Betavoltaics are another type of solid-statepower generator, which produces electricity from radioactive decay. Fluid-basedmagnetohydrodynamic power generation has been studied as a method for extracting electrical power from nuclear reactors and also from more conventional fuelcombustion systems. Electrochemical electricity generation is also important inportable and mobile applications. Currently, most electrochemical power comesfrom closed electrochemical cells (“batteries”), which are arguably utilized moreWIT Transactions on State of the Art in Science and Engineering, Vol 42, 2008 WIT Presswww.witpress.com, ISSN 1755-8336 (on-line)
Steam Power Plants101as storage systems than generation systems, but open electrochemical systems,known as fuel cells, have been undergoing a great deal of research and development in the last few years. Fuel cells can be used to extract power either fromnatural fuels or from synthesized fuels (mainly electrolytic hydrogen) and so canbe viewed as either generation systems or storage systems depending on their use.Factors and parameters affecting the selection of steam power plant capacitiesand sites [1]:1.2.3.4.Types of service (base load or peak load).Location (relative to water and fuel).Space available (each power plant has a certain area/unit energy produced).Reliability: Steam turbine life is extremely long. There are steam turbines thathave been in service for over 50 years. Overhaul intervals are measured inyears. When properly operated and maintained (including proper control ofboiler water chemistry), steam turbines are extremely reliable. They requirecontrolled thermal transients as the massive casing heats up slowly and differential expansion of the parts must be minimized.5. Environment: Emissions associated with a steam turbine are dependent on thesource of the steam. Steam turbines can be used with a boiler firing any one ora combination of a large variety of fuel sources, or they can be used with a gasturbine in a combined cycle configuration. Boiler emissions vary depending onfuel type and environmental conditions. Boiler emissions include nitrogenoxide (NOx), sulfur oxides (SOx), particulate matter (PM), carbon monoxide(CO), and carbon dioxide (CO2). Recently, NOx control has been the primaryfocus of emission control research and development in boilers. The followingprovides a description of the most prominent emission control approaches [2].Combustion control techniques are less costly than post-combustion controlmethods and are often used on industrial boilers for NOx control. Control ofcombustion temperature has been the principal focus of combustion processcontrol in boilers. Combustion control requires tradeoffs – high temperaturesfavor complete burn-up of the fuel and low residual hydrocarbons and CO, butpromote NOx formation. Very lean combustion dilutes the combustion processand reduces combustion temperatures and NOx formation. However, if themixture is too lean, incomplete combustion occurs, increasing CO emissions [3].6. Cost (capital cost and maintenance cost): There is broad consensus amongscientists that we are not close to running out of fossil fuels. Despite this abundance, political considerations over the security of supplies, environmentalconcerns related to global warming and sustainability might move the world’senergy consumption away from fossil fuels. A government-led move awayfrom fossil fuels would most likely create economic pressure through carbonemissions trading and green taxation. Some countries are taking action as aresult of the Kyoto Protocol, and further steps in this direction are proposed.For example, the European Commission has proposed that the energy policyof the European Union should set a binding target of increasing the level ofrenewable energy in the EU’s overall mix from 7% today to 20% by 2020.WIT Transactions on State of the Art in Science and Engineering, Vol 42, 2008 WIT Presswww.witpress.com, ISSN 1755-8336 (on-line)
102Thermal Engineering in Power Systems2 Energy scenarios2.1 Crude oil productionWorld crude oil production during August 2005 was 74 million barrels per day, up0.2 million barrels per day from the level in the previous month. OPEC (Organizationof the Petroleum Exporting Countries) production during August 2005 averaged31 million barrels per day, down 0.1 million barrels per day from the level in theprevious month. During August 2005, production increased in the United ArabEmirates by 50,000 barrels per day; Algeria by 20,000 barrels per day; Libya by15,000 barrels per day; and Iran by 10,000 barrels per day. Production decreasedin Nigeria and Iraq each by 100,000 barrels per day and remained unchanged inSaudi Arabia, Venezuela, Kuwait, Indonesia, and Qatar. Among the non-OPECnations, production during August 2005 increased in Mexico by 332,000 barrelsper day; Russia by 150,000 barrels per day; the United States by 29,000 barrelsper day; and China by 14,000 barrels per day. Production decreased in the UnitedKingdom by 215,000 barrels per day; Canada by 92,000 barrels per day; Norwayby 72,000 barrels per day; and Egypt by 3000 barrels per day [4].2.2 Petroleum consumptionIn July 2005, consumption in all OECD (Organization for Economic Cooperation and Development) countries was 49 million barrels per day, 1% (percentagechanges are based on unrounded data) lower than the July 2004 rate. ComparingJuly rates in 2005 and 2004, consumption was higher in 2005 in Canada ( 1%) andSouth Korea ( 1%). The July 2005 consumption rate was lower in Italy (–7%);Germany (–4%); France and Japan (each –2%); the United Kingdom (–1%); andthe United States (less than –1%), compared with the rate one year earlier.2.3 Petroleum stocksFor all OECD countries, petroleum stocks at the end of July 2005 totaled 4.2 billionbarrels, 4% (percentage changes are based on unrounded data) higher than theending stock level in July 2004. Stock levels were higher in July 2005 in the UnitedStates ( 6%); France ( 4%); Germany ( 3%); and Canada and Japan (each 2%).Stock levels were lower in the United Kingdom (–6%) and South Korea and Italy(each –2%), compared with levels one year earlier.3 Steam power plants cycles3.1 Basic cycle descriptionRankine cycles describe the operation of steam heat engines commonly foundin power generation plants as schematically shown here in Fig. 1. In such vaporWIT Transactions on State of the Art in Science and Engineering, Vol 42, 2008 WIT Presswww.witpress.com, ISSN 1755-8336 (on-line)
Steam Power Plants103Figure 1: Simple Rankine cycle.power plants, power is generated by alternately vaporizing and condensing aworking fluid (in many cases water, although refrigerants such as ammonia mayalso be used) [1].There are four processes in the Rankine cycle, each changing the state of theworking fluid. These states are identified by number in Fig. 1. Process 1-2s: First, the working fluid is pumped (ideally isentropically) fromlow to high pressure by a pump. Pumping requires a power input (for examplemechanical or electrical). Process 2s-3: The high pressure liquid enters a boiler where it is heated at constant pressure by an external heat source to become a saturated vapor. Commonheat sources for power plant systems are coal, natural gas, or nuclear power. Process 3-4s: The saturated vapor expands through a turbine to generate poweroutput. Ideally, this expansion is isentropic. This decreases the temperature andpressure of the vapor. Process 4s-1: The vapor then enters a condenser where it is cooled to become asaturated liquid. This liquid then re-enters the pump and the cycle repeats.3.2 Actual Rankine cycleIn actual situations, both the water pumps and the steam Turbines do not operate isentropically and losses result in more power demand for pumping and less power actually generated by steam to blades [1]. The actual Rankine cycle is shown in Fig. 2.Such losses are clearly shown in the following comparisons. That is,h3 – h4 h3 – h4s andh2 – h1 h2s – h1The performance of an actual turbine or pump is usually expressed in terms ofisentropic efficiency. The isentropic efficiency of a turbine (η T) is defined as theratio of “work delivered by the actual turbine” to “work delivered by an isentropicturbine.”WIT Transactions on State of the Art in Science and Engineering, Vol 42, 2008 WIT Presswww.witpress.com, ISSN 1755-8336 (on-line)
104Thermal Engineering in Power SystemsFigure 2: Practical Rankine cycle.hT h3 h4h3 h4s(1)The isentropic efficiency of a pump (ηP) is defined as the ratio of “work requiredby an isentropic pump” to “work required by the actual pump.”hP h2s h1h2 h1(2)3.3 Efficiency improvements in power plantsIt is well known that the cycle efficiency is generally proportional toh 1 TLTH(3)The question that emerges is how to improve the cycle efficiency; naturallythrough lowering the heat sink temperature TL and/or raising the heat sourcetemperature TH.3.3.1 Lowering the condenser pressureSetting the steam condenser pressure is generally restricted by the temperature ofthe available condenser water (lake, river, etc.) typically around 25 C or condensersaturation pressure of around Psat 3.2 kPa.WIT Transactions on State of the Art in Science and Engineering, Vol 42, 2008 WIT Presswww.witpress.com, ISSN 1755-8336 (on-line)
Steam Power Plants105Figure 3: Lowering condenser temperature TL through decreasing condenseroperating pressure [1].The pressure at the exit of the turbine can be less than atmospheric pressure witha condenser and the closed loop of the condenser permits the use of high waterquality on the steam cycle side. However, lowering condenser pressure is notunlimited as it depends on the design condenser temperature and the limits oflower steam quality at turbine exit. In Fig. 3, the shaded area represents the gain innetwork of the system due to lowering the condenser pressure.3.3.2 Superheating the steam to high temperaturesThe average temperature at which heat is supplied in the boiler can be increasedby superheating the steam. Dry saturated steam from the boiler is passed througha second bank of smaller bore tubes within the boiler until the steam reachesthe required temperature. The value of TH, the mean temperature at whichheat is added, increases, while TL remains constant. Therefore, the efficiencyincreases.The quality of the turbine exhaust termed, x, increases, the value of steam drynessfraction at turbine exit should not be lower than about 0.9 to prevent water dropletseffects on blading efficiency, as outlined in Fig. 4. With sufficient superheating,the turbine exhaust conditions may well fall in the superheated region.3.3.3 Increasing the boiler pressureIncreasing the operating pressure of the boiler automatically raises the temperature at which boiling takes place. This consequently raises the average temperatureWIT Transactions on State of the Art in Science and Engineering, Vol 42, 2008 WIT Presswww.witpress.com, ISSN 1755-8336 (on-line)
106Thermal Engineering in Power SystemsFigure 4: Increase TH by adding superheat.Figure 5: Effect of increasing the boiler pressure.at which heat is added to the steam and thus raises the thermal efficiency of thecycle as indicated in Fig. 5.An increase in boiler pressure results in a higher TH for the same TL, thereforehigher cycle thermal efficiency η. But state 4′ indicates a lower steam qualitythan state 4, then more wet steam at the turbine exhaust is expected; this mayresult in cavitation of the turbine blades at the last low pressure stages. Consequently, the efficiency is decreased and the cost of maintenance increases.It is recommended to keep the steam quality higher than 90% at the turbineexhaust section.3.3.4 Rankine cycle with reheat1. The moisture content at the exhaust of the turbine should be no greater than10% – this can result in physical erosion of the turbine blades.WIT Transactions on State of the Art in Science and Engineering, Vol 42, 2008 WIT Presswww.witpress.com, ISSN 1755-8336 (on-line)
Steam Power Plants1072. As higher boiler pressures are required for high efficiency, this leads to a highermoisture content ratio in the low pressure turbine expansion [1].3. To improve the turbine exhaust steam conditions, the steam can be reheatedbetween two turbine expansion stages or steps as indicated in Fig. 6. The following points emerge: The temperature of the steam entering the turbine is limited by metallurgicalconstraints. Modern boilers can handle up to 30 MPa and a maximum temperature oftmax 650 C. Materials, such as ceramic blades, can handle temperatures up to 750 C.Advantages of using Rankine cycle with reheat: This arrangement provides highsteam quality or even slightly superheated vapor at turbine exit. Therefore, for agiven TH the Rankine cycle, efficiency increases without reducing the steam qualityat turbine exit.Rankine cycle with regeneration: To increase the cycle efficiency, to near theCarnot cycle efficiency, added heat QH should be at as high temperature TH as itpossibly can. Also, heat should be rejected, QL, at the lowest possible TL. In suchconfiguration, the Rankine cycle is provided with feed water heaters (FWHs) toheat the high-pressure sub-cooled water at the exit of the pump to the saturationtemperature. As shown in Fig. 7, most of the heat addition (QH) is performed athigh temperature.Feed water heaters: There are two different types of FWHs commonly used inpower plants: open FWH, where the two streams of high temperature steam andlow temperature water mix in an open heater at constant pressure; closed FWH,where a heat exchanger is used to transfer heat between the two streams but thetwo streams do not mix. The two streams can be naturally maintained at differentpressures.Figure 6: Rankine cycle with reheat.WIT Transactions on State of the Art in Science and Engineering, Vol 42, 2008 WIT Presswww.witpress.com, ISSN 1755-8336 (on-line)
108Thermal Engineering in Power SystemsFigure 7: Rankine cycle with regeneration [1].1. Open FWH: In this arrangement, the working fluid passes isentropically throughthe turbine stages and pumps. Steam enters the first stage turbine at state 1 andexpands to state 2 – where a fraction of the total flow is bled off into an openFWH at P2. The rest of the steam expands into the second stage turbine at statepoint 3. – This portion of the fluid is condensed and pumped as a saturatedliquid to the FWH at P2. A single mixed stream exits the FWH at state point 6.The mass flow rates through each of the components are typically calculated byperforming a mass balance over the turbine. A heat balance is also performed tocalculate the various enthalpies at various states.2. Closed FWH: Such configuration can be practically realized in two alternativestypically: Pump the condensate back to the high-pressure line (Fig. 8a). A steam trap is inserted in the condensed steam line that allows only liquidto pass (Fig. 8b).The incoming feed water does not mix with the extracted steam; both streamsflow separately through the heater, hence the two streams can have differentpressures.Advantages of using heat regeneration:1. It improves the cycle efficiency.2. It provides a convenient means of deaerating the feed water (removing the airthat leaks in at the condenser) to prevent corrosion in the boiler.3. It also helps to control the large volume flow rate of the steam at the final stagesof the turbine.Figure 9 shows the effect of the number of FWHs on the thermal efficiency; increasing the number of FWHs improves the thermal efficiency. This is, however, limitedby the cost and there is an optimum. Modem steam power plants often use as manyas eight FWHs. Some of these may be open FWHs, which allows for deaerating ofWIT Transactions on State of the Art in Science and Engineering, Vol 42, 2008 WIT Presswww.witpress.com, ISSN 1755-8336 (on-line)
Steam Power Plants109(a)(b)Figure 8: (a) Forward type feed water heaters; (b) cascaded type feed waterheaters.Figure 9: Effect of number of FWHs on the thermal efficiency.the feed water to prevent boiler corrosion and some are also of the closed type. Theoptimum number of FWHs is usually determined from economic considerations [1].An example of the energy balance (Sankey diagram) of a multistage steam turbine unit in operation in one of the power plants in Egypt is shown in Fig. 10. Thediagram identifies the input from the boiler and losses at the various components.WIT Transactions on State of the Art in Science and Engineering, Vol 42, 2008 WIT Presswww.witpress.com, ISSN 1755-8336 (on-line)
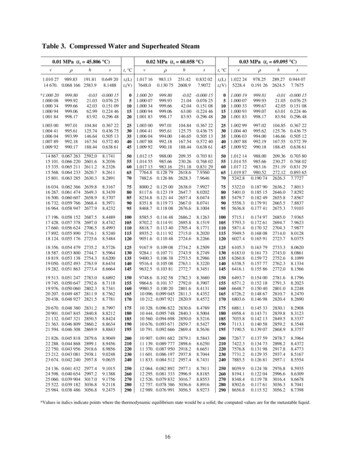
110Thermal Engineering in Power SystemsFigure 10: Power flow diagram for a 330 MW steam turbine unit.The output power is indicated as the sum of the high-, intermediate- and low-pressure stages. Heat rejected in the condenser was shown to be 393.9 MW [5].Table 1 lists the performance of a 330 MW steam turbine working in a SteamPower Plant in Cairo, Egypt. The performance indices are those of July 2007. Theaverage thermal efficiency was 37.582%. Improvements can well be implementedby co generation and reducing losses [5].4 Boiler furnace combustionIn furnaces and combustors, it is most essential to represent adequately the characteristics of heat transfer and energy balance in a mathematical model of the flowand reaction processes. This is done to enable determination of the actual heat fluxdistribution to the furnace walls and to predict the local gas temperature distribution. In real furnaces and combustors, two modes of heat transfer exist, namelyradiation and convection. A fundamental calculation of heat transfer requires thesimultaneous solution of fluid flow, chemical reaction, and energy transfer. Theinter-dependence and interaction of these processes make the problem extremelycomplex; the general approach adopted is to develop simplified models that dealwith the turbulence and the reaction characteristics. Radiative and convective heattransfer is discussed here in terms of available models, their assumptions, formation and validation in furnaces and combustion chambers.4.1 Turbulent combustion4.1.1 IntroductionTurbulent combustion modeling is an essential tool for the design of furnacesand combustors. Such models yield closure to the fuel mass fraction conservationWIT Transactions on State of the Art in Science and Engineering, Vol 42, 2008 WIT Presswww.witpress.com, ISSN 1755-8336 (on-line)
asDayJuly 1July 2July 3July 4July 5July 6July 7July 8July 9July 10July 11July 12July 13July 14July 15July 58.23514142.426715335.1392Fuel equ.power(MW 18.565846.9Powergenerated(MW 5946211.6279225.7733243.6208Averagepower 6.5776.8973.2364.7364.1368.4273.82Gen.powerfactor (%)Table 1: Steam turbine power plant performance table (300 MW, July 2007) [3].WIT Transactions on State of the Art in Science and Engineering, Vol 42, 2008 WIT Presswww.witpress.com, ISSN 1755-8336 malefficiency (%)Steam Power Plants111
WIT Transactions on State of the Art in Science and Engineering, Vol 42, 2008 WIT Presswww.witpress.com, ISSN 1755-8336 lOilJuly 17July 18July 19July 20July 21July 22July 23July 24July 25July 26July 27July 28July 29July 30July 31Average 6.842815953.623816956.858316596.887217813.0225Fuel equ.power(MW 6201.66709.62Powergenerated(MW hr)Table 1: 04248.5175263.3796258.4279.5675Averagepower 75.0577.0967.2275.3179.8178.3084.72Gen.powerfactor 59937.277637.3660437.66694Thermalefficiency (%)112Thermal Engineering in Power Systems
Steam Power Plants113equations and those relating to the progress of reaction. The turbulence – combustioninteractions and density fluctuation correlations play an important role in the adequacy of the predicted flow pattern and heat transfer [6].4.1.2 Mathematical formulationThree time averaged velocity components in X, Y, and Z coordinate directionswere obtained by solving the governing equations using a “SIMPLE numericalalgorithm” (semi-implicit method for pressure linked equation). The turbulencecharacteristics were represented by a modified and appropriately extended twoequation k – ε model [7, 8] to account for normal and shear stresses and near-wallfunctions. Fluid properties such as densities, viscosity and thermal conductivitywere obtained from references [9–13]. The present work uses the computer program 3DHVAC [7, 8]. The program solves the differential equations governing thetransport of mass, three momentum components, energy, relative humidity, and theair age in 3D configurations. The different governing partial differential equationsare typically expressed in a general form as:Div (rV Φ Γ Φ, eff grad Φ) SΦ(4)where ρ is the air density (kg/m3), Φ is the dependent variable, V is the velocityvector, ΓΦ, eff is the effective diffusion coefficient, SΦ is the source term of Φ.The effective diffusion coefficients and source terms for the various differentialequations are listed in Table 2.The solution of the governing equations can be realized through the specifications of appropriate boundary conditions. The values of velocity, temperature,kinetic energy, and its dissipation rate should be specified at all boundaries.Table 3 highlights the boundary conditions.Table 2: Coefficients and constants of the partial differential H-equationk-equationε-equationΦΓΦ, �eff0– P/ x SU– P/ y SV– P/ z SW ρgβΔtSHG – ρεC1εG/k – C2ρε2/kμ′eff μlam/σlam μt/σΦ and for momentum μeff μlam μtμt ρCμk2/εG μ[2{( U/ x)2 ( V/ y)2 ( W/ z)2} ( U/ y V/ x)2 ( V/ z W/ y)2 ( U/ z W/ x)2]C1 1.44, C2 1.92, Cμ 0.09.σlam 0.7, σH 0.9, σk 1.0, σε 1.3, for other equations σΦ 0.7.WIT Transactions on State of the Art in Science and Engineering, Vol 42, 2008 WIT Presswww.witpress.com, ISSN 1755-8336 (on-line)
114Thermal Engineering in Power SystemsTable 3: Boundary conditions.WallsA non-slip condition at all solid walls is applied to thevelocities. The logarithmic law of the wall (wall function)was used here, for the near wall boundary layer.Supply outletsAt inlets, the air velocity was assumed to have a uniformdistribution; inlet values of the temperature were assumed tobe of a constant value and uniform distribution. The kineticenergy of turbulence and its dissipation rate are commonlyestimated as follows:kin 3(0.5(IinUin)2), εini Cμ(kin)1.5/le,where Iin is the intensity of disturbance at air inlet and le isthe dissipation length at air inlet.Initial valuesAll velocity components were set as zeros initially, andtemperatures were assumed to be equal to the steady statevalue of the comfort condition. The kinetic energy and itsdissipation are estimated as follows:kinitial 11 10–5, ε initial Cμ(kinitial)1.5/cd,where c is a constant and d is the distance to nearest sidewall.4.2 Combustion modelsA total of 11 combustion models have been used together with equations for U, V,W, k, and ε. They are summarized on the following panels and their relative meritsidentified. All models require the solution of equations, of the general form (4).Here Φ H and f, whereH Mfu H fu Mi C p a Ta 21 (U 2 V 2 W 2 )(5)andf f1/f2f1 [Mfu – (Mox/i)] – [Mfu – (Mox/i)]air streamf2 [Mfu – (Mox/i)]fuel stream – [Mfu – (Mox/i)]air streamwhere i is the stoichiometric ratio; Mfu is the fuel mass fraction; Mox is the oxidant mass fraction; U, V, W are the mean velocity components in the X, Y, and Zcoordinate directions; Cpa is the specific heat at constant pressure of the species; Tais the mean temperature of species.4.2.1 Fast chemical reactions models4.2.1.1 Combustion model 11. Fuel and oxidant do not coexist at same place at any time, reaction rate is infinitely fast, equilibrium is attained [1, 2].WIT Transactions on State of the Art in Science and Engineering, Vol 42, 2008 WIT Presswww
Department of Mechanical Power Engineering, Cairo University, Cairo, Egypt. Abstract The effi cient utilization of fossil energy in power generation together with low pollution in conventional thermal power plants is a topic that is gaining interest internationally. The energy availability and sustainability scenario is an area of