Transcription
2020EXPANSION SAASBENCHMARKSSEAN FANNING & KYLE POYARView the interactive report at saasbenchmarks.com
TABLE OF rketInsights6ProductLed GrowthInsightsOV 2020 EXPANSION SAAS BENCHMARKS3ExecutiveSummary4EnterpriseSoftware isRecessionProof7Financial &OperatingInsights8TalentInsightsProprietary 2020 OpenView Advisors, LLC. All Rights Reserved2
INTRODUCTIONObjective data is critical to making the rightData from our 2020 survey answered the burningstrategic decisions that can propel your long-termquestion on everyone’s mind: “What was thegrowth. For this reason, we’re releasing the resultsimpact of COVID on enterprise software?” Theof our fourth annual Expansion SaaS Benchmarksanswer: enterprise software is recessionsurvey. This report was designed specifically toproof.enable operators to compare themselves againsttheir exact peers across the metrics that matter mostin a SaaS business. This year’s survey was live fromJune to September. This 2020 benchmark reportincorporates data from more than 1200respondents aggregated across prior surveys aswell as more than 400 this year alone.OV 2020 EXPANSION SAAS BENCHMARKSThis year’s benchmarks report also explores topicsincluding executive diversity and founder attitudes,in addition to our usual insights on product ledgrowth, go-to-market, and other data key tooperating and growing a successful expansionstage software business.Proprietary 2020 OpenView Advisors, LLC. All Rights Reserved3
THANKS TO OUR SURVEY PARTNERSOV 2020 EXPANSION SAAS BENCHMARKSProprietary 2020 OpenView Advisors, LLC. All Rights Reserved4
PARTICIPANTOVERVIEW
DISTRIBUTION BY ARRDISTRIBUTION BY GEOGRAPHY10%12%21%7%12%5%46%15%15%30%27% 1M 1-2.5M 2.5-10M 10-20M 20-50M 50MUSEuropeCanadaAPACOtherSource: 2020 OpenView SaaS Metrics Survey, N 409.OV 2020 EXPANSION SAAS BENCHMARKSProprietary 2020 OpenView Advisors, LLC. All Rights Reserved6
DISTRIBUTION BYRESPONDENT ROLEDISTRIBUTION BYTA R G E T C U S T O M E R S I Z E2%9%16%35%4%38%21%10%3%33%29%CEO / Founder / Co-FounderCFO / VP FinanceConsumerVery small business(VSB, 20 employees)Midmarket (101-1,000 employees)CMO / VP Marketi ngCOO / VP of OperationsSMB (20-100 employees)CRO / VP of SalesOtherEnterprise ( 1,000 employees)Source: 2020 OpenView SaaS Metrics Survey, N 409.OV 2020 EXPANSION SAAS BENCHMARKSProprietary 2020 OpenView Advisors, LLC. All Rights Reserved7
EXECUTIVESUMMARY
COMPANY PERFORMANCE BENCHMARKSSI ZE AND GROWTHEmpl oyeesNumber of full-time equivalent employees at the end of Q2 2020.Fundi ngAmount of equity capital raised to date.Annual Recurri ng Revenue ( ARR)Company annual recurring revenue (ARR) scale at the end of Q2 2020.YoY Growt h Rat eChange in annual recurring revenue at the end of Q2 2020 vs. Q2 2019.FINANCIALSal es & Mark et i ng SpendSpending on sales & marketing, including headcount, as a % of ending ARR as of Q2 2020.R&D SpendSpending on R&D, including headcount, as a % of ending ARR as of Q2 2020.Gros s Margi nsSubscription revenue less cost of goods sold divided by subscription revenue at the end of Q2 2020.Mont hl y Burn Rat e ( i n 000’ s )Net monthly operating cash burn rate at the end of Q2 2020 (total lost each month, negative values profit).SAAS VALUE DRIVERSCAC Payback ( mont hs )Months of subscription gross margin to recover the fully loaded cost of acquiring a customer.Gros s Dol l ar Ret ent i onAnnual gross dollar retention (after churn, exclusive of upsells & expansion) seen in cohorts.Net Dol l ar Ret ent i onAnnual net dollar retention (after churn, inclusive of upsells & expansion) seen in cohorts.DIVERSITYWomen i n Leaders hi p% of female representation among employees Director-level and above.Underrepres ent ed Mi nori t i es i n Leaders hi p% of underrepresented minority representation among employees Director-level and above.OV 2020 EXPANSION SAAS BENCHMARKSProprietary 2020 OpenView Advisors, LLC. All Rights Reserved9
HOW TO READ THESE SLIDES 1M 1-2.5M 2.5M-10M 10-20M 20-50M 50M10 (5-19)25 (18-40)52 (33-82)93 (75-161)220 (135-300)495 (249-1054)100% (12-177%)60% (31-100%)41% (22-84%)46% (25-71%)50% (18-75%)21% (14-40%)Sal es & Mark et i ng Spend20% (13-37%)30% (21-41%)30% (20-41%)35% (19-56%)31% (20-40%)29% (10-46%)R&D Spend68% (33-80%)40% (30-60%)32% (22-45%)28% (20-40%)27% (10-32%)22% (10-30%)Gros s Margi ns67% (23-80%)Rowsrepresent78%commonacross75% (56-85%)(70-85%) KPIs79%(66-84%)79% (72-84%)75% (63-79%)Mont hl y Burn Rat e ( i n 000s ) 50 ( 0-175) 50 ( 0-175) 175 ( 0-375)( 0-500)categoriesincludingsize and 200growth, 375 ( 13-1,719)[N/A]SI ZE AND GROWTHEmpl oyeesYoY Growt h Rat eFINANCIALfinancial, value drivers, and diversitySAAS VALUE DRIVERSCAC Payback ( mont hs )8 (3-11)10 (5-15)11 (8-15)11 (11-15)15 (11-30)15 (11-21)Gros s Dol l ar Ret ent i on90% (55-95%)90% (59-95%)90% (85-97%)87% (80-93%)87% (80-95%)90% (86-95%)99% (70-110%)100% (82-105%)103% (92-111%)102% (92-110%)Women i n Leaders hi p10% (0-33%)20% (3-49%)25% (19-34%)29% (13-40%)20% (10-30%)15% (10-20%)Underrepres ent ed Mi nori t i es i n Leaders hi p10% (0-25%)0% (0-0%)0% (0-20%)0% (0-25%)0% (0-20%)0% (0-20%)Net Dol l ar Ret ent i on105% (97-113%) 105% (96-111%)DIVERSITYSource: 2020 OpenView SaaS Metrics Survey, N 409.OV 2020 EXPANSION SAAS BENCHMARKSProprietary 2020 OpenView Advisors, LLC. All Rights Reserved10
HOW TO READ THESE SLIDES 1M 1-2.5M 2.5M-10M 10-20M 20-50M 50M10 (5-19)25 (18-40)52 (33-82)93 (75-161)220 (135-300)495 (249-1054)100% (12-177%)60% (31-100%)41% (22-84%)46% (25-71%)50% (18-75%)21% (14-40%)31% (20-40%)29% (10-46%)SI ZE AND GROWTHEmpl oyeesYoY Growt h Rat eFINANCIALSal es & Mark et i ng Spend20% (13-37%)30% (21-41%)30%(20-41%)Columnsrepresent35% (19-56%) ofdistributionR&D Spend68% (33-80%)40% (30-60%)32% (22-45%)28% (20-40%)27% (10-32%)22% (10-30%)Gros s Margi ns67% (23-80%)75% (56-85%)78% (70-85%)79% (66-84%)79% (72-84%)75% (63-79%)Mont hl y Burn Rat e ( i n 000s ) 50 ( 0-175)responses from companies at varyinglevels 175of ARR,from 200 1Mto 50M 50 ( 0-175)( 0-375)( 0-500) 375 ( 13-1,719)[N/A]SAAS VALUE DRIVERSCAC Payback ( mont hs )8 (3-11)10 (5-15)11 (8-15)11 (11-15)15 (11-30)15 (11-21)Gros s Dol l ar Ret ent i on90% (55-95%)90% (59-95%)90% (85-97%)87% (80-93%)87% (80-95%)90% (86-95%)99% (70-110%)100% (82-105%)103% (92-111%)102% (92-110%)Women i n Leaders hi p10% (0-33%)20% (3-49%)25% (19-34%)29% (13-40%)20% (10-30%)15% (10-20%)Underrepres ent ed Mi nori t i es i n Leaders hi p10% (0-25%)0% (0-0%)0% (0-20%)0% (0-25%)0% (0-20%)0% (0-20%)Net Dol l ar Ret ent i on105% (97-113%) 105% (96-111%)DIVERSITYSource: 2020 OpenView SaaS Metrics Survey, N 409.OV 2020 EXPANSION SAAS BENCHMARKSProprietary 2020 OpenView Advisors, LLC. All Rights Reserved11
HOW TO READ THESE SLIDES 1M 1-2.5M 2.5M-10M 10-20M 20-50M 50M10 (5-19)25 (18-40)52 (33-82)93 (75-161)220 (135-300)495 (249-1054)100% (12-177%)60% (31-100%)41% (22-84%)46% (25-71%)50% (18-75%)21% (14-40%)Sal es & Mark et i ng Spend20% (13-37%)30% (21-41%)30% (20-41%)35% (19-56%)31% (20-40%)29% (10-46%)R&D Spend68% (33-80%)40% (30-60%)32% (22-45%)28% (20-40%)27% (10-32%)22% (10-30%)Gros s Margi ns67% (23-80%)75% (56-85%)79% (72-84%)75% (63-79%)Mont hl y Burn Rat e ( i n 000s ) 50 ( 0-175)78% (70-85%)79% (66-84%)Each cell representsthe median 50 ( 0-175) 375 ( 13-1,719)[N/A]SI ZE AND GROWTHEmpl oyeesYoY Growt h Rat eFINANCIALSAAS VALUE DRIVERSCAC Payback ( mont hs )8 (3-11)Gros s Dol l ar Ret ent i on90% (55-95%) 175 ( 0-375) 200 ( 0-500)performance of a company, as well astherange (bottomquartile –11topquartile)15of10 (5-15)11 (8-15)(11-15)(11-30)90%(59-95%)(85-97%)87% (80-93%)eachmetric 90%at eachrespectiveARR87% (80-95%)scale15 (11-21)90% (86-95%)99% (70-110%)100% (82-105%)103% (92-111%)102% (92-110%)Women i n Leaders hi p10% (0-33%)20% (3-49%)25% (19-34%)29% (13-40%)20% (10-30%)15% (10-20%)Underrepres ent ed Mi nori t i es i n Leaders hi p10% (0-25%)0% (0-0%)0% (0-20%)0% (0-25%)0% (0-20%)0% (0-20%)Net Dol l ar Ret ent i on105% (97-113%) 105% (96-111%)DIVERSITYSource: 2020 OpenView SaaS Metrics Survey, N 409.OV 2020 EXPANSION SAAS BENCHMARKSProprietary 2020 OpenView Advisors, LLC. All Rights Reserved12
SAAS METRICS BY ARR 1M 1-2.5M 2.5M-10M 10-20M 20-50M 50M10 (5-19)25 (18-40)52 (33-82)93 (75-161)220 (135-300)495 (249-1054)100% (12-177%)60% (31-100%)41% (22-84%)46% (25-71%)50% (18-75%)21% (14-40%)Sal es & Mark et i ng Spend20% (13-37%)30% (21-41%)30% (20-41%)35% (19-56%)31% (20-40%)29% (10-46%)R&D Spend68% (33-80%)40% (30-60%)32% (22-45%)28% (20-40%)27% (10-32%)22% (10-30%)Gros s Margi ns67% (23-80%)75% (56-85%)78% (70-85%)79% (66-84%)79% (72-84%)75% (63-79%)Mont hl y Burn Rat e ( i n 000s ) 50 ( 0-175) 50 ( 0-175) 175 ( 0-375) 200 ( 0-500) 375 ( 13-1,719) 0 ( 0-375)CAC Payback ( mont hs )8 (3-11)10 (5-15)11 (8-15)11 (11-15)15 (11-30)15 (11-21)Gros s Dol l ar Ret ent i on90% (55-95%)90% (59-95%)90% (85-97%)87% (80-93%)87% (80-95%)90% (86-95%)99% (70-110%)100% (82-105%)103% (92-111%)102% (92-110%)Women i n Leaders hi p10% (0-33%)20% (3-49%)25% (19-34%)29% (13-40%)20% (10-30%)15% (10-20%)Underrepres ent ed Mi nori t i es i n Leaders hi p10% (0-25%)0% (0-0%)0% (0-20%)0% (0-25%)0% (0-20%)0% (0-20%)SI ZE AND GROWTHEmpl oyeesYoY Growt h Rat eFINANCIALSAAS VALUE DRIVERSNet Dol l ar Ret ent i on105% (97-113%) 105% (96-111%)DIVERSITYSource: 2020 OpenView SaaS Metrics Survey, N 409.OV 2020 EXPANSION SAAS BENCHMARKSProprietary 2020 OpenView Advisors, LLC. All Rights Reserved13
SAAS METRICS BY ARR (2020 vs. 2019) 1M 1-2.5M 2.5M-10M 10-20M 20-50M 50M10 ( 2)25 (0)52 ( 5)93 ( 7)220 ( 40)495 ( 60)100% ( 20%)60% ( 20%)41% ( 9%)46% ( 4%)50% ( 10%)21% ( 8%)Sal es & Mark et i ng Spend20% ( 10%)30% (0%)30% ( 5%)35% ( 5%)31% ( 11%)29% ( 9%)R&D Spend68% ( 18%)40% ( 8%)32% ( 2%)28% ( 2%)27% ( 3%)22% ( 2%)67% ( 3%)75% ( 2%)78% ( 2%)79% ( 4%)79% ( 4%)75% (0%) 50 ( 0) 50 ( 0) 175 ( 0) 200 ( 175) 375 ( 0) 0 ( 50)CAC Payback ( mont hs )8 ( 3)10 ( 2)11 (0)11 ( 4)15 (0)15 (0)Gros s Dol l ar Ret ent i on90% (0%)90% (0%)90% (0%)87% ( 1%)87% ( 2%)90% ( 2%)99% ( 1%)100% (0%)103% ( 3%)102% ( 7%)105% ( 3%)105% ( 8%)Women i n Leaders hi p10% (0%)20% (-5%)25% ( 5%)29% ( 4%)20% (-5%)15% (-14%)Underrepres ent ed Mi nori t i es i n Leaders hi p10% (N/A)0% (N/A)0% (N/A)0% (N/A)0% (N/A)0% (N/A)SI ZE AND GROWTHEmpl oyeesYoY Growt h Rat eFINANCIALGros s Margi nsMont hl y Burn Rat e ( i n 000s )SAAS VALUE DRIVERSNet Dol l ar Ret ent i onDIVERSITYSource: 2020 OpenView SaaS Metrics Survey, N 409.OV 2020 EXPANSION SAAS BENCHMARKSProprietary 2020 OpenView Advisors, LLC. All Rights Reserved14
SAAS METRICS BY MOST RECENT FUNDINGAngel / SeedS e r ie s AS e r ie s BS e r ie s CS e r ie s D 16 (8-27)46 (25-88)109 (53-195)120 (74-196)272 (173-557)Fundi ng 3M ( 0.5-3M) 8M ( 8-15M) 28M ( 15-43M) 43M ( 28 -63M) 88M ( 43-100M)Annual Recurri ng Revenue ( ARR) 2M ( 0.5-2M) 6M ( 2-6M) 15M ( 6-15M) 15M ( 6-35M) 50M ( 35-50M)YoY Growt h Rat e60% (26-100%)60% (30-105%)44% (27-74%)35% (14-64%)27% (19-50%)Sal es & Mark et i ng Spend25% (13-40%)30% (20-44%)40% (26-60%)31% (20-43%)37% (20-47%)R&D Spend50% (30-80%)30% (20-50%)30% (23-44%)29% (15-35%)29% (12-40%)Gros s Margi ns76% (40-85%)75% (62-86%)75% (67-85%)75% (63-81%)78% (73-81%)Mont hl y Burn Rat e ( i n 000s ) 50 ( 0-175) 175 ( 50-375) 375 ( 50-625) 375 ( 50-750) 375 ( 0-1,531)CAC Payback ( mont hs )8 (5-14)11 (8-15)15 (11-15)13 (11-21)15 (11-28)Gros s Dol l ar Ret ent i on90% (78-95%)90% (76-96%)90% (80-96%)86% (79-90%)90% (83-96%)100% (87-110%)103% (91-113%)103 (98-112%)103% (92-110%)105% (96-113%)Women i n Leaders hi p23% (0-38%)22% (6-38%)25% (15-40%)28% (11-36%)16% (10-36%)Underrepres ent ed Mi nori t i es i n Leaders hi p0% (0-29%)0% (0-15%)1% (0-10%)3% (0-15%)6% (0-20%)SI ZE AND GROWTHEmpl oyeesFINANCIALSAAS VALUE DRIVERSNet Dol l ar Ret ent i onDIVERSITYSource: 2020 OpenView SaaS Metrics Survey, N 409.OV 2020 EXPANSION SAAS BENCHMARKSProprietary 2020 OpenView Advisors, LLC. All Rights Reserved15
ENTERPRISESOFTWAREIS RECESSIONPROOF
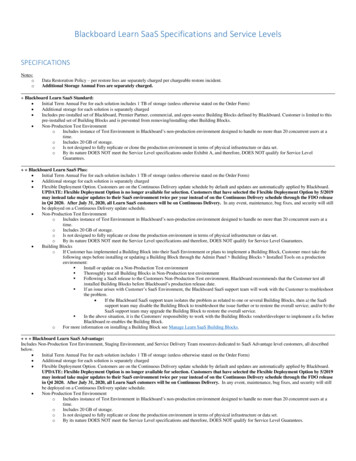
ENTERPRISE SOFTWARE IS RECESSION PROOF% Change in IndexPublic SaaS is more valuable than everbefore – after falling nearly 50% from200%all-time-highs in March, SaaS valuationsSaaS150%have rallied on the back of persistentNASDAQlong-term tailwinds. Plus, as investorsS&Pmature in their evaluation of B2Bmarkets, unit economics & defensibility,100%the future price uncertainty of the assetsseems to be reduced. These factorshave created exuberance in the50%market.Despite the uncertainty of the COVID-0%induced economic recession enterprise-50%software is largely proving to be1/1/2010/30/20recession proof as enterprise digitaltransformations continue.Source: Pitchbook as of 9/10/2020. SaaS index multiples calculated as enterprise value / revenue and representmedian value as of each date for the 70 public SaaS companies OpenView tracks.OV 2020 EXPANSION SAAS BENCHMARKSProprietary 2020ProprietaryOpenView 2020 OAdvisors,penView Advisors,LLC. AllLLC.RightsAll RightsReservedReserved1717
PUBLIC MARKET DEMAND FOR SAAS REMAINS ROBUSTInvestor demand for public softwareIPO Dataequities remains incredibly strong.IPOs2018CapitalTTM Financials (per S-1)CountAge @IPORaisedRevenueGrowth1612.2 300.8 168.139.2%Gross Net DollarMargin Retention71.2%And the companies that are goingCACPayback115%30.0months131%19.2monthspublic in 2020 are extremelyimpressive. They’re largely growingfaster and sustaining high growthlonger, growing more efficiently,raising less capital at scale, and getting20192020121111.312.9 220.0 283.5 250.3 155.157.7%51.0%74.9%76.6%120%18.5monthsto be on average older compared toprevious IPO cohorts.These summary data are even moreimpressive when you exclude outlierslike Zoom in 2019 and Snowflake in2020.Source: Pitchbook as of 9/10/2020OV 2020 EXPANSION SAAS BENCHMARKSProprietary 2020ProprietaryOpenView 2020 OAdvisors,penView Advisors,LLC. AllLLC.RightsAll RightsReservedReserved1818
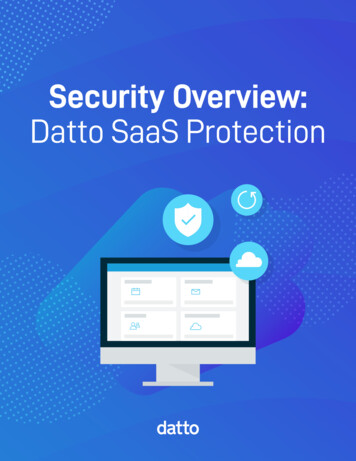
CUSTOMER DEMAND FOR SAAS REMAINS STRONG% Impact from COVID on Expected Budget2%Enterprise SaaS has been recessionproof and the buying environment7%for software remains robust. Roughly21% 2/5 of respondents to our 2020survey reported less than a 10%18%decrease in expected 2020 ARR18%while 1/5 of respondents saw noimpact to budget at all.34%Even after aggressive expense cutsand revenue reforecasts manyNo impact / positive impact 0 to -9% impactcompanies maintained aggressive-10 to -24% impact-25 to -49% impact-50 to -99% impactN/A / impact is unknowntopline revenue targets.Source: 2020 OpenView SaaS Metrics Survey, N 409.OV 2020 EXPANSION SAAS BENCHMARKSProprietary 2020ProprietaryOpenView 2020 OAdvisors,penView Advisors,LLC. AllLLC.RightsAll RightsReservedReserved1919
SO, IT’S TIME FOR COMPANIES TO HIT THE GAS AGAINCompanies reacted aggressively to COVID,Historical SaaS Benchmarks by Year* (Median)but our data suggests companies areacquiring and retaining their customers asGrowth Rate20182019202054%48%43%efficiently as ever. They’re just not spendingnearly enough on acquisition to reachthose customers (sales & marketingexpense fell 14% YoY) who havedemonstrated they still want to invest inNet Dollar Retention100%99%102%digital transformation! As a result, mediangrowth rates have dropped from 2019.Payback Period12 months11 months11 monthsThe buying environment remainsstrong, so it is time to get back toR&D Spend as % of Revenue30%30%30%acquiring customers or get leftbehind!Sales & Marketing Spend as %of Revenue40%35%30%Source: 2020 OpenView SaaS Metrics Survey, N 409.Note*: Excludes companies 1M ARR.OV 2020 EXPANSION SAAS BENCHMARKSProprietary 2020ProprietaryOpenView 2020 OAdvisors,penView Advisors,LLC. AllLLC.RightsAll RightsReservedReserved2020
GO-TO-MARKETINSIGHTS
GROWTH RATE BY COMPANY ARRGrowth rate is highly correlated withGrowth Rate (Annual)MedianTop Quartile2019 Median200%SaaS valuations. Software companiesgrow rapidly in their early stages – atypical company doubles YoY and a175%top quartile company nearly triples.150%Except for at the very earliest stages,125%growth rates have fallen vs. 2019 but100%as noted, growth (likely) didn’t slow asa result of stunted customer demand75%except in the hardest hit industries (i.e.50%hospitality and retail). Rather,companies lost their confidence25%0%investing in revenue generating 1M 1-2.5M 2.5-10M 10-20M 20-50M 50Mactivities.ARR ScaleSource: 2020 OpenView SaaS Metrics Survey, N 409.OV 2020 EXPANSION SAAS BENCHMARKSProprietary 2020 OpenView Advisors, LLC. All Rights Reserved22
SALES AND MARKETING SPEND BY ARRSales and marketing expensesSales and Marketing Spend (% of ARR)Bottom QuartileMedianTop Quartile2019 Medianare normally a SaaS company’slargest areas of spend after they60%hit 2.5M of ARR (before which50%point product & engineering40%dominates).30%20%10%0% 1M 1-2.5M 2.5-10M 10-20M 20-50M 50MARR ScaleSource: 2020 OpenView SaaS Metrics Survey, N 409.OV 2020 EXPANSION SAAS BENCHMARKSProprietary 2020 OpenView Advisors, LLC. All Rights Reserved23
SALES AND MARKETING SPEND BYDOMINANT SALES CHANNEL*Best-in-class companies sellingSales and Marketing Spend (% of ARR)Bottom QuartileMedianTop Quartile60%primarily through self serviceand freemium can bring salesand marketing spend well50%below 20% of ARR.40%30%As you look to reach your20%customers where they work, you10%need to reach them where they0%live. Leveraging an “alwaysSelf ServeInsideFi eldIndirectDominant Sales Channelopen” self serve model candrive more efficient acquisition.Source: 2020 OpenView SaaS Metrics Survey, N 409.Note*: Dominant sales channel is sales channel with greatest ARR contribution per accountOV 2020 EXPANSION SAAS BENCHMARKSProprietary 2020 OpenView Advisors, LLC. All Rights Reserved24
DOMINANT SALES CHANNEL* BYCUSTOMER TYPEInside sales is the most popularSales Channel Mix (% of ARR)sales channel in SaaS and is24%11%14%13%sizes, even very small18%32%13%53%50%supported by your average deal50%33%9%VSBSMBSelf Servebusinesses.Make sure sales channels are62%13%used to reach customers of all4%MidmarketInsideFi eldSource: 2020 OpenView SaaS Metrics Survey, N 409.size (do you make enough topay competitive salesEnterpriseIndirectcommissions?) and how yourcustomers prefer to buy.Target Customer TypeNote*: Dominant sales channel is sales channel with greatest ARR contribution per accountOV 2020 EXPANSION SAAS BENCHMARKSProprietary 2020 OpenView Advisors, LLC. All Rights Reserved25
MONTHS TO RECOVER CAC (CAC PAYBACK)CAC payback lengthens whenCAC Payback in Months *Top QuartileMedianBottom Quartile2019 Mediancompanies achieve greater ARR scale35– watch out for worsening your go-to-30encouraged by this year’s CACmarket efficiency as you grow. We’repayback data, which suggests25companies have adapted messaging20and are still reaching their customerseffectively.15In our opinion, companies are still10under-reporting their true CAC Payback50period. Be sure your payback is fully 1-2.5M 2.5-10M 10-20M 20-50MSource: 2020 OpenView SaaS Metrics Survey, N 409. 50Mloaded (including overhead like rent)and that it is gross margin affected.ARR ScaleNote*: Excluded companies 1M ARR because they don’t have enough data for predictable CAC payback.OV 2020 EXPANSION SAAS BENCHMARKSProprietary 2020 OpenView Advisors, LLC. All Rights Reserved26
PRODUCT LEDGROWTHINSIGHTS
WHAT IS PRODUCT LED GROWTH?Product led growth (PLG) is an end user-focused growth modelthat relies on the product itself as the primary driver of customeracquisition, conversion and expansion.PLG is employed by many of the fastest growing softwarecompanies including standout public companies.OV 2020 EXPANSION SAAS BENCHMARKSProprietary 2020 OpenView Advisors, LLC. All Rights Reserved28
PRODUCT LED GROWTH IS YOURSECRET WEAPONOV 2020 EXPANSION SAAS BENCHMARKSProprietary 2020 OpenView Advisors, LLC. All Rights Reserved29
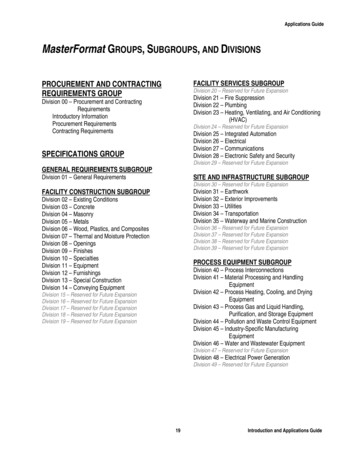
NOT ALL ENTERPRISE SAAS ISCREATED EQUAL; THE CASE FOR PLG% Change in IndexProduct-led companies are300%always “open for business”, andPLG250%their lower entry prices are lessSaaSsusceptible to budget cuts. In200%fact, the SaaS companies in our150%PLG Index trade at a nearly 50%100%premium to the broader SaaSindex, proving that product led50%revenue is more valuable.0%-50%1/1/2010/30/20Source: Pitchbook as of 9/10/2020. SaaS index multiples calculated as enterprise value / revenue and represent medianvalue as of each date for the 70 public SaaS companies OpenView tracks.OV 2020 EXPANSION SAAS BENCHMARKSProprietary 2020 OpenView Advisors, LLC. All Rights Reserved30
ADOPTION OF PRODUCT LEDGROWTH STRATEGIESDespite our best efforts at evangelizingPLGCompaniesAllCompaniesFree trial offering90%46%In-product onboarding71%29%Product analytics for decision making69%32%Self-service buying experience67%26%Bottoms-up sales67%38%Dedicated growth resources (FTEs)53%28%organizations – from sales, marketing,Freemium offering52%25%around product led growth strategies.Product Qualified Leads47%19%PLG, most companies are stillexperimenting, but relatively few havegone ‘all in’ (just 27% of respondentsreport PLG being fundamental to theirbusiness).Free trials remain the most popularproduct led growth strategy, but a freetrial is not enough to be PLG –companies need to rally their entireproduct, engineering and success –Source: 2020 OpenView SaaS Metrics Survey, N 409. PLG Companies defined as those leveraging more than three of the PLGstrategies surveyed.OV 2020 EXPANSION SAAS BENCHMARKSProprietary 2020 OpenView Advisors, LLC. All Rights Reserved31
PRODUCT LED GROWTH BYTARGET CUSTOMER SEGMENT% of respondentsPLGNon-PLGProduct led growth is especiallyprevalent among companiestargeting VSB/SMB customers.58%63%66%73%That said, 3 in 10 companiestargeting large enterprises alsoemploy PLG tactics – PLG is forthe enterprise, too.42%VSB37%34%SMBMidmarket27%EnterpriseTarget SegmentSource: 2020 OpenView SaaS Metrics Survey, N 409. PLG Companies defined as those leveraging more than three of the PLGstrategies surveyed.OV 2020 EXPANSION SAAS BENCHMARKSProprietary 2020 OpenView Advisors, LLC. All Rights Reserved32
PRODUCT LED GROWTH ACVsBY ARR SCALE% of respondents15%11% 25k 100kPLG companies land with a lowerCAC at more digestible ACVs to14%36%85% 25-100k7%start, but can drive significant25%43%expansion in accounts over time as45%13%89%large organizations.22%50%50%the product spreads throughoutThese companies can be much lessspecific in their ideal customer62%profile as they search for product33%market fit, and over time target highvalue customers specifically and 1M 1-2.5M 2.5-10M 10-20M 20-50M 50Mmore efficiently.Source: 2020 OpenView SaaS Metrics Survey, N 409. PLG Companies defined as those leveraging more than three of the PLGstrategies surveyed.OV 2020 EXPANSION SAAS BENCHMARKSProprietary 2020 OpenView Advisors, LLC. All Rights Reserved33
PRODUCT LED BUSINESSESGROW FASTER AT SCALEPLG companies grow slowly in theMedian Growth RatePLGNon-PLG120%very early days, as it takes time tobuild a community of free users andconvert those users to paying100%customers.80%After 10M in ARR, the magic of60%PLG kicks in and these companiescan scale faster. They aren’t as40%limited by their ability to hire,onboard and feed leads to20%0%enterprise sales reps and they’ve 1M 1-2.5M 2.5-10M 10-20M 20-50M 50MARR Scalebuilt up significant goodwill fromtheir users.Source: 2020 OpenView SaaS Metrics Survey, N 409. PLG Companies defined as those leveraging more than three of the PLGstrategies surveyed.OV 2020 EXPANSION SAAS BENCHMARKSProprietary 2020 OpenView Advisors, LLC. All Rights Reserved34
FINANCIAL &OPERATINGINSIGHTS
GROSS MARGIN ON SUBSCRIPTION REVENUEGross Margin on Subscription Revenue DistributionGross margin is a key and oftenoverlooked lever in any business10%15%– 7/10 companies surveyedhave gross margins in excess of11%70%. Best-in-class companies14%across all ARR scales see grossmargins of at least 80%.19%As a reminder, gross margin16%should always include hosting,15% 50%50 to 70%70 to 75%75 to 80%as well as any services and80 to 85%85 to 90% 90%customer onboarding costs.Source: 2020 OpenView SaaS Metrics Survey, N 409.OV 2020 EXPANSION SAAS BENCHMARKSProprietary 2020 OpenView Advisors, LLC. All Rights Reserved36
GROSS DOLLAR RETENTION RATESGross Dollar Retention Rates (Annual)Top tier gross retention rates areconsistent ( 85-90%) regardless12%of last round or ARR scale.4%Similarly, these rates are6%consistent regardless of bull orbear market conditions. Across53%all segments, GDR was within 25%2% from 2019 to 2020. 90% Gross dollar retention is now“table stakes” in enterprise 60%60 to 70%70 to 80%80 to 90% 90%SaaS.Source: 2020 OpenView SaaS Metrics Survey, N 409.OV 2020 EXPANSION SAAS BENCHMARKSProprietary 2020 OpenView Advisors, LLC. All Rights Reserved37
NET DOLLAR RETENTION RATESNet Dollar Retention Rates (Annual)2 in 5 companies surveyedreported net dollar retention6%6%17%over 105% and 1 in 10reported NDR over 125%.7%Net dollar retention tells the11%whole story about what is23%happening within your customer11%base and should be tracked atthe cohort level to visualize19%trends over time. 85%85 to 95%95 to 100%100 to 105%105 to 115%115 to 125%125 to 135% 135%Source: 2020 OpenView SaaS Metrics Survey, N 409.OV 2020 EXPANSION SAAS BENCHMARKSProprietary 2020 OpenView Advisors, LLC. All Rights Reserved38
NET RETENTION BY TARGET CUSTOMER TYPERegardless of segment, aNet Dollar Retention Rates (Annual)Bottom QuartileMedianTop Quartile120%competitive NDR rate liesbetween 100% and 110%.110%However, VSB and SMB100%segments introduce greater90%variance. As SMBs becomesmaller and smaller, net80%retention can start to mimic B2C70%60%software.VSBSMBSource: 2020 OpenView SaaS Metrics Survey, N 409.OV 2020 EXPANSION SAAS BENCHMARKSMidmarketEnterpriseTarget Customer TypeProprietary 2020 OpenView Advisors, LLC. All Rights Reserved39
EQUITY CAPITAL RAISED BY ARR*With the rise of VC growth funds,ARR Scale 1M79% 1-2.5M14%48% 2.5-10M36%30% 10-20M7% 20-50M6% 50M0%8%10%23%17%9%29%57% 5M2%10% 5-10MSource: 2020 OpenView SaaS Metrics Survey, N 409. 10-20Mbreaking VC fund sizes as wellas PE firms diversifying strategiesin order to deploy capital,companies have access to moreand more cash.Even more modest companies58%40%mega-rounds and record-24%25%20%3% 3%16%71%8%7%60% 20-50M80%100% 50MEquity Capital Raised( 10- 20M ARR) can raise largeamounts of equity capital ( 2/3have raised 20M)Note*: Excludes companies that haven’t raised capitalOV 2020 EXPANSION SAAS BENCHMARKSProprietary 2020 OpenView Advisors, LLC. All Rights Reserved40
MONTHLY CASH BURNMonthly Cash Burn ( 000’s)2020 Median2019 Median 400Burn was subject to two forces.Companies’ responses to COVIDwould intuitively decrease burn. 350Large amounts of investor 300capital would intuitively raise it. 250As both customer and investor 200demand for software assets 150remains strong, burn remained 100consistent with last year’s report. 50 0 1M 1-2.5M 2.5-10M 10-20MSource: 2020 OpenView SaaS Metrics Survey, N 409. 0 burn implies breakeven or profitable.OV 2020 EXPANSION SAAS BENCHMARKS 20-50M 50MARR ScaleProprietary 2020 OpenView Advisors, LLC. All Rights Reserved41
TALENTINSIGHTS
NUMBER OF EMPLOYEES BY ARR SCALEIn the early stages, companiesNumber of EmployeesBottom QuartileMedianTop Quartilehave one employee for every 100,000 in ARR. As companies1200scale to 20M, that figure jumps1000to 150,000. Best-in-class is 200,000 .800600On average, 35% of employees400are in Engineering and another20020% are in Sales. The next0largest functions are Product 1M 1-2.5M 2.5-10M 10-20M 20-50M 50MARR Scale(12%) and Customer Success(11%).Source: 2020 OpenView SaaS Metrics Survey, N 409.OV 2020 EXPANSION SAAS BENCHMARKSProprietary 2020 OpenView Advisors, LLC. All Rights Reserved43
MIX OF EMPLOYEES BY FUNCTION, BYARR SCALEAt the early stages, most startupARR Scaleemployees are in Product & 1M 1-2.5M 2.5-10M45%30%13%13%33% 10-20M31% %14%15%12%15%12%11%16%16%Engineering roles. However, ascompanies expand, they need torapidly grow Customer Success andspecialized functions to sustainrapid revenue growth.We notice that Engineering tends tobe the main tradeoff as companies 50M27%Engineering13%Product10%Marketi ng21%Sales11%Customer Success18%Otherscale – once the product is built,commercial activities take priority.FTE Mix by FunctionSource: 2020 OpenView SaaS Metrics Survey, N 409.OV 2020 EXPANSION SAAS BENCHMARKSProprietary 2020 OpenView Advisors, LLC. All Rights Reserved44
MIX OF EMPLOYEES BY FUNCTION,BY DOMINANT SALES CHANNELCompanies leveraging selfARR Scaleservice or freemium channelsSelf Serve39%18%17%8%7%12%commit a greater proportion oftheir resources to engineeringInsideFi keti ng10%9%8%Sales20%12%18%17%13%12%10%Customer Success14%21%and product – this is particularlyevident in PLG companies whorely on organic strategies andproduct awareness to driveinbound demand.OtherFTE Mix by FunctionSource: 2020 OpenView SaaS Metrics Survey, N 409.OV 2020 EXPANSION SAAS BENCHMARKSProprietary 2020 OpenView Advisors, LLC. All Rights Reserved45
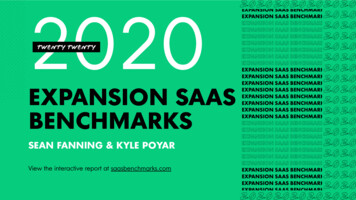
FEMALE-LED TEAMS PERFORM BETTER, BUTRAISE LESS CAPITAL50% 18MWhile female-led teamsoutperform their peers (fastergrowth), they are doing so with40%46% 8M43%50% or more femaleMedian Growth RateLess than 50% femaleE q u it y C apit al Raise dG ro w t h Rat e (A n n u al) 15M 0Mfar less equity capital ( 8M vs. 15M).Although diversity has been atrend in this report for years, it’simportant to remember youcan’t just talk the talk and workstill needs to be done.Median Equity CapitalSource: 2020 OpenView SaaS Metrics Survey, N 409.OV 2020 EXPANSION SAAS BENCHMA
2020 EXPANSION SAAS BENCHMARKS View the interactive report at saasbenchmarks.com SEAN FANNING & KYLE POYAR