Transcription
Ontario’s annual water quality report takes youinside the world of your high-quality drinkingwater. This report is designed to provideimportant information about the source(s) ofyour water, what it contains, and how itcompares to standards set by regulatoryagencies.The Ontario Municipal Utilities Company ispleased to report that during the past year,water delivered to your home or businessmeets or surpassed all state and federaldrinking water requirements.Safe and reliable drinking water supplies arenecessary for public health, fire protection,economic development, and the overall qualityof life. Businesses and residents areencouraged to use the drinking water suppliesas efficiently as possible.Este informe contiene información muyimportante sobre su agua para beber. Favorde comunicarse Ontario Municipal UtilitiesCompany a 1425 South Bon View Avenue,Ontario, CA 91761 para asistirlo en español.
2019 CONSUMER CONFIDENCE REPORTTo ensure safe drinking water, public water systems must comply with Federal and State drinking water standards. The Ontario MunicipalUtilities Company and its trained, certified water quality professionals collect thousands of water samples that are delivered to a Statecertified laboratory for analysis. We are pleased to report there were no water quality violations during 2019.The public is encouraged to participate on issues concerning the City’s water. Meetings of the Ontario City Council are scheduled on the firstand third Tuesday of each month beginning at 6:30pm at Ontario City Hall, 303 East “B” Street, Ontario, CA 91761. Check the City’swebsite at www.ontarioca.gov or call (909) 395-2000 for more information.Para asegurar que el agua potable, los sistemas públicos de agua deben cumplir con las normas federales y estatales de agua potable. ElMunicipal Utilities Company Ontario y sus capacitados, certificados profesionales de la calidad del agua recogen miles de muestras de aguaque se entregan a un laboratorio certificado por el estado para su análisis. Nos complace informar que no había violaciónes de calidaddel agua durante el año 2019.El público es alentado a participar en asuntos con respecto al agua de la Ciudad. Las reuniones del establecimiento de Ontario seprograma el primer y tercer martes de cada mes a las 6:30 P.M., por la calle 303 “B” Street, Ontario. Para más información, vaya al Website de la Ciudad www.ontarioca.gov o llame (909) 395-2000.Regulatory InformationDrinking water, including bottled water, may reasonably be expected to contain at least small amounts of some contaminants. The presence ofcontaminants does not necessarily indicate that water poses a health risk. More information about contaminants and potential health effects canbe obtained by calling the USEPA’s Safe Drinking Water Hotline (1-800-426-4791).The sources of drinking water (both tap water and bottled water) include rivers, lakes, streams, ponds, reservoirs, springs, and wells. As watertravels over the surface of the land or through the ground, it dissolves naturally-occurring minerals and, in some cases, radioactive material,and can pick up substances resulting from the presence of animals or from human activity.CONTAMINANTS THAT MAY BE PRESENT IN SOURCE WATER INCLUDE: Microbial contaminants, such as viruses and bacteria, that may come from sewage treatment plants, septic systems, agriculturallivestock operations, and wildlife. Inorganic contaminants, such as salts and metals, that can be naturally-occurring or result from urban stormwater runoff,industrial or domestic wastewater discharges, oil and gas production, mining, or farming. Pesticides and herbicides, that may come from a variety of sources such as agriculture, urban stormwater runoff, and residentialuses. Organic chemical contaminants, including synthetic and volatile organic chemicals, that are by-products of industrial processes andpetroleum production, and can also come from gas stations, urban stormwater runoff, agricultural application, and septic systems. Radioactive contaminants, that can be naturally-occurring or be the result of oil and gas production and mining activities.In order to ensure that tap water is safe to drink, the U.S. Environmental Protection Agency (U.S. EPA) and the State Water Resources ControlBoard (State Water Board) prescribe regulations that limit the amount of certain contaminants in water provided by public water systems.State Water Board regulations also establish limits for contaminants in bottled water that provide the same protection for public health.NitrateNitrate in drinking water at levels above 10 mg/L is a health risk for infants of less than six months of age. Such nitrate levels in drinking watercan interfere with the capacity of the infant’s blood to carry oxygen, resulting in a serious illness; symptoms include shortness of breath andblueness of the skin. Nitrate levels above 10 mg/L may also affect the ability of the blood to carry oxygen in other individuals, such aspregnant women and those with certain specific enzyme deficiencies. If you are caring for an infant, or you are pregnant, you should askadvice from your health care provider.LeadIf present, elevated levels of lead can cause serious health problems, especially for pregnant women and young children. Lead in drinkingwater is primarily from materials and components associated with service lines and home plumbing. Ontario Municipal Utilities Company isresponsible for providing high quality drinking water, but cannot control the variety of materials used in plumbing components. When yourwater has been sitting for several hours, you can minimize the potential for lead exposure by flushing your tap for 30 seconds to 2 minutesbefore using water for drinking or cooking. If you are concerned about lead in your water, you may wish to have your water tested.Information on lead in drinking water, testing methods, and steps you can take to minimize exposure is available from the Safe Drinking WaterHotline or at http://www.epa.gov/safewater/lead.Page 2Ontario Municipal Utilities Company
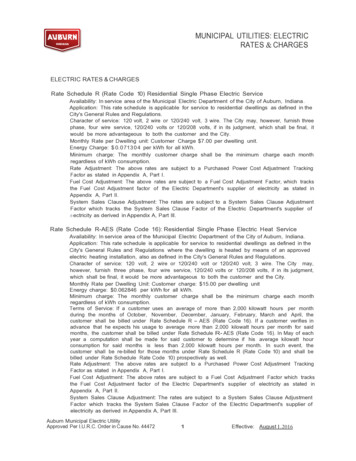
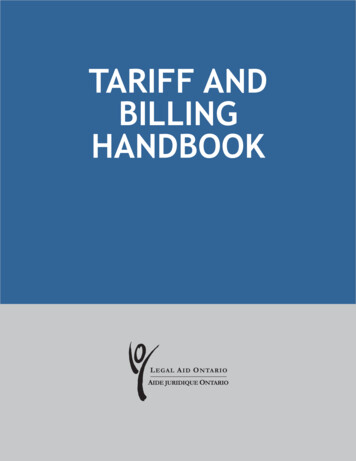
Total Coliform RuleThis Consumer Confidence Report (CCR) reflects changes in drinking water regulatory requirements during 2016. All water systems arerequired to comply with the state Total Coliform Rule. Beginning April 1, 2016, all water systems are also required to comply with the federalRevised Total Coliform Rule. The new federal rule maintains the purpose to protect public health by ensuring the integrity of the drinking waterdistribution system and monitoring for the presence of microbials (i.e., total coliform and E. coli bacteria). The U.S. EPA anticipates greaterpublic health protection as the new rule requires water systems that are vulnerable to microbial contamination to identify and fix problems.Water systems that exceed a specified frequency of total coliform occurrences are required to conduct an assessment to determine if any sanitary defects exist. If found, these must be corrected by the water system.Important Health InformationSome people may be more vulnerable to contaminants in drinking water than the general population. Immuno-compromised persons such aspersons with cancer undergoing chemotherapy, persons who have undergone organ transplants, people with HIV/AIDS or other immunesystem disorders, some elderly, and infants can be particularly at risk from infections. These people should seek advice about drinking waterfrom their health care providers. U.S. EPA/Centers for Disease Control (CDC) guidelines on appropriate means to lessen the risk of infection byCryptosporidium and other microbial contaminants are available from the Safe Drinking Water Hotline (1-800-426-4791).Kidney Dialysis /AquariumsCustomers who have unique water-quality needs and who use specialized home treatments, such as kidney dialysis machines, should make thenecessary adjustments to remove chloramines. Customers who have fish tanks in their homes or businesses should also take precautions toremove chloramines prior to adding water to tanks.Source Water AssessmentAn assessment of the drinking water sources for the Ontario Municipal Utilities Company was completed in May 2002 and reviewed by theState Board in 2019. The sources are considered most vulnerable to the following activities associated with contaminants detected in the watersupply: high density housing; sewer collection systems; parks; golf courses; the application of fertilizers, pesticides, herbicides; metal plating,finishing and fabricating; wood pulp processing and paper mills; and recreational use of surface water sources.A copy of the complete assessment is available at State Water Board San Bernardino District Office at 464 West 4 th Street, Suite 437, SanBernardino, CA 92401. You may request a summary of the assessment be sent to you by contacting the State Water Board’s San BernardinoDistrict Office or Ontario Municipal Utilities Company at (909) 395-2678.Ontario’s Drinking Water SourcesOntario’s water supplies are comprised of surface water andgroundwater. Surface water originates from the State WaterProject (supplied by Metropolitan Water District) and is treatedby Water Facilities Authority (WFA) using conventional watertreatment methods. Groundwater supplies consist of City-owedwells (local groundwater), San Antonio Water Company(SAWCO), and Chino Desalter Authority (CDA) wells.Purchased Groundwater(CDA),22%LocalImported Water(WFA/ SAWCO),Groundwater,58%20%Potable Water ConsumptionAcre-Feet2019 Potable Water SourcesWater Quality MonitoringIn 2019, the Ontario Municipal Utilities Company collected over18,000 potable water samples to test for more than 150 possibleconstituents. Samples were collected at water sources and throughoutthe distribution system.Production YearNote: 1 Acre Foot 325,829 gallons2019 Consumer Confidence ReportThe following tables (pages 5-8) have been compiled for yourinformation showing which constituents were detected in the City’sdrinking water during 2019 as compared to water qualitystandards.Page 3
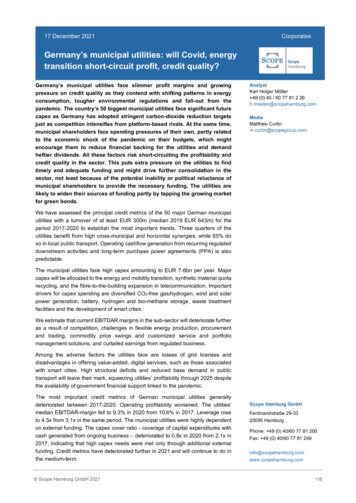
AbbreviationsALAction LevelCFU/mLColony-Forming Units per milliliterDLRDetection limits for the purpose ofreporting: State determined levelthat a test can detect the constituentHPCHeterotrophic Plate Count: a bacteriological test that counts the numberof bacteria per milliliter of sampleMRLMinimum Reporting Level set by EPA forunregulated contaminant monitoringppmparts per million or milligrams perliter (mg/L)NANot Applicable: no State or Federalstandards establishedpptparts per trillion or nanograms perliter (ng/L)NDNot Detected: sample was taken andconstituent was not detectedRAARunning Annual AverageTONThreshold Odor NumberNLNotification LevelTTTreatment TechniqueNRNo Range: all results were the samevalueµS/cmmicroSiemen per centimeter; ormicromho per centimeter (µmho/cm)LRAALocation Running Annual AverageMCLMaximum Contaminant LevelNTUNephelometric Turbidity Units“ ”EqualMCLGMaximum Contaminant Level GoalpCi/LpicoCuries per Liter“ ”Greater thanMRDLMaximum Residual Disinfectant LevelPHGPublic Health Goal“ ”Less thanMRDLGMaximum Residual Disinfectant LevelGoalppbparts per billon or micrograms per liter(µg/L)“ ”“#”Less than or equal toNumber“%”PercentOne part per million (ppm)One part per billion (ppb)One part per trillion (ppt)IS LIKEIS LIKEIS LIKE1 second in 11.5 days1 second in nearly 32 years1 second in nearly 32,000 years1 drop in 13.6 gallons1 drop in 13,563 gallons1 drop in 13,563,368 gallonsMaximum Residual Disinfectant Level(MRDL): The highest level of a disinfectantallowed in drinking water. There is convincingevidence that addition of a disinfectant isnecessary for control of microbial contaminants.Public Health Goals (PHG): The level of acontaminant in drinking water below which there isno known or expected risk to health. PHGs are setby the California Environmental ProtectionAgency.Maximum Residual Disinfectant Level Goal(MRDLG): The level of a drinking waterdisinfectant below which there is no known orexpected risk to health. MRDLGs do not reflectthe benefits of the use of disinfectants to controlmicrobial contaminants.Regulatory Action Level (AL): The concentrationof a contaminant which, if exceeded, triggerstreatment or other requirements that a watersystem must follow.Definitions90th Percentile: The value in a data set in which90 percent of the set is less than or equal to thisvalue.Disinfection By-Product: Compounds which areformed from mixing of organic or mineralprecursors in the water with ozone, chlorine orchloramine. Total Trihalomethanes and HaloaceticAbbreviaAcids are disinfection by-products.Locational Running Annual Average (LRAA):The Running Annual Average (RAA) at onesample location.Maximum Contaminant Level (MCL): Thehighest level of a contaminant that is allowed indrinking water. Primary MCLs are set as close tothe PHGs (or MCLGs) as is economically andtechnologically feasible. Secondary MCLs are setto protect the odor, taste, and appearance ofdrinking water.Maximum Contaminant Level Goal (MCLG):The level of a contaminant in drinking waterbelow which there is no known or expected riskto health. MCLGs are set by the U.S. EPA.Page 4Notification Level (NL): Notification levels arehealth –based advisory levels established bythe State Board for chemicals in drinking waterthat lack maximum contaminant levels (MCLs).Primary Drinking Water Standard (PrimaryStandard): MCLs and MRDLs for contaminantsthat affect health along with their monitoringand reporting requirements, and watertreatment requirements.Running Annual Average (RAA): The yearlyaverage which is calculated every 3 months usingthe previous 12 months’ data.Secondary Drinking Water Standard (SecondaryStandard): MCLs for contaminants that do notaffect health but are used to monitor theaesthetics of the water.Treatment Technique (TT): A required processintended to reduce the level of a contaminant indrinking water.Ontario Municipal Utilities Company
Ontario Municipal Utilities Company - 2019 Distribution System DataCONSTITUENTUNITSMCL or[AL] or(MRDL)PHG orCA[MCLG] or DLR(MRDLG) [MRL]RangeAverageOMUC's EntireDistribution Major Sources in Drinking WaterSystemMICROBIOLOGICALTotal ColiformHeterotrophic PlateCount (HPC)% Positiveper monthCFU /mL5% Positiveper monthTT[0]NANAHighest Monthly% Positive# of Months inViolation0.53%0[1]#HPC 500cfu/mLLowestMonthly %199.3%Erosion of natural deposits; residue from some surface watertreatment processes.Naturally present in the environment.PHYSICAL Naturally-occurring organic materials.pH Unit6.5 - 8.5NA[1]RangeAverage6.66 to 9.217.85Measurement of hydrogen ion activity.NTU5NA0.1RangeAverageND to 0.810.08Soil runoff.DISINFECTION BY-PRODUCTS AND DISINFECTANT RESIDUALSHaloacetic Acids(HAA₅)ppbLRAA 60NA2.0*RangeHighest LRAAND to 1717Byproduct of drinking water disinfection.Total Trihalomethanes(TTHMs)ppbLRAA 80NA1RangeHighest LRAAND to 7766Byproduct of drinking water disinfection.Total Chlorine Residual(Distribution system-wide)ppm(4)(4)NARangeAverage0.04 to 1.690.86Drinking water disinfectant added for treatment.METALS AT CONSUMER'S PLUMBING (2018)Copperppb[1300]30050NALeadppb[15]0.25NA90th percentile:160 ppbInternal corrosion of household plumbing systems; erosion of natural(0 exceeded AL / deposits; leaching from wood preservatives.57 samples)90th percentile: NDcorrosion of household plumbing systems; discharges from(0 exceeded AL / Internalindustrial manufacturers; erosion of natural deposits.57 samples)UNREGULATED CONTAMINANT MONITORING RULE 4 Cyanobacteria, formerly referred to as blue-green algae, arefound naturally in lakes, rivers, ponds and other surface NRNDCyanobacteria, formerly referred to as blue-green algae, arefound naturally in lakes, rivers, ponds and other surface waters.Total ria, formerly referred to as blue-green algae, arefound naturally in lakes, rivers, ponds and other surface waters.ManganeseppbNANA[0.3]RangeAverageND to 6.20.65Naturally-occurring element; commercially available in combinationwith other elements and minerals; used in steel production, fertilizer,batteries and fireworks; drinking water and wastewater treatmentchemical; essential nutrient.Bromochloroacetic acid(BCAA)ppbNANA[0.3]RangeAverageND to 2.91.1Byproduct of drinking water disinfection.Bromodichloroaceticacid (BDCAA)ppbNANA[0.5]RangeAverageND to 3.21.3Byproduct of drinking water disinfection.Chlorodibromoaceticacid (CDBAA)ppbNANA[0.3]RangeAverageND to 3.11.1Byproduct of drinking water disinfection.Tribromoacetic acid(TBAA)ppbNANA[2.0]RangeAverageND to 2.60.33Byproduct of drinking water disinfection.*DLR 1.0 ppb for each HAA5 analyte except for monochloroacetic acid which has a DLR 2.0ppb.Unregulated contaminant monitoring helps USEPA and the State Water Resources Control Board to determine where certain contaminants occur and whether the contaminants need to be regulated.The State allows us to monitor for some contaminants less than once per year because the concentrations of these contaminants do not change frequently. Some of our data, though representative, are more than one year old.2019 Consumer Confidence ReportPage 5
Ontario Municipal Utilities Company - 2019 Water Quality TableLocal Ground WaterCONSTITUENTUNITSMCL[NL]PHG or[MCLG]CA DLR[MRL]Imported Water,WFA w/ SAWCOMajor Sources in Drinking WaterAverageRangeAverageRangePRIMARY STANDARDS - Mandatory Health-Related StandardsCLARITYCombined Filter EffluentTurbidityNTU and %TT 1 NTUTTNANANANA0.22 Highest% 0.3Soil Runoff.100%MICROBIOLOGICALTotal ColiformHeterotrophic Plate Count(HPC)Erosion of natural deposits; residue from%5[0]NANDND to 1.10.2ND to 1.8 some surface water treatment processes.# HPCs 500 cfu /mLTTNA[1]11ND to 160NANAErosion of natural deposits; runoff fromorchards; glass and electronics productionwastes.NANABanned nematicide that may still be presentin soils due to runoff/leaching from formeruse on soybeans, cotton, vineyards,tomatoes, and tree fruit.ORGANIC CHEMICALSDibromochloropropaneppt2001.71020ND to 40ORGANIC CHEMICALSGross Alpha ParticleActivityppt2001.710NANA1.1ND to 4.3 Erosion of natural deposits.ND to 52 some surface water treatment processes.INORGANIC .70.3 to 0.8NAErosion of natural deposits; residue fromNADischarges of oil drilling wastes and frommetal.Cadmiumppb50.0410.4NRNANAInternal corrosion of galvanized pipes;erosions of natural deposits; discharge fromelectroplating and industrial chemicalfactories, and metal refineries; runoff fromwaste batteries and paints.Chromium, Totalppb50[100]¹103.72.2 to 6.0NANADischarge from steel and pulp mills andchrome plating; erosion of natural deposits.Hexavalent ChromiumFluorideppb²(see footnote)0.02[1]3.62.1 to 6.0NANADischarge from electroplating factories,leather tanneries, wood preservation,chemical synthesis, refractory production,and textile manufacturing facilities; erosionof natural deposits.NRErosion of natural deposits; water additivethat promotes strong teeth; discharge fromfertilizer and aluminum factories.ppm2.010.10.20.1 to 0.3NDNitrate(as Nitrogen)ppm10100.42.40.67 to 4.90.9ND to 2.7 leaching from septic tanks and sewage;Nitrate & Nitrite(as Nitrogen)ppm1010[0.2]2.61.2 to 4.10.9ND to 2.7 leaching from septic tanks and sewage;(Naturally-occurring)PerchlorateRunoff and leaching from fertilizer use;erosion of natural deposits.Runoff and leaching from fertilizer use;ppb6141.4ND to 2.9NAerosion of natural deposits.Perchlorate is an inorganic chemical used insolid rocket propellant, fireworks, explosives,flares, matches, and a variety of industries. Itusually gets into drinking water as a result ofenvironmental contamination from historicaerospace or other industrial operations thatused or use, store, or dispose of perchlorateand its salts.NADISINFECTION BY-PRODUCTS, DISINFECTNAT RESIDUALS, AND DISINFECTION BY-PRODUCTS PRECURSORSHaloacetic Acids (HAA₅)ppbLRAA 60NA2NANA106 to 14By-product of drinking water chlorination.Total Trihalomethanes(TTHMs)ppbLRAA 80NA1NANA4622 to 74By-product of drinking water chlorination.Total Chlorine ResidualppmMRDL 4MRDLG 4NANANA1.21.2 to 1.3 treatment.Page 6Drinking water disinfectant added forOntario Municipal Utilities Company
Ontario Municipal Utilities Company - 2019 Water Quality TableLocal Ground WaterCONSTITUENTUNITSMCL[NL]PHG or[MCLG]CA DLR[MRL]Imported Water, WFAw/ SAWCOMajor Sources in Drinking WaterAverageRangeAverageRangeSECONDARY STANDARDS - Aesthetic StandardsAluminumppb20060050NDNR13ND to 52Erosion of natural deposits; residue fromsome surface water treatment processes.Chlorideppm500NA[1]7.63.7 to 154828 to 93Runoff/leaching from natural deposits;seawater influence.Ironppb300NA100NDNRNDNROdor ThresholdTON3NA1NDNR1.5µS/cm1600NA[1]357310 to 450343Sulfateppm500NA0.5145.5 to 3624Total Dissolved Solidsppm1000NANA217190 to 250203140 to 280 Runoff/leaching from natural deposits.TurbidityNTU5NA[0.10]0.10.1 to 0.20.10ND to 0.14 Soil runoff.Specific ConductanceLeaching from natural deposits; industrialwastes.ND to 4.0 Naturally-occurring organic materials.Substances that form ions when in water;260 to 530 seawater influence.20 to 39Runoff/leaching from natural deposits;industrial wastes.OTHER PARAMETERSNaturally-occurring carbonate; measures thewater's ability to neutralize acid.Alkalinity (Total)ppmNANA[3]143130 to 1605738 to 74BicarbonateppmNANA[3]143130 to 1606946 to 90Boronppb[1000]NA100NANA25CalciumppmNANA[1]4335 to 551613 to 20Naturally-occurring mineral.Corrosivity(Aggressiveness Index)AINANANANANA1211 to 12Elemental balance in water; affected bytemperature, other factors.Corrosivity(Saturation Index)SINANANANANA0.1Hardness as CaCO₃ (Total)ppmNANA[3]138120 to 1807357 to 99Naturally-occurring mineral; the sum ofcalcium and magnesium present in water.MagnesiumppmNANA[1]7.56.0 to 108.26.0 to 12Naturally-occurring mineral.Perfluorobutanesulfonicacid (PFBS)³pptNANA[2]NDND to 5.6NANADischarge from chemical synthesis of waterand oil resistance consumer products and fire-retarding foam.Perfluoroheptanoic acid(PFHpA)³pptNANA[2]NDND to 2.8NANADischarge from chemical synthesis of waterand oil resistance consumer products and fire-retarding foam.Perfluorohexanesulfonicacid (PFHxS)³pptNANA[2]NDND to 13NANADischarge from chemical synthesis of waterand oil resistance consumer products and fire-retarding foam.Perfluorohexanoic acid(PFHxA)³pptNANA[2]NDND to 6.6NANADischarge from chemical synthesis of waterand oil resistance consumer products and fire-retarding foam.Perfluorooctanoic acid(PFOA)³ppt₄₅(see footnote)(see footnote)[2]NDND to 5.8NANADischarge from chemical synthesis of waterand oil resistance consumer products and fire-retarding foam.pH unitsNANA[1]8.28.0 to 8.38.17.9 to 8.2 Measurement of hydrogen ion activity.PotassiumppmNANA[1]1.81.5 to 2.12.01.5 to 3.1 Naturally-occurring mineral.SodiumppmNANA[1]1914 to 273726 to 61Total OrganicCarbon (TOC)ppmTTNA0.3NANA2.11.4 to 2.9 Various natural and man-made sources.pHNaturally-occurring element; runoff/leachingND to 100 from natural deposits and fertilizer use;industrial wastes.Elemental balance in water; affected by-0.3 to 0.5 temperature, other factors.Naturally-occurring mineral; seawaterinfluence.¹ California withdrew the PHG for total chromium in November 2011.² There is currently no MCL for hexavalent chromium. The previous MCL of 10ppb was withdrawn on September 11th, 2017. The Ontario Municipal Utilities Company (OMUC) will continue to monitor this constituent.³ Detection in one local groundwater well and was removed by OMUC on April 29, 2019.⁴ The July 2018 notification levels for PFOA of 14 ng/L and for PFOS of 13 ng/L were superseded on August 22, 2019, with new notification levels 5.1 ng/L for PFOA and 6.5 ng/L for PFOS.⁵ The California Office of Environmental Health Hazard Assessment is developing a PHG for PFOA & PFOS. There is no established PHG at this time.The State allows us to monitor for some contaminants less than once per year because the concentrations of these contaminants do not change frequently. Some of our data, though representative, are more than one year old.2019 Consumer Confidence ReportPage 7
Ontario Municipal Utilities Company - 2019 Water Quality TableCDA 1(870 Zone)CONSTITUENTUNITSMCL[NL]PHG or[MCLG]CA DLR[MRL]CDA II(1110 Zone)Ion ExchangePlant (870 Zone)Major Sources in Drinking WaterAverageRangeAverageRangeAverageRangePRIMARY STANDARDS - Mandatory Health-Related StandardsINORGANIC CHEMICALSChromium, TotalFluoride(Naturally-occurring)Nitrate(as Nitrogen)ppb50[100]¹103.42.0 to5.1NDND to4.2NDNRDischarge from steel and pulp mills andchrome plating; erosion of natural deposits.ppm2.010.10.120.10 to0.14NDND to0.16NDNRErosion of natural deposits; water additivethat promotes strong teeth; discharge fromfertilizer and aluminum factories.ppm10100.45.52.9 to8.04.83.3 to5.74.02.0 to6.0Runoff and leaching from fertilizer use;leaching from septic tanks and sewage;erosion of natural deposits.DISINFECTION BY-PRODUCTS, DISINFECTNAT RESIDUALS, AND DISINFECTION BY-PRODUCTS PRECURSORSTotalTrihalomethanes(TTHMs)ppbLRAA 80NA18.95.2 to12.5NDNRNDFree ChlorineResidualppmMRDL 4MRDLG 4NA1.310.57 to1.741.441.05 to1.790.98NRBy-product of drinking water chlorination.0.64 to Drinking water disinfectant added for1.66 treatment.SECONDARY STANDARDS - Aesthetic lfateppm500NA0.521Total NDSurfactantsppb500NANANDSpecific Conductance23 to160440 to79016 to25280 to790ND to0.26ND to907860211434NDND12 to 82350 to72010 to13220 to500ND to0.4NR1096103.24700.15ND98 to120500 to7200.52 to5.8340 to6000.12 to0.18Runoff/leaching from natural deposits;seawater influence.Substances that form ions when in water;seawater influenceRunoff/leaching from natural deposits;industrial wastes.Runoff/leaching from natural deposits.Soil runoff.NRMunicipal and industrial waste discharges.94 to10048 to62170 to210Naturally-occurring carbonate; measuresthe water's ability to neutralize acid.OTHER PARAMETERSAlkalinity sodimethylamine (NDMA)pH130 to16062 to110180 to31011256177100 to14042 to57130 to1809755190Naturally-occurring mineral.Naturally-occurring mineral; the sum ofcalcium and magnesium present in water.Discharge from electroplating factories,leather tanneries, wood preservation,chemical synthesis, refractory production,and textile manufacturing facilities; erosionof natural deposits.0.02[1]3.21.7 to 5.02.30.66 to4.2NANA[1]6.76.2 to128.85.6 to9.012.511 to14ppt[10]NANANDNRNDNR4.0NRBy-product of drinking water treatment,production of liquid rocket fuel.pH unitsNANA[1]8.0NR8.07.9 to8.18.07.9 to8.0Measurement of hydrogen ion activity.₄₅(see footnote)(see footnote)[2]3.1ND to6.9NDNRNDNRDischarge from chemical synthesis of waterand oil resistance consumer products andfire-retarding foam.[2]47ND to200NDNRNDNRDischarge from chemical synthesis of waterand oil resistance consumer products andfire-retarding foam.PerfluorooctanoicAcid (PFOA)³pptPerfluorooctanesulfonic Acid(PFOS)³pptPotassium²(see footnote)₄₅(see footnote)(see footnote)ppmNANA[1]2.4SodiumppmNANA[1]27Total SilicappmNANANA211.9 to2.919 to3516 to251.628151.5 to2.025 to2812 to16NDNR1.428111.1 to1.627 to28Naturally-occurring mineral.Naturally-occurring mineral.Naturally-occurring mineral; seawaterinfluence.NR¹ California withdrew the PHG for total chromium in November 2011.² There is currently no MCL for hexavalent chromium. The previous MCL of 10ppb was withdrawn on September 11th, 2017. The Ontario Municipal Utilities Company (OMUC) will continue to monitor this constituent.³ JCSD has removed all sources above the response level (10 ppt) and will not be used until treatment is in place. Any source above the notification level (est. August 22, 2019) has been put on emergency standby only.⁴ The July 2018 notification levels for PFOA of 14 ng/L and for PFOS of 13 ng/L were superseded on August 22, 2019, with new notification levels 5.1 ng/L for PFOA and 6.5 ng/L for PFOS.⁵ The California Office of Environmental Health Hazard Assessment is developing a PHG for PFOA & PFOS. There is no established PHG at this time.All water quality data reported for CDA/JCSD were taken from treated water sample locations with the exemption of PFAS data from Ion Exchange Plant (870 Zone).Page 8Ontario Municipal Utilities Company
2019 Consumer Confidence ReportPage 9
City OfficialsMayorPaul S. LeonMayor pro TemDebra Dorst-PoradaCouncil MembersAlan D. WapnerJim W. BowmanRuben ValenciaCity ManagerScott OchoaUtilities General ManagerScott Burton1425 South Bon View Avenue · Ontario, CA 91761 · (909) 395-2600 · www.ontarioca.gov
District Office or Ontario Municipal Utilities Company at (909) 395-2678. e-t Production Year Note: 1 Acre Foot 325,829 gallons Ontario's Drinking Water Sources Water Quality Monitoring In 2019, the Ontario Municipal Utilities Company collected over 18,000 potable water samples to test for more than 150 possible constituents.