Transcription
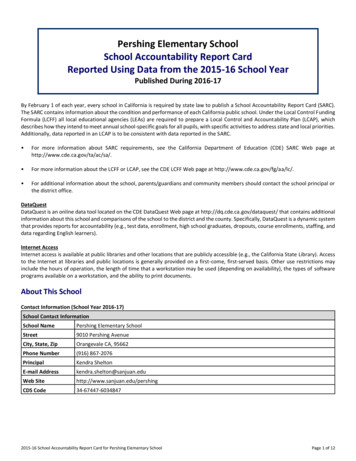
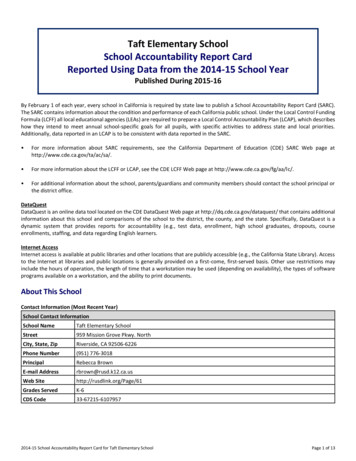
Taft Elementary SchoolSchool Accountability Report CardReported Using Data from the 2014-15 School YearPublished During 2015-16By February 1 of each year, every school in California is required by state law to publish a School Accountability Report Card (SARC).The SARC contains information about the condition and performance of each California public school. Under the Local Control FundingFormula (LCFF) all local educational agencies (LEAs) are required to prepare a Local Control Accountability Plan (LCAP), which describeshow they intend to meet annual school-specific goals for all pupils, with specific activities to address state and local priorities.Additionally, data reported in an LCAP is to be consistent with data reported in the SARC. For more information about SARC requirements, see the California Department of Education (CDE) SARC Web page athttp://www.cde.ca.gov/ta/ac/sa/. For more information about the LCFF or LCAP, see the CDE LCFF Web page at http://www.cde.ca.gov/fg/aa/lc/. For additional information about the school, parents/guardians and community members should contact the school principal orthe district office.DataQuestDataQuest is an online data tool located on the CDE DataQuest Web page at http://dq.cde.ca.gov/dataquest/ that contains additionalinformation about this school and comparisons of the school to the district, the county, and the state. Specifically, DataQuest is adynamic system that provides reports for accountability (e.g., test data, enrollment, high school graduates, dropouts, courseenrollments, staffing, and data regarding English learners.Internet AccessInternet access is available at public libraries and other locations that are publicly accessible (e.g., the California State Library). Accessto the Internet at libraries and public locations is generally provided on a first-come, first-served basis. Other use restrictions mayinclude the hours of operation, the length of time that a workstation may be used (depending on availability), the types of softwareprograms available on a workstation, and the ability to print documents.About This SchoolContact Information (Most Recent Year)School Contact InformationSchool Name-------Taft Elementary SchoolStreet-------959 Mission Grove Pkwy. NorthCity, State, Zip-------Riverside, CA 92506-6226Phone Number------- (951) 776-3018Principal-------Rebecca BrownE-mail Address------- rbrown@rusd.k12.ca.usWeb Site-------http://rusdlink.org/Page/61Grades ServedK-6CDS Code33-67215-61079572014-15 School Accountability Report Card for Taft Elementary SchoolPage 1 of 13
District Contact InformationDistrict Name-------Riverside UnifiedPhone Number------- (951) 776-3018Superintendent------ David C. Hansen, Ed.D.-E-mail Address------- dchansen@rusd.k12.ca.usWeb Site-------rusdlink.orgSchool Description and Mission Statement (Most Recent Year)Taft Elementary School opened its doors in September 1988. It was named after William Howard Taft, the twenty-seventh presidentof the United States. President Taft dedicated his life to public service including government, law, and teaching.Taft Elementary School serves approximately 730 students in grades Transitional Kindergarten through sixth grade including bothprimary and upper grade Special Day Classes. Taft has a diverse student population and teachers and students work daily toward highlevels of learning for every Taft student.Taft Elementary is a unique place where children come first. We strive daily to provide opportunities to impact the leaning anddevelopment of Taft students in a manner that aligns with their future success. Taft Elementary is an AVID Elementary School with thefollowing unique programs and services: An expectation that every Taft student lay the foundation for future college and career readiness.A full day kindergarten program that is developmentally appropriate.First grade iPod technology integration in language arts and mathematics.One to One Chrome Books for all Taft Elementary students.Students in grades five and six have an option to take home the Chrome book for extended learning opportunities daily.Kindergarten through sixth grade instruction in the scientific method.Third through sixth grade science fair instruction and participation for every student.Second grade chorus instruction and end of the year tribute to sixth grade students.Third grade partnership with the Kiwanis to put a dictionary in the hands of every third grade student.UCR Young Science Scholars partnership to support science instruction.Fifth grade students all receive formal music instruction.Sixth grade science camp at beautiful Pathfinder Ranch.K-6th arts integration into content instruction and a May "Focus on the Arts."On and off campus field trips to provide hands-on learning for Taft students.Read Across America community partnership to celebrate reading.Partnership with AmeriCorps. College age tutors assisting with students at risk.K-2 Institute used for reading intervention for foundational reading skills.Read 180 for CORE replacement for students in grade 4 and 5.Physical Education for all students, including 100 mile club and PTA sponsored "Fire up your Feet".Reflections program - a PTA sponsored event focusing on a annual arts theme.Taft Mission Statement:The purpose of our mission statement is to guide the work of every staff member as he/she interacts with students on a daily basis.Our Taft mission statement focuses on every student learning and applying grade level or above instruction and learning. Our goal isfor every staff member, student, and parent to see evidence of and feel our school’s mission on a daily basis.OUR MISSION:At Taft Elementary School, our mission is to ensure that all students receive, learn, and apply grade level instruction. Teachers willfacilitate this learning with best first instruction and targeted interventions to support each student’s progress toward attainment ofgrade level or above proficiency. Taft students will demonstrate their learning and application of essential skills and knowledge onformative and summative school, district, and state assessments, and teachers will utilize student achievement data to guideinstructional decisions and planning.2014-15 School Accountability Report Card for Taft Elementary SchoolPage 2 of 13
Student Enrollment by Grade Level (School Year 2014-15)GradeLevelNumber ofStudentsKindergarten110Grade 186Grade 2111Grade 397Grade 494Grade 5104Grade 6100Total Enrollment702Student Enrollment by Group (School Year 2014-15)StudentGroupPercent ofTotal EnrollmentBlack or African American6.6Asian1.9Filipino0.9Hispanic or Latino65.8Native Hawaiian or Pacific Islander1White19.2Two or More Races3.7Socioeconomically Disadvantaged73.5English Learners29.5Students with Disabilities9.8Foster Youth0.1A. Conditions of LearningState Priority: BasicThe SARC provides the following information relevant to the Basic State Priority (Priority 1): Degree to which teachers are appropriately assigned and fully credentialed in the subject area and for the pupils they areteaching; Pupils have access to standards-aligned instructional materials; and School facilities are maintained in good repair.Teacher 5-162015-16With Full Credential2930321855Without Full Credential0001Teaching Outside Subject Area of Competence (with full credential)00002014-15 School Accountability Report Card for Taft Elementary SchoolPage 3 of 13
Teacher Misassignments and Vacant Teacher nts of Teachers of English Learners000Total Teacher Misassignments *000Vacant Teacher Positions000Note: “Misassignments” refers to the number of positions filled by teachers who lack legal authorization to teach that grade level, subject area, student group, etc.* Total Teacher Misassignments includes the number of Misassignments of Teachers of English Learners.Core Academic Classes Taught by Highly Qualified Teachers (School Year 2014-15)Location of ClassesPercent of Classes In Core Academic SubjectsTaught by Highly Qualified TeachersNot Taught by Highly Qualified TeachersThis School100.00.0All Schools in District93.66.4High-Poverty Schools in District93.36.7Low-Poverty Schools in District95.05.0Note: High-poverty schools are defined as those schools with student eligibility of approximately 40 percent or more in the free and reduced price meals program.Low-poverty schools are those with student eligibility of approximately 39 percent or less in the free and reduced price meals program.Quality, Currency, Availability of Textbooks and Instructional Materials (School Year 2015-16)Year and month in which data were collected: 10/2015The table displays information collected in October 5, 2015 about the quality, currency, and availability of the standards-alignedtextbooks and other instructional materials used at the school. It was determined that each RUSD school had sufficient and goodquality textbooks, instructional materials, or science lab equipment, where appropriate, pursuant to the settlement of Williams vs.the State of California. All students, including English learners, are given their own individual standards-aligned textbooks orinstructional materials, or both, in core subjects for use in the classroom and to take home. Textbooks and supplementary materialsare adopted according to a 6-year cycle developed by the California Department of Education, making the textbooks used in the schoolthe most current available. Materials approved for use by the State are reviewed by all teachers and a recommendation is made tothe School Board by a selection committee composed of teachers and administrators. All recommended materials are available forparent examination at the district office prior to adoption.Riverside Unified School District adopts instructional materials on a regular schedule based on State adoptions. All students receiveappropriate, up-to-date instructional materials for use in the classroom and at home. All materials currently in use have been selectedby the staff with parent input, and approved by the Board of Education according to state adoption requirements. Teachers areprovided training in the use of new materials.Comprehensive curriculum (ELA, Math, Science, History-Social Science) Pearson: Opening the World of Learning (OWL) adopted in2015.Core Curriculum AreaTextbooks and Instructional Materials/Year of AdoptionFromMost RecentAdoption?Percent of StudentsLacking OwnAssigned CopyReading/Language ArtsMacmillan McGraw-Hill: California Treasures, K-2(Adopted in 2013)Houghton Mifflin Reading: A Legacy of Literacy, 3-6(Adopted in 2002)Scholastic - Read 180/System 44 (Adopted in 2010)Yes0%MathematicsPearson Education: enVision Math CaliforniaCommon Core 2015, K-6Yes0%2014-15 School Accountability Report Card for Taft Elementary SchoolPage 4 of 13
Textbooks and Instructional Materials/Year of AdoptionCore Curriculum AreaFromMost RecentAdoption?Percent of StudentsLacking OwnAssigned CopyScienceMcGraw Hill: California Science, K-6 (Adopted in2007)Yes0%History-Social ScienceHarcourt: Reflections, K-6 (Adopted in 2006)Yes0%Visual and Performing ArtsElementary Music Program and Standards-basedArts LessonsYes0%School Facility Conditions and Planned Improvements (Most Recent Year)Year Constructed: 1989Lot Size: 10 Acres26 Permanent Classrooms7 Portable ClassroomsLibraryMulti-Purpose RoomIndoor and Outdoor CafeteriaCompletely Air Conditioned“Riverside Unified School District maintains both 5 and 15 year major maintenance plans for all schools. These plans are located atthe District’s Maintenance and Operations Office and are available for review."Riverside Unified School District has instituted a formal school facility inspection system based on State of California School FacilityCondition Criteria. The State criteria consist of 13 building components typically found in school facilities. Taft Elementary Schoolcompleted their school site inspection on April 14, 2015 .Taft has a full time custodial staff who along with other district personnel maintain the grounds and facilities.Riverside Unified School District has allocated funds for the sole purpose of school maintenance pursuant to Education Code sections17002(d), 17014, 17032.5, 17070.75(a), and 17089(b). The September report included an overall good repair with three rooms notinga need to replace stained ceiling tiles. Work orders were completed and ceiling tiles have since been repaired.# of Work Orders 436Labor Hours 1,312.50Assessed Value of Work 53,441.25School Facility Good Repair Status (Most Recent Year)School Facility Good Repair Status (Most Recent Year)Year and month in which data were collected: 4/14/2015System InspectedSystems: Gas Leaks, Mechanical/HVAC,SewerRepair StatusGoodPoorXInterior: Interior SurfacesCleanliness: Overall Cleanliness, Pest/Vermin InfestationFairRepair Needed andAction Taken or PlannedXTall grass & plants need to be trimmed down,excess is covering the storm drain. Leaking faucetand piping under the sink, roof leak/wet ceilingtiles from recent rain.X2014-15 School Accountability Report Card for Taft Elementary SchoolPage 5 of 13
School Facility Good Repair Status (Most Recent Year)Year and month in which data were collected: 4/14/2015Repair StatusSystem InspectedGoodElectrical: ElectricalXRestrooms/Fountains: Restrooms, Sinks/FountainsXSafety: Fire Safety, Hazardous MaterialsXStructural: Structural Damage, RoofsXExternal: Playground/School Grounds,Windows/ Doors/Gates/FencesXFairRepair Needed andAction Taken or PlannedPoorOverall Facility Rating (Most Recent Year)Year and month in which data were collected: 4/14/2015ExemplaryOverall RatingGoodFairPoorXB. Pupil OutcomesState Priority: Pupil AchievementThe SARC provides the following information relevant to the State priority: Pupil Achievement (Priority 4): Statewide assessments (i.e., California Assessment of Student Performance and Progress [CAASPP], Science California StandardsTests); and The percentage of pupils who have successfully completed courses that satisfy the requirements for entrance to the Universityof California and the California State University, or career technical education sequences or programs of studyCalifornia Assessment of Student Performance and Progress Results for All Students (School Year 2014-15)Percent of Students Meeting or Exceeding the State Standards(grades 3-8 and 11)SubjectSchoolDistrictStateEnglish Language Arts/Literacy344344Mathematics263333Note: Percentages are not calculated when the number of students tested is ten or less, either because the number of students in this category is too small forstatistical accuracy or to protect student privacy.CAASPP Assessment Results - English Language Arts (ELA)Disaggregated by Student Groups, Grades Three through Eight and Eleven (School Year 2014-15)Number of StudentsStudent GroupAll StudentsMaleGradePercent of StudentsEnrolledTestedTestedStandardNot MetStandardNearly 35349.53423261544951.6572016654844.458191942014-15 School Accountability Report Card for Taft Elementary SchoolPage 6 of 13
Number of StudentsStudent GroupGradePercent of StudentsTestedTestedStandardNot MetStandardNearly --------Filipino622.0--------Hispanic or 2.675081751816.7891100FemaleBlack or African AmericanAsianNative Hawaiian or PacificIslanderWhiteTwo or More RacesSocioeconomically DisadvantagedStudents with DisabilitiesEnrolled2014-15 School Accountability Report Card for Taft Elementary SchoolPage 7 of 13
Number of StudentsStudent GroupFoster YouthGradePercent of StudentsTestedTestedStandardNot MetStandardNearly edDouble dashes (--) appear in the table when the number of students is ten or less, either because the number of students in this category is too small for statisticalaccuracy or to protect student privacy.Note: The number of students tested includes students that did not receive a score; however, the number of students tested is not the number that was used tocalculate the achievement level percentages. The achievement level percentages are calculated using students with scores.CAASPP Assessment Results - MathematicsDisaggregated by Student Groups, Grades Three through Eight and Eleven (School Year 2014-15)Number of StudentsStudent GroupGradePercent of StudentsEnrolledTestedTestedStandardNot 622.0--------Hispanic or 61.05923135All StudentsMaleFemaleBlack or African AmericanAsian2014-15 School Accountability Report Card for Taft Elementary SchoolStandardNearly MetStandardMetStandardExceededPage 8 of 13
Number of StudentsStudent GroupGradeNative Hawaiian or PacificIslanderWhiteTwo or More RacesSocioeconomically DisadvantagedStudents with DisabilitiesFoster YouthPercent of StudentsTestedTestedStandardNot MetStandardNearly nrolledDouble dashes (--) appear in the table when the number of students is ten or less, either because the number of students in this category is too small for statisticalaccuracy or to protect student privacy.Note: The number of students tested includes students that did not receive a score; however, the number of students tested is not the number that was used tocalculate the achievement level percentages. The achievement level percentages are calculated using students with scores.California Standards Tests for All Students in Science (Three-Year Comparison)Percent of Students Scoring at Proficient or Advanced(meeting or exceeding the state standards)SubjectScience (grades 5, 8, and 056Note: Scores are not shown when the number of students tested is ten or less, either because the number of students in this category is too small for statisticalaccuracy or to protect student privacy.2014-15 School Accountability Report Card for Taft Elementary SchoolPage 9 of 13
California Standards Tests Results by Student Group in Science (School Year 2014-15)StudentGroupPercent of Students Scoring atProficient or AdvancedAll Students in the LEA58All Students at the School44Male50Female39Black or African American--Asian--Hispanic or Latino37Native Hawaiian or Pacific Islander--White69Two or More Races--Socioeconomically Disadvantaged--English Learners21Students with Disabilities31Foster Youth--Note: Scores are not shown when the number of students tested is ten or less, either because the number of students in this category is too small for statisticalaccuracy or to protect student privacy.California Physical Fitness Test Results (School Year 2014-15)Percent of Students Meeting Fitness StandardsGradeLevelFour of Six StandardsFive of Six StandardsSix of Six Standards---5---16.8015.9012.10Note: Percentages are not calculated when the number of students tested is ten or less, either because the number of students in this category is too small forstatistical accuracy or to protect student privacy.C. EngagementState Priority: Parental InvolvementThe SARC provides the following information relevant to the Parental Involvement State Priority (Priority 3): Efforts the school district makes to seek parent input in making decisions for the school district and each schoolsite.Opportunities for Parental Involvement (Most Recent Year)Parents are an integral part of the Taft community. Parents are encouraged to become involved in their child's education duringkindergarten and sixth grade before-school parent/student orientations, lunch with your student, movie nights, the winter festival,volunteering in the class, Back to School Night, our spring talent show and our spring Arts Walk. Additionally, information is sent homein both English and Spanish to encourage all parents to participate during parent meetings, parent workshops as well as volunteeringin our classrooms. Taft parents are actively involved in PTA, English Learner Advisory Committee (ELAC), and School Site Council (SSC).All parents are encouraged to take an active role in their child’s education through nightly homework, regular progress reports, andongoing communication with the school. Additionally, Taft families have access to the RUSD Family Resource Center for parentworkshops and classes.For more information on parent involvement and becoming involved at Taft Elementary School, please contact our CommunityAssistant, Albertina Bretado at (951) 776-3018 extension 45146. The Family Resource Center information: 6735 Magnolia Avenue B6Riverside CA 92506. Phone number is (951) 328-4003 and their webpage is www.RUSDLink.org.2014-15 School Accountability Report Card for Taft Elementary SchoolPage 10 of 13
State Priority: School ClimateThe SARC provides the following information relevant to the School Climate State Priority (Priority 6): Pupil suspension rates;Pupil expulsion rates; andOther local measures on the sense of safety.Suspensions and .09School Safety Plan (Most Recent Year)The School Site Council or its delegate is responsible for the development and updating of the school's Comprehensive Safety Plan. ASite Comprehensive Safety Plan Checklist is provided by the Assistant Superintendent of Operations to give guidance on what shouldbe included in the School's Safety Plan. The Safety Plan is discussed with staff, evaluated, amended/reviewed/updated by March 1 ofeach year. The school's safety committee makes monthly safety inspections. A school Disaster Preparedness Plan that deals with awide variety of emergency situations is incorporated into the School Safety Plan. Earthquakes, fire, and lockdown drills are conductedas required. The key elements of the Comprehensive School Safety Plan include an assessment of current status of school crime;provisions of any schoolwide dress code including the definition of "gang related apparel"; safe movement of pupils, parents andschool employees to and from school; strategies in maintaining a safe and orderly school environment; child abuse reportingprocedures; disaster procedures, routine and emergency; policies related to suspensions, expulsion or mandatory expulsion and otherschool designated serious acts which would lead to suspension or expulsion, notification to teachers, anti-bullying policy and schooldiscipline rules and procedures pursuant to EC 35291 and EC 35291.5. The school also has an assigned School Resource Officer (SRO).D. Other SARC InformationThe information in this section is required to be in the SARC but is not included in the state priorities for LCFF.Adequate Yearly Progress Overall and by Criteria (School Year 2014-15)AYP CriteriaSchoolDistrictStateMade AYP OverallYesYesYesMet Participation Rate: English-Language ArtsYesYesYesMet Participation Rate: MathematicsYesYesYesMet Percent Proficient: English-Language ArtsN/AN/AN/AMet Percent Proficient: MathematicsN/AN/AN/AMet Attendance RateYesYesYesMet Graduation RateN/AYesYesFederal Intervention Program (School Year 2015-16)IndicatorProgram Improvement StatusFirst Year of Program ImprovementYear in Program Improvement*SchoolDistrictIn PIIn PI2007-20082007-2008Year 5Year 3Number of Schools Currently in Program ImprovementN/A22Percent of Schools Currently in Program ImprovementN/A73.3Note: Cells with N/A values do not require data.2014-15 School Accountability Report Card for Taft Elementary SchoolPage 11 of 13
Average Class Size and Class Size Distribution umber of Classes1-2021-3233 Avg.ClassSize2014-15Number of Classes1-2021-3233 Avg.ClassSizeNumber of Classes1-2021-3233 5321627Other29121131127232913126122513121Note: Number of classes indicates how many classes fall into each size category (a range of total students per class).Academic Counselors and Other Support Staff (School Year 2014-15)Number of FTEAssigned to SchoolAverage Number of Students perAcademic CounselorAcademic Counselor-------00Counselor (Social/Behavioral or Career Development)0N/ALibrary Media Teacher (Librarian)0N/ALibrary Media Services Staff N/A0.18N/ASpeech/Language/Hearing Specialist1N/AResource Specialist-------1N/AOther-------0N/ATitleSocial Worker------Nurse-------Note: Cells with N/A values do not require data. One Full Time Equivalent (FTE) equals one staff member working full time; one FTE could also represent two staffmembers who each work 50 percent of full time.Expenditures per Pupil and School Site Teacher Salaries (Fiscal Year 2013-14)Expenditures Per dAverageTeacherSalarySchool N/A 4,709 79,035Percent Difference: School Site and DistrictN/AN/A-14.9-3.7State-------N/AN/A 5,348 72,971Percent Difference: School Site and StateN/AN/A-25.14.3LevelNote: Cells with N/A values do not require data.Types of Services Funded (Fiscal Year 2014-15)Taft Elementary School received the following Categorical Program/Supplemental funds which can be used to provide the followingservices: 90,000 Local Control Funding Formula (LCFF): for increased or improved services for Low Income Students, English Learners, or FosterYouth for site goals in alignment with the RUSD Local Control Accountability Plan 152,917 Title I: supplemental services and materials to assist students at risk of not meeting state academic standards2014-15 School Accountability Report Card for Taft Elementary SchoolPage 12 of 13
Teacher and Administrative Salaries (Fiscal Year 2013-14)CategoryDistrict AmountState Average for Districts In Same CategoryBeginning Teacher Salary 49,695 43,165Mid-Range Teacher Salary 73,295 68,574Highest Teacher Salary 95,855 89,146Average Principal Salary (Elementary) 119,572 111,129Average Principal Salary (Middle) 126,482 116,569Average Principal Salary (High) 137,354 127,448Superintendent Salary 239,574 234,382Percent of Budget for Teacher Salaries41%38%Percent of Budget for Administrative Salaries6%5%For detailed information on salaries, see the CDE Certificated Salaries & Benefits Web page at http://www.cde.ca.gov/ds/fd/cs/.Professional Development (Most Recent Three Years)During the past three school years, Taft staff members participated in staff development and training opportunities. Many staffmembers participated in other activities sponsored by the district and/or Special Projects that were appropriate for their individualneeds. The district sponsored professional development with CCSS focus days included 5 days in 2014-15 and 4 days during 2015-16.Site identified training opportunities are provided during the instructional day as well as after school depending on staff needs andthe availability of training. Follow up, support, and monitoring are provided to ensure application of training received and alignmentwith student learning needs and site goals. There are 15 staff professional development days and a weekly collaborative opportunityto develop professional practice.Student Achievement data and staff needs were utilized to determine the following focus areas for professional development for thepast three school years:1. Training on data analysis and response planning2. Instructional Cycle planning3. AVID training for teachers in grade 3rd-6th4. Common Core State Standards for teachers in K-65. K/2nd Institute training for kindergarten and first grade teachers in multi-sensory strategies.6. K-2 Treasures training for new material adoption.7. Grade 3-6 Training on new ELD materials.8. CCSS Professional develop in the new standards for both ELA and Mathematics.9. Digital Literacy and Digital Citizenship.10. Professional development in instructional Technology, including a summer conference to Google Education Tools.Staff training and development also occurs by the Principal, district staff, and teacher leaders during staff meetings, team meetings,weekly teacher collaboration, as well as monthly team leadership meetings.2014-15 School Accountability Report Card for Taft Elementary SchoolPage 13 of 13
2014-15 School Accountability Report Card for Taft Elementary School Page 1 of 13 . Published During 2015-16 By February 1 of each year, every school in California is required by state law to publish a School Accountability Report Card (SARC). . the District's Maintenance and Operations Office and are available for review." Riverside .

