Transcription
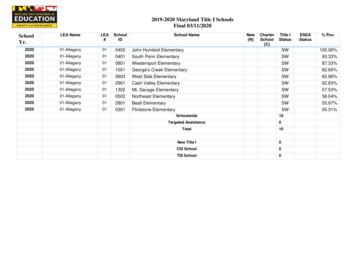
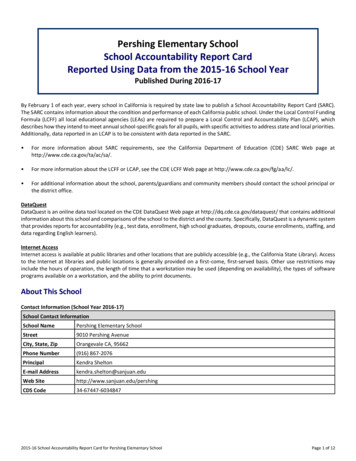
Pershing Elementary SchoolSchool Accountability Report CardReported Using Data from the 2015-16 School YearPublished During 2016-17By February 1 of each year, every school in California is required by state law to publish a School Accountability Report Card (SARC).The SARC contains information about the condition and performance of each California public school. Under the Local Control FundingFormula (LCFF) all local educational agencies (LEAs) are required to prepare a Local Control and Accountability Plan (LCAP), whichdescribes how they intend to meet annual school-specific goals for all pupils, with specific activities to address state and local priorities.Additionally, data reported in an LCAP is to be consistent with data reported in the SARC. For more information about SARC requirements, see the California Department of Education (CDE) SARC Web page athttp://www.cde.ca.gov/ta/ac/sa/. For more information about the LCFF or LCAP, see the CDE LCFF Web page at http://www.cde.ca.gov/fg/aa/lc/. For additional information about the school, parents/guardians and community members should contact the school principal orthe district office.DataQuestDataQuest is an online data tool located on the CDE DataQuest Web page at http://dq.cde.ca.gov/dataquest/ that contains additionalinformation about this school and comparisons of the school to the district and the county. Specifically, DataQuest is a dynamic systemthat provides reports for accountability (e.g., test data, enrollment, high school graduates, dropouts, course enrollments, staffing, anddata regarding English learners).Internet AccessInternet access is available at public libraries and other locations that are publicly accessible (e.g., the California State Library). Accessto the Internet at libraries and public locations is generally provided on a first-come, first-served basis. Other use restrictions mayinclude the hours of operation, the length of time that a workstation may be used (depending on availability), the types of softwareprograms available on a workstation, and the ability to print documents.About This SchoolContact Information (School Year 2016-17)School Contact InformationSchool Name-------Pershing Elementary SchoolStreet-------9010 Pershing AvenueCity, State, Zip-------Orangevale CA, 95662Phone Number------- (916) 867-2076Principal-------Kendra SheltonE-mail Address------- kendra.shelton@sanjuan.eduWeb Site-------http://www.sanjuan.edu/pershingCDS Code34-67447-60348472015-16 School Accountability Report Card for Pershing Elementary SchoolPage 1 of 12
District Contact InformationDistrict Name-------San Juan Unified School DistrictPhone Number------- (916) 971-7700Superintendent------ Kent Kern-E-mail Address------- info@sanjuan.eduWeb Site-------www.sanjuan.eduSchool Description and Mission Statement (School Year 2016-17)Principal's MessagePershing Elementary School provides a safe, nurturing and child centered environment in which our children can grow academically,socially, and emotionally. We encourage our children to learn, celebrating their creativity, initiative and individuality, through dailyinteractions in the classroom and through participation in art, music and physical education. Our students are focused on always doingtheir "personal best." Staff members are dedicated and committed to the success of every child, and their professionalism andknowledge is greatly acknowledged. Our parents/guardians and dedicated volunteers help provide the support and interaction thatcontributes to a valuable partnership between home and school, benefiting the children at Pershing school.Mission StatementThe mission of Pershing Elementary, created collaboratively with the staff and community, is as follows:An inspiring, nurturing, and innovative school, the mission of Pershing K-6 Elementary is to engage and challenge every child to be acompassionate citizen and an analytical problem solver through high-quality, dynamic instruction based on individual student needswithin a cohesive learning community.School ProfilePershing K-6 Elementary is a neighborhood school with a strong academic program. Pershing K- 6 Elementary has a rapid learnerprogram beginning in grade 2 and continuing through grade 5. The Rapid Learner program is an accelerated program and studentsare typically working a grade level higher than their class assignment in reading and math. We have an increasing number of studentsthat are identified as English Learners (EL); this year we have 31 identified EL students. Every student comes to school with differentneeds, but we believe every student deserves the same high-quality education.Pershing offers a variety of classes and activities to enrich the learning environment. They include: Field trips and speakers brought into classrooms to Chess Club offered at lunch on a weekly basisenrich grade level instruction. Mad Science Club offered after school Band and Choir for upper grades Early Engineers offered after school Discovery Club before and after school child care Family activities like the Meet and Greet Breakfast in the PTO sponsored assemblies focusing on fine arts andfall, Spring Carnival, Book Fairs, and Family Nightsbullying preventionfocused around topics such as math, science, literacy and A full-time media technician that runs our librarywriting. After school baseball run through Orangevale PonyLeague2015-16 School Accountability Report Card for Pershing Elementary SchoolPage 2 of 12
Student Enrollment by Grade Level (School Year 2015-16)GradeLevelNumber ofStudentsKindergarten75Grade 1Student Enrollment by Group (School Year 2015-16)StudentGroupPercent ofTotal Enrollment2.450Black or AfricanAmericanAmerican IndianGrade 289orAlaska NativeAsian11.4Grade 386Filipino1.7Grade 468Hispanic or Latino15.1Grade 51020Grade 667Native HawaiianorPacific IslanderWhiteTotal Enrollment5370.468.3Two or gedLearners6.1Students withDisabilitiesFoster Youth9.70.4A. Conditions of LearningState Priority: BasicThe SARC provides the following information relevant to the Basic State Priority (Priority 1): Degree to which teachers are appropriately assigned and fully credentialed in the subject area and for the pupils they areteaching; Pupils have access to standards-aligned instructional materials; and School facilities are maintained in good repair.Teacher 6-172016-17With Full Credential2025231814Without Full Credential00033Teaching Outside Subject Area of Competence (with full credential)00029Teacher Misassignments and Vacant Teacher nts of Teachers of English Learners000Total Teacher Misassignments *000Vacant Teacher Positions000Note: “Misassignments” refers to the number of positions filled by teachers who lack legal authorization to teach that grade level, subject area, student group, etc.* Total Teacher Misassignments includes the number of Misassignments of Teachers of English Learners.2015-16 School Accountability Report Card for Pershing Elementary SchoolPage 3 of 12
Core Academic Classes Taught by Highly Qualified Teachers (School Year 2015-16)Location of ClassesPercent of Classes In Core Academic SubjectsTaught by Highly Qualified TeachersNot Taught by Highly Qualified TeachersThis School100.00.0All Schools in District86.213.8High-Poverty Schools in District83.916.1Low-Poverty Schools in District96.33.7Note: High-poverty schools are defined as those schools with student eligibility of approximately 40 percent or more in the free and reduced price meals program.Low-poverty schools are those with student eligibility of approximately 39 percent or less in the free and reduced price meals program.Quality, Currency, Availability of Textbooks and Instructional Materials (School Year 2016-17)Year and month in which data were collected: September 22, 2015San Juan Unified held a public hearing on September 22, 2015 and determined that each school within the district had sufficient andgood quality textbooks, instructional materials, or science lab equipment pursuant to the settlement of Williams vs. the State ofCalifornia. All students, including English learners, are given their own individual standards-aligned textbooks or instructionalmaterials, or both, in core subjects for use in the classroom and to take home. Textbooks and supplementary materials are adoptedaccording to a cycle developed by the California Department of Education, making the textbooks used in the school the most currentavailable. Materials approved for use by the State are reviewed by all teachers and a recommendation is made to the School Board bya selection committee composed of teachers and administrators. All recommended materials are available for parent examination atthe district office prior to adoption. The table displays information collected in September 2015 about the quality, currency, andavailability of the standards-aligned textbooks and other instructional materials used at the school. If you would like more informationon the textbooks and instructional materials please visit our website: http://www.sanjuan.edu/Page/23485In July 2009, EC Section 60200.7, delayed all instructional materials adoptions and the development of curriculum frameworks andevaluation criteria until the 2015-16 school year. Since then the State Board of Education has adopted frameworks for ELA/ELD, Mathand Social Sciences, and has identified an approved list of instructional materials available for adoption. For more books and Instructional Materials/Year of AdoptionFromMost RecentAdoption?Percent of StudentsLacking OwnAssigned CopyReading/Language Arts2003: Houghton Mifflin- Legacy of Literature2003 Pearson: Timeless Voices, Timeless ThemesYes0.0Mathematics2009: Houghton Mifflin - California Math2015: Pearson - Envision Math2015 Houghton Mifflin Harcourt: Go MathYes0.0Science2007: Delta Education - FOSS2007: Glencoe/McGraw Hill - Focus on Earth2008 Glencoe/McGraw Hill - Focus onEarth/Life/Physical Science2008 Pearson: BiologyYes0.0History-Social Science2005: Teacher's Curriculum Institute (TCI) - HistoryAlive2006: Scott Foresman/Pearson - History - SocialScience for CaliforniaYes0.02015-16 School Accountability Report Card for Pershing Elementary SchoolPage 4 of 12
School Facility Conditions and Planned Improvements (Most Recent Year)Pershing Elementary School was modernized during the 1999-2000 school year. The scope included interior, and some exteriorpainting, window system replacement, a new chiller, new doors with handicapped accessible hardware, restroom restoration, andelectrical infrastructure upgrade to provide for internet, cable, telephone, fire, and intrusion. Currently, there is sufficient space tohouse the student population. Discovery Club has a separate classroom. There is a site custodial staff that cleans the building, alongwith district support for major/minor repairs. The district provides gardening and landscape services on a regular schedule. Regularfire/emergency drills are held, and badges are required for all visitors and personnel. Field repair and irrigation system retrofit continueto be a concern. In the summer of 2005 the site received ventilator replacement to all rooms along with HVAC replacement to theoffice and library. The new parking lot was completed during the summer of 2009 including a new drive-through and drop-off area.The playgrounds were resealed and striped in September of 2010.The Board of Education and the Superintendent's policy is to ensure that all students are provided with a safe and well-maintainedlearning environment. The board approved resolutions in 1998 and 2002 to adequately fund maintenance activities and preserve therepairs and improvements funded by two facility bond measures. The school buildings, classrooms and grounds are safe, clean andfunctional. An inspection of the facility was conducted in October 2016 and determined that there were no unsafe conditions thatrequired emergency repairs. District maintenance staff ensures that the repairs necessary to keep the school in good repair andworking order are completed in a timely manner. A computer automated work order process is used to ensure efficient service andthat emergency repairs and health and safety repairs are given the highest priority. The Board of Education has adopted cleaningstandards and custodial staffing requirements for all schools in the district. This school meets the Board's standards for custodialstaffing and cleanliness. The school's custodians are trained in the proper use of cleaning chemicals and Integrated Pest Managementtechniques. They are managed day to day by the Principal with assistance from the district's maintenance department. The districtparticipates in the State School Deferred Maintenance Program, with funding allocated for major repair or replacement of existingschool building components. Typically, this includes roofing, plumbing, heating, air conditioning, electrical systems, interior or exteriorpainting, and floor systems. Annually the district budgets 2 million dollars for deferred maintenance activities.School Facility Good Repair Status (Most Recent Year)School Facility Good Repair Status (Most Recent Year)Year and month of the most recent FIT report: 10/31/2016Repair StatusSystem InspectedGoodSystems: Gas Leaks, Mechanical/HVAC,SewerXInterior: Interior SurfacesXCleanliness: Overall Cleanliness, Pest/Vermin InfestationXElectrical: ElectricalXRestrooms/Fountains: Restrooms, Sinks/FountainsXSafety: Fire Safety, Hazardous MaterialsXStructural: Structural Damage, RoofsXExternal: Playground/School Grounds,Windows/ Doors/Gates/FencesXFairPoorRepair Needed andAction Taken or PlannedOverall Facility Rating (Most Recent Year)Year and month of the most recent FIT report: 10/31/2016Overall RatingExemplaryGoodFairPoorX2015-16 School Accountability Report Card for Pershing Elementary SchoolPage 5 of 12
B. Pupil OutcomesState Priority: Pupil AchievementThe SARC provides the following information relevant to the State priority: Pupil Achievement (Priority 4): Statewide assessments (i.e., California Assessment of Student Performance and Progress [CAASPP] System, which includes theSmarter Balanced Summative Assessments for students in the general education population and the California AlternateAssessments [CAAs] for English language arts/literacy [ELA] and mathematics given in grades three through eight and gradeeleven. The CAAs have replaced the California Alternate Performance Assessment [CAPA] for ELA and mathematics, which wereeliminated in 2015. Only eligible students may participate in the administration of the CAAs. CAA items are aligned withalternate achievement standards, which are linked with the Common Core State Standards [CCSS] for students with significantcognitive disabilities); and The percentage of students who have successfully completed courses that satisfy the requirements for entrance to theUniversity of California and the California State University, or career technical education sequences or programs of studyCAASPP Test Results in English Language Arts/Literacy (ELA) and Mathematics for All StudentsPercent of Students Meeting or Exceeding the State Standards(grades 3-8 and 2015-162014-152015-16English Language te: Percentages are not calculated when the number of students tested is ten or less, either because the number of students in this category is too small forstatistical accuracy or to protect student privacy.CAASPP Test Results in ELA by Student GroupGrades Three through Eight and Grade Eleven (School Year 2015-16)Number of StudentsStudent GroupAll StudentsMaleFemaleAsianHispanic or LatinoWhiteGradePercent of StudentsEnrolledTestedTestedStandard Met 98.362.52015-16 School Accountability Report Card for Pershing Elementary SchoolPage 6 of 12
Number of StudentsStudent GroupSocioeconomically DisadvantagedStudents with DisabilitiesGradePercent of StudentsEnrolledTestedTestedStandard Met 017.451111100.027.3Note: ELA test results include the Smarter Balanced Summative Assessment and the CAA. The “Percent Met or Exceeded” is calculated by taking the total number ofstudents who met or exceeded the standard on the Smarter Balanced Summative Assessment plus the total number of students who met the standard on the CAAsdivided by the total number of students who participated in both assessments.Double dashes (--) appear in the table when the number of students is ten or less, either because the number of students in this category is too small for statisticalaccuracy or to protect student privacy.Note: The number of students tested includes all students who participated in the test whether they received a score or not; however, the number of students testedis not the number that was used to calculate the achievement level percentages. The achievement level percentages are calculated using only students who receivedscores.CAASPP Test Results in Mathematics by Student GroupGrades Three through Eight and Grade Eleven (School Year 2015-16)Number of StudentsStudent GroupAll StudentsMaleFemaleAsianHispanic or LatinoWhiteGradePercent of StudentsEnrolledTestedTestedStandard Met 5757100.063.244343100.067.42015-16 School Accountability Report Card for Pershing Elementary SchoolPage 7 of 12
Number of StudentsStudent GroupGradeSocioeconomically DisadvantagedStudents with DisabilitiesPercent of StudentsEnrolledTestedTestedStandard Met .045.5Note: Mathematics test results include the Smarter Balanced Summative Assessment and the CAA. The “Percent Met or Exceeded” is calculated by taking the totalnumber of students who met or exceeded the standard on the Smarter Balanced Summative Assessment plus the total number of students who met the standard onthe CAAs divided by the total number of students who participated in both assessments.Double dashes (--) appear in the table when the number of students is ten or less, either because the number of students in this category is too small for statisticalaccuracy or to protect student privacy.Note: The number of students tested includes all students who participated in the test whether they received a score or not; however, the number of students testedis not the number that was used to calculate the achievement level percentages. The achievement level percentages are calculated using only students who receivedscores.CAASPP Test Results in Science for All StudentsPercent of Students Scoring at Proficient or Advanced(meeting or exceeding the state 37987615756605654Science (grades 5, 8, and 10)Note: Science test results include California Standards Tests (CSTs), California Modified Assessment (CMA), and California Alternate Performance Assessment (CAPA)in grades five, eight, and ten.Note: Scores are not shown when the number of students tested is ten or less, either because the number of students in this category is too small for statisticalaccuracy or to protect student privacy.CAASPP Test Results in Science by Student GroupGrades Five, Eight, and Ten (School Year 2015-16)TotalEnrollment# of Studentswith Valid Scores% of Studentswith Valid Scores% of StudentsProficient orAdvancedAll conomically Disadvantaged3535100.071.4Students with Disabilities1111100.072.7StudentGroupNote: Science test results include CSTs, CMA, and CAPA in grades five, eight, and ten. The “Proficient or Advanced” is calculated by taking the total number ofstudents who scored at Proficient or Advanced on the science assessment divided by the total number of students with valid scores.Note: Scores are not shown when the number of students tested is ten or less, either because the number of students in this category is too small for statisticalaccuracy or to protect student privacy.2015-16 School Accountability Report Card for Pershing Elementary SchoolPage 8 of 12
State Priority: Other Pupil OutcomesThe SARC provides the following information relevant to the Other Pupil Outcomes State Priority (Priority 8): Pupil outcomes in the subject areas of physical education.California Physical Fitness Test Results (School Year 2015-16)Percent of Students Meeting Fitness StandardsGradeLevelFour of Six StandardsFive of Six StandardsSix of Six Standards---5---13.320.427.6Note: Percentages are not calculated when the number of students tested is ten or less, either because the number of students in this category is too small forstatistical accuracy or to protect student privacy.C. EngagementState Priority: Parental InvolvementThe SARC provides the following information relevant to the Parental Involvement State Priority (Priority 3): Efforts the school district makes to seek parent input in making decisions for the school district and each schoolsite.Opportunities for Parental Involvement (School Year 2016-17)Parents or community members who wish to participate on school committees, school activities, or become a volunteer may contactPershing Elementary at 916-867-2076 or email the principal, Kendra Shelton, at kendra.shelton@sanjuan.edu.Parent participation is welcomed and valued at Pershing Elementary School. Parents are highly visible as they assist and support theteachers and students. Parent leadership on our School Site Council and Parent Teacher Organization (PTO) makes possible manyprograms, such as the district Art Docent Program. Parents also provide district feedback and input at the Superintendent’s Advisorymeetings throughout the year. The PTO is very active and coordinates volunteer activities, which benefit the entire student body. Thefollowing activities are very successful because of our strong parent commitment: Spring Carnival PTO sponsored school assemblies and activities Annual Fundraising Performing Arts and Stage Productions Family Nights at various restaurants Student Recognition Programs Family Learning Nights (math, science, physical Scholarships, Author Day and the Reflections Programeducation, literacy and bullying prevention)are only made possible because of strong parent Classroom Art Docentparticipation. School beautification Pershing Pacers - a physical fitness running program Classroom field tripsoffered 3 days a week at recessState Priority: School ClimateThe SARC provides the following information relevant to the School Climate State Priority (Priority 6): Pupil suspension rates; Pupil expulsion rates; and Other local measures on the sense of safety.Suspensions and s-------3.70.00.00.00.10.10.10.10.12015-16 School Accountability Report Card for Pershing Elementary SchoolPage 9 of 12
School Safety Plan (School Year 2016-17)This school is linked directly to the San Juan Unified School District’s Safe Schools Program. In partnership with the Sacramento CountySheriff’s Department and the City of Citrus Heights Police Department (CHPD), each school becomes part of a safety zone that ispatrolled daily by a sheriff’s deputy or CHPD officer. The Deputy Sheriffs are assigned to specific schools which are identified bygeographic zones. The Deputy Sheriffs may move from one the geographic zone to another as safety needs dictate. The CHPD PoliceOfficers work identified schools within the City of Citrus Heights and respond as safety needs dictate. The Deputy Sheriff’s and/orCHPD Officers are dispatched to critical incidents via the Safe Schools Dispatcher, a law enforcement dispatcher or via a direct reportfrom a school staff member, school visitor or other person. In addition to daily support from a designated Sheriff’s deputy or CHPDofficer, this school is a part of the San Juan Unified School District’s Safe Schools Task Force, which is comprised of safety teams fromeach of the school sites. Each school safety team meets regularly to discuss safety issues, update their site emergency plans, and totake steps to be proactive in preventing various types of school-related safety issues. Law enforcement provides speakers to addressstudents, staff and community groups.Our safety team receives regular training through the Safe Schools Task Force. Each school site is responsible for updating theirComprehensive School Safety Plan (CSSP) by March 1st of every year. As part of the update, each school site meets at least once peryear with a law enforcement officer to review the CSSP and they hold a community meeting to review the CSSP. The CSSP must beapproved by the School Site Council before being submitted to the district Safe Schools Manager. Every San Juan classroom has astandardized “Safety Folder” which serves as a guide for teachers, includes the site specific crisis response procedures and a districtstandardized emergency flip chart. Each school site conducts and keeps a record of all fire drills, lock down drills, shelter in place drillsand/or earthquake drills up to or in excess of what is required by State law. This school meets or exceeds the Education Coderequirements for fire drills and lock down drills.Pershing School Safety plan was discussed, updated and approved by Faculty and School Site Council on March 6, 2015. PershingSchool Safety Plan's encompasses procedures and protocols for fire preparedness training, intruder's on campus, safe routes to andfrom classrooms, anti-bullying efforts and lock-down training for earthquake or natural disasters.D. Other SARC InformationThe information in this section is required to be in the SARC but is not included in the state priorities for LCFF.Federal Intervention Program (School Year 2016-17)IndicatorSchoolDistrictProgram Improvement StatusIn PIFirst Year of Program Improvement2008-2009Year in Program Improvement*Year 3Number of Schools Currently in Program ImprovementN/A17Percent of Schools Currently in Program ImprovementN/A65.4Note: Cells with N/A values do not require data.Average Class Size and Class Size Distribution umber of Classes1-2021-3233 Avg.ClassSize2015-16Number of Classes1-2021-3233 Avg.ClassSizeNumber of 30330343312322132253333433462732632633 133Number of classes indicates how many classes fall into each size category (a range of total students per class).2015-16 School Accountability Report Card for Pershing Elementary SchoolPage 10 of 12
Academic Counselors and Other Support Staff (School Year 2015-16)Number of FTEAssigned to SchoolAverage Number of Students perAcademic CounselorAcademic Counselor-------00Counselor (Social/Behavioral or Career Development)0N/ALibrary Media Teacher (Librarian)1N/ALibrary Media Services Staff al ge/Hearing Specialist.5N/AResource Specialist-------1N/A.6875N/AOther------Note: Cells with N/A values do not require data.*One Full Time Equivalent (FTE) equals one staff member working full time; one FTE could also represent two staff members who each work 50 percent of full time.Expenditures per Pupil and School Site Teacher Salaries (Fiscal Year 2014-15)Expenditures Per dAverageTeacherSalarySchool Site-------50653384727 66,488District-------N/AN/A 5,013 74,317Percent Difference: School Site and DistrictN/AN/A-5.7-7.1State-------N/AN/A 5,677 75,837Percent Difference: School Site and StateN/AN/A-11.6-8.9LevelNote: Cells with N/A values do not require data.Types of Services Funded (Fiscal Year 2015-16)The table provides a comparison of a school’s per pupil funding from unrestricted sources with other schools in the district andthroughout the state.Supplemental/Restricted expenditures come from money whose use is controlled by law or donor. Money designated for specificpurposes by the district or governing board is not considered restricted. Basic/unrestricted expenditures, except for general guidelines,is not controlled by law or donor.For detailed information on school expenditures for all districts in California, see the CDE Current Expense of Education & Per-pupilSpending Web page at http://www.cde.ca.gov/ds/fd/ec/. For information on teacher salaries for all districts in California, see the CDECertificated Salaries & Benefits Web page at http://www.cde.ca.gov/ds/fd/cs/. To look up expenditures and salaries for a specificschool district, see the Ed-Data Web site at: http://www.ed-data.org.In FY 2011-12, the district spent 7,732,354 in restricted generalfund for positions that would have usually been paid for by unrestricted dollars (SF-0) due to receiving American Recovery andReinvestment Act (ARRA) Education Jobs Funds (EJF). The positions that were pa
2015-16 School Accountability Report Card for Pershing Elementary School Page 1 of 12 Pershing Elementary School School Accountability Report Card Reported Using Data from the 2015-16 School Year Published During 2016-17 By February 1 of each year, every school in California is required by state law to publish a School Accountability Report .