Transcription
Advancements In Over-The-AirTesting of Multi-format WirelessDevicesDerek Skousen, BluetestApril 2014 IEEE EMC Santa Clara
The Wireless Evolution More and more equipment becomes wireless Increased need for capacity, speed & reliability Moore’s Law Hits at the Wireless Spectrum “Domain Expansion”: Frequency, Time, Code, Spatial MIMO and Rake Receivers Devices use multiple communication standards. LTE, Wi-Fi, Bluetooth etc. Often at the same time .or multiple carriers/radios on the same standard LTE Carrier AggregationApril 2014 IEEE EMC Santa Clara
Transmission Environment ShiftWireless communication used to be directional and line of sight–Antenna radiation patterns were verified in large and expensive anechoic chambersBut that has changed with 2G, 3G, 4G ––No specific direction of the received radio signalMultipath fading environment is the key enabler for MIMOsystems like 4G (LTE, WiMAX) and WLAN (802.11n)System Design for a Rich Isotropic Multipath Environment:––––Spatial Domain LeverageHigh Throughput Expectations under challenging environmentsIncreased blending of digital chipsets with RF and packagingLTE, WLAN and other MIMO devices measured as easy as 2G and 3G devicesApril 2014 IEEE EMC Santa Clara
Why Measure OTA Device Performance?The component manufacturer benefit– For antenna manufacturers: Ensure maximized efficiency, diversity/MIMO gainand optimized antenna location– For chipset manufacturers: Verify RF properties and transceiver algorithmsApril 2014 IEEE EMC Santa Clara
Why Measure OTA Device Performance?The device manufacturer benefit– RF performance of the complete device can beoptimized from chip to antenna– Increase end user satisfaction by ensuring bestpossible receiver, transmitter and throughputperformance– Comply with regulator and operator requirementsApril 2014 IEEE EMC Santa Clara
Why Measure OTA Device Performance?The operator benefit– Select what devices and accessories toendorse/promote– A better performing device can reducenetwork load as much as 10-20% Increasednetwork capacity and revenue!– A better performing device increase end usersatisfaction and reduce customer complaintsApril 2014 IEEE EMC Santa Clara
Why Measure OTA Device Performance? With OTA tests, the entire TX and RX chain is evaluated forperformance Conducted tests evaluate pass/fail conformance but stop at the conductedports of the device Every wireless enabled device with cellular functionality needs to bethoroughly tested and certified Devices with pre-certified radio modules do not need to reevaluated/certified for conducted conformance Some OTA solutions provide fast system performance metrics fordesign verification and optimizationApril 2014 IEEE EMC Santa Clara
OTA Testing: 3D, Anechoic Evaluation In order to characterize the DUT for alarge variety of angles of arrival (AoA),radiation characteristics have so far beencaptured in a full 3D fashion Elevation Azimuth Polarization Test environment: Anechoic chambersApril 2014 IEEE EMC Santa Clara
Definition: Isotropy Isotropic environment Any angle of arrival equally probable Any polarization equally probable Average power equal in each direction andpolarization Statistical Property: Valid over the averageof multiple incident waves Instantaneous field notisotropicApril 2014 IEEE EMC Santa Clara
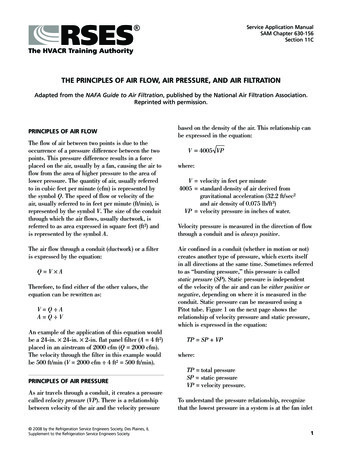
History of OTA System Architectures Anechoic OTA testing started with Combined Axis Systems (Great Circle method)Testantennais fixedDUT is turning inazimuth andelevationApril 2014 IEEE EMC Santa Clara
History of Anechoic System Architectures Later, Distributed Axis System (Conical Cut method) became more popularDUT is turning inazimuthSingle test antennamoving along elevationplaneApril 2014 IEEE EMC Santa ClaraMultiple probes alongelevation plane
Base OTA Tests TRP Total Radiated Power How well does my transmitter and transmitter antenna designwork? TIS – Total Isotropic Sensitivity How well does my receiver and receiver antenna work?April 2014 IEEE EMC Santa Clara
MIMO OTA Testing: Biggest Model Shift The industry felt that new measurement approaches were requiredfor MIMO OTA performance evaluation Introduction of multipath radio channels was considered necessary toaccurately determine the system performance of antennas and spatialdiversity receiver A variety of standardization groups, e.g., CTIA and 3GPP RAN4, havebeen working on suitable techniques for several yearsApril 2014 IEEE EMC Santa Clara
MIMO OTA Testing: Biggest Model Shift The industry proposed a variety of approaches that directly andindirectly measured the device MIMO OTA performance Direct Measurement Techniques: Anechoic Chamber Multi-Probe Methods Reverberation Chamber Methods Indirect Techniques Decomposition Method Two-Stage MethodApril 2014 IEEE EMC Santa Clara
MIMO OTA Techniques One of the mostprominent approaches isthe multi-probeapproach Ring of dual-polarizedprobes surrounding theDUT Generate channel modelwithin the testzoneApril 2014 IEEE EMC Santa Clara
MIMO OTA Techniques Two-stage Method During the first stage, the DUT records complexreceiver antenna patterns and during thesecond stage convolves that pattern with thedesired channel modelApril 2014 IEEE EMC Santa Clara
MIMO OTA Techniques Decomposition Method Conducted test determines figure of merit of the receiverfor desired channel models while the radiated testdetermines the figure of merit for the MIMO antenna pair.The combination of results from each test yield a figure ofmerit for overall device performanceApril 2014 IEEE EMC Santa Clara
MIMO OTA Techniques In comparison, alternative approaches offer much simpler, lesscomplex, and significantly cheaper solution Two-stage Method Decomposition Method Reverberation Chamber MethodApril 2014 IEEE EMC Santa Clara
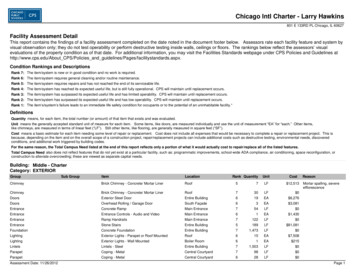
MIMO OTA: The Reverberation Test SystemWalls of reflectivematerialMode stirrers(moves during measurement)3 or 4 Fixed measurement antennaswith different polarizationConnected to a Network Analyzeror a Communication TesterReference antennaMeasurement PC withsystem control softwareTest Object (DUT)Radio Communication TesterTurntable(moves during measurement)Access PanelApril 2014 IEEE EMC Santa Clara
Stirring Effects Reverberation Chamber Stirring change boundary conditions and thus shift the eigenfrequencies ofthe resonant modes Stirring increases the mode density at measurement frequency The more effective the stirring, the higher the mode densityResonance frequencies Bluetest RC800Number of modes6Df01800182018401860Frequency MHzApril 2014 IEEE EMC Santa Clara18801900
Simulated Rayleigh Field DistributionInstantaneous signal level will differ over time and withposition in the chamber (Rayleigh faded signal) but theaverage over time is the same regardless of position in thechamber (within certain limits)April 2014 IEEE EMC Santa Clara
Useful Properties of the Reverberation Chamber Creates scattering environment Average transmission level inchamber proportional to Total radiated power Radiation efficiency of antenna Isotropic field environment whenaveraged over large number ofindependent field samples
Inherent Chamber Environment– Reverberation Chamber: NIST ChannelModel Pedestrian speedsLow delay spreadLow correlation between MIMO channelsFull 3D evaluation with polarization balanceWith or without interferenceConditions often found for example in indoorenvironmentsApril 2014 IEEE EMC Santa Clara
Adding a Channel Emulator Reverberation Chamber Channel Emulator (RC CE) Can be used to emulate more advanced situations For example: Introduce high speed Doppler shiftModify the power delay profile (PDP)Adjust Base Station antenna configuration and correlation3GPP UMa-IS/UMi-IS channelsApril 2014 IEEE EMC Santa Clara
Angle Of Arrival The Angle of Arrival setting in the CE is not used The RC automatically provides a full 3D evaluation of the device The AoA in RC is isotropic in average, i.e over many samples An individual sample will not be isotropic – it will have a distribution of AoA 3D Isotropic versions of UMa and UMi UMi-IS: Isotropic short delay spread low correlation channel model UMa-IS: Isotropic long delay spread high correlation channel modelApril 2014 IEEE EMC Santa ClaraIsotropic
Measurement Setup4-port Measurement AntennaUplink Receive AntennaControl PC with BluetestMeasurement SuiteRadio CommunicationTesterChannel EmulatorTested DeviceReverberation ChamberDownlinkApril 2014 IEEE EMC Santa ClaraUplink
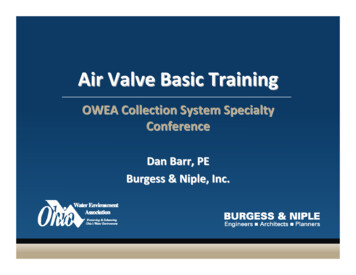
Example Results TPUT for a phone in NIST (Black) UMi-IS (Blue) UMa-IS (Red) More difficult conditionsmainly in UMa-IS Higher correlationbetween MIMO channelsApril 2014 IEEE EMC Santa Clara
C: IL/IT Results Consistency Goal: Inter-lab repeatability within CTIA SISO uncertainty ( /- 2.3 dB) Align results to conducted reference within CTIA SISO uncertainty ( /- 2.3 dB)April 2014 IEEE EMC Santa Clara
C: IL/IT Results Consistency RC - NIST100.095.0Throughput 0-100.00-98.00-96.00-94.00RS EPRE (dBm/15kHz)April 2014 IEEE EMC Santa Clara-92.00-90.00
C: IL/IT Results Consistency100.0 RC – UMi95.0Throughput (%)90.0AZ DeviceB Nom SD rad85.0AZ Device A Nom cond SD abs data tput100.080.095.075.090.070.0BT hTC Nom SD rad-110-108-106-104-102-100-98-96-94-92-90RS EPRE (dBm/15kHz)85.0AZ hTC Good SD rad100.0AZ hTC Good cond SD abs data tput80.095.0BT hTC Good SD rad75.090.0BT hTC Good cond SD abs data tput70.0-110-108-106-104-102RS EPRE (dBm/15kHz)-100-98-96Throughput (%)Throughput (%)BT hTC Nom cond SD abs data tputAZ DeviceA Bad SD rad85.0AZ DeviceB Bad SD rad80.0AZ Device A Bad cond SD abs data tputBT hTC Bad SD rad75.0BT hTC Bad cond SD abs data tput70.0-105-103-101-99-97-95-93RS EPRE (dBm/15kHz)April 2014 IEEE EMC Santa Clara-91-89-87-85
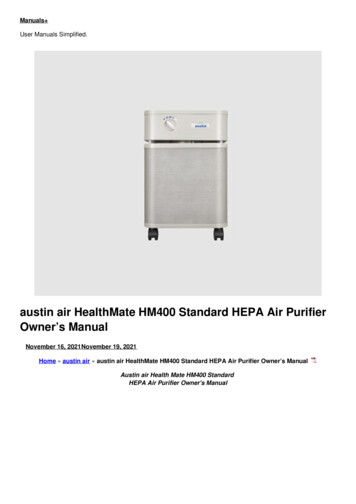
C: IL/IT Results Consistency100.0 RC –UMa95.0Throughput (%)90.0AZ Device A Nom cond LD abs data tput100.080.095.075.090.0BT hTC Nom LD radBT hTC Nom cond LD abs data tput70.0-108-106-104-102-100-98-96-94-92-90RS EPRE (dBm/15kHz)AZ DeviceB Good LD rad85.0100.0AZ Device A Good cond LD abs data tput80.095.0BT hTC Good LD rad75.090.0BT hTC Good cond LD abs data tput70.0-110-108-106-104-102-100-98RS EPRE (dBm/15kHz)-96-94-92-90Throughput (%)Throughput (%)AZ DeviceB Nom LD rad85.0AZ DeviceB Bad LD rad85.0AZ Device A Bad cond LD abs data tput80.0BT hTC Bad LD rad75.0BT hTC Bad cond LD abs data tput70.0-100-98-96-94-92-90-88RS EPRE (dBm/15kHz)April 2014 IEEE EMC Santa Clara-86-84-82-80
Integration and Extension System efficiency Diversity & MIMO gainExisting: TRP Total Radiated Power– How well does my transmitter and transmitterantenna design work?Existing: TIS – Total Isotropic Sensitivity– How well does my receiver and receiver antennawork?Available: Throughput– Data throughput vs signal level, on IP and/or MAClayer– Multi-format, Carrier-AggregationExtension: Coordinated Solutions– Conducted Tests– Drive Test SystemsApril 2014 IEEE EMC Santa Clara
OTA Application Evolution CurveTechnology evolutionAutomotiveapplicationsExtendedBase StationLive Walkthrough Channel ModelsTestingTestsMU-MIMO4x4 MIMOLTE-CA8x8 MIMOThroughput measurements“Data enabled”2x2 LTE MIMOExtended frequency rangeEarly RCSolutions20022006WLAN ThroughputTest Instrument4G All major wirelessstandards covered3GImproved accuracy2004Virtual Drive Test20082010April 2014 IEEE EMC Santa Clara20122014
The Promise of OTABridging the divide to solve complexity challengesConducted Focused Analytical Reduction ofVariables HighRepeatabilityOTA Device Level ReferenceEnvironment Lab Access IncreasedRepeatabilityApril 2014 IEEE EMC Santa ClaraDrive Test Large SystemRealistic Env.IntegrativeHigh VariationLimitedRepeatability
Questions?April 2014 IEEE EMC Santa Clara
BT hTC Nom cond SD abs data tput RS_EPRE (dBm/15kHz)) 70.0 75.0 80.0 85.0 90.0 95.0 100.0-105 -103 -101 -99 -97 -95 -93 -91 -89 -87 -85 AZ DeviceA Bad SD rad AZ DeviceB Bad SD rad AZ Device A Bad cond SD abs data tput BT hTC Bad SD rad BT hTC Bad cond SD abs data tput RS_EPRE (dBm/15kHz)) April 2014 IEEE EMC Santa Clara