Transcription
Barton et al. BMC Pulmonary Medicine (2016) 16:111DOI 10.1186/s12890-016-0274-5RESEARCH ARTICLEOpen AccessAdiposity influences airway wall thicknessand the asthma phenotype of HIVassociated obstructive lung disease: across-sectional studyJulia H. Barton1, Alex Ireland1, Meghan Fitzpatrick1, Cathy Kessinger1, Danielle Camp1, Renee Weinman1,Deborah McMahon1, Joseph K. Leader1, Fernando Holguin1,3, Sally E. Wenzel1, Alison Morris1,2and Matthew R. Gingo1,4*AbstractBackground: Airflow obstruction, which encompasses several phenotypes, is common among HIV-infectedindividuals. Obesity and adipose-related inflammation are associated with both COPD (fixed airflow obstruction) andasthma (reversible airflow obstruction) in HIV-uninfected persons, but the relationship to airway inflammation andairflow obstruction in HIV-infected persons is unknown. The objective of this study was to determine if adiposityand adipose-associated inflammation are associated with airway obstruction phenotypes in HIV-infected persons.Methods: We performed a cross-sectional analysis of 121 HIV-infected individuals assessed with pulmonary functiontesting, chest CT scans for measures of airway wall thickness (wall area percent [WA%]) and adipose tissue volumes(mediastinal and subcutaneous), as well as HIV- and adipose-related inflammatory markers. Participants weredefined as COPD phenotype (post-bronchodilator FEV1/FVC lower limit of normal) or asthma phenotype (doctordiagnosed asthma or bronchodilator response). Pearson correlation coefficients were calculated between adiposemeasurements, WA%, and pulmonary function. Multivariable logistic and linear regression models were used todetermine associations of airflow obstruction and airway remodeling (WA%) with adipose measurements andparticipant characteristics.Results: Twenty-three (19 %) participants were classified as the COPD phenotype and 33 (27 %) were classified asthe asthma phenotype. Body mass index (BMI) was similar between those with and without COPD, but higher inthose with asthma compared to those without (mean [SD] 30.7 kg/m2 [8.1] vs. 26.5 kg/m2 [5.3], p 0.008). WA%correlated with greater BMI (r 0.55, p 0.001) and volume of adipose tissue (subcutaneous, r 0.40; p 0.001;mediastinal, r 0.25; p 0.005). Multivariable regression found the COPD phenotype associated with greater ageand pack-years smoking; the asthma phenotype with younger age, female gender, smoking history, and loweradiponectin levels; and greater WA% with greater BMI, younger age, higher soluble CD163, and higher CD4 counts.Conclusions: Adiposity and adipose-related inflammation are associated with an asthma phenotype, but not aCOPD phenotype, of obstructive lung disease in HIV-infected persons. Airway wall thickness is associated withadiposity and inflammation. Adipose-related inflammation may play a role in HIV-associated asthma.Keywords: HIV, Asthma, COPD, Obstructive lung disease, Obesity, Lipodystrophy, Adiponectin* Correspondence: gingomr@upmc.edu1Department of Medicine, University of Pittsburgh, Pittsburgh, USA4Division of Pulmonary, Allergy, and Critical Care Medicine, Department ofMedicine, University of Pittsburgh, 3459 Fifth Avenue, 628 NW, Pittsburgh, PA15213, USAFull list of author information is available at the end of the article 2016 The Author(s). Open Access This article is distributed under the terms of the Creative Commons Attribution 4.0International License (http://creativecommons.org/licenses/by/4.0/), which permits unrestricted use, distribution, andreproduction in any medium, provided you give appropriate credit to the original author(s) and the source, provide a link tothe Creative Commons license, and indicate if changes were made. The Creative Commons Public Domain Dedication o/1.0/) applies to the data made available in this article, unless otherwise stated.
Barton et al. BMC Pulmonary Medicine (2016) 16:111BackgroundObstructive lung disease, encompassing many phenotypes of both fixed and reversible airflow obstruction, iscommon in HIV-infected persons [1–6]. Chronic obstructive pulmonary disease (COPD) in the HIV-infectedpopulation is accelerated in smokers and those withpoor control of the viral load [1, 3, 7, 8]. Asthma is another commonly diagnosed chronic pulmonary diseasein HIV-infected persons [9, 10]. Despite the prevalenceof COPD and asthma in HIV-infected persons, little isknown about their pathogenesis in this population.Obesity influences the development of both COPDand asthma in the HIV-uninfected population. Obesity ismore prevalent in individuals with mild COPD compared to the general population, however, the causal nature of the relationship between obesity and COPD isunclear [11, 12]. Obesity, central adiposity, and aspectsof the metabolic syndrome have been implicated in thepathogenesis of the adult-onset phenotype of asthma[13–17]. Inflammation related to visceral adipose tissueis thought to drive this association [18]. We have previously shown that doctor-diagnosed asthma in HIV isfrequently adult-onset, associated with inflammatorymarkers common in chronic HIV infection, and 2.5times more likely in obese compared to normal weightHIV-infected persons [9].Metabolic effects of HIV and highly-active antiretroviraltherapy (HAART) that lead to central adiposity and alterations in inflammation may be relevant to the pathogenesis of airway obstruction in HIV [19, 20]. Long-term HIVinfection is associated with chronic inflammation andmacrophage activation, measured by high-sensitivity Creactive protein (CRP) and soluble CD163 (sCD163), respectively [21–26]. Increased central adiposity is associated with the alteration of systemic adipokine profiles,including higher leptin (a pro-inflammatory cytokine) andlower adiponectin (an anti-inflammatory cytokine). Adiponectin is lower in HIV-infected persons and in chronicinflammation [27]; and reduced levels of adiponectin havebeen implicated in several HIV-associated co-morbiditiessuch as cardiovascular disease and neurocognitive dysfunction [28–30]. In the HIV-uninfected population, levelsof adiponectin are lower in asthma and paradoxicallyhigher in COPD [31]. The relationship of adiponectin inHIV-associated obstructive lung disease is unknown.Obstructive lung disease can manifest subjectively aspulmonary symptoms or objectively as pulmonary function changes or airway remodeling detectable on computed tomography (CT) scan [32–34]. Asthma is oftendiagnosed by doctors based on episodic, recurrent pulmonary symptoms, such as wheezing. Pulmonary symptoms are more common in HIV-infected individuals withdoctor-diagnosed asthma than those without asthma [9].Airway wall thickening correlates with asthma severity,Page 2 of 10airflow obstruction, and histopathological changes relatedto asthma [35–37]. Airway remodeling quantitatively measured by CT scan has not been assessed in HIV-infectedpersons.In this study, our primary objective was to determinethe relationship of adiposity and adipose-related inflammation with obstructive lung disease phenotypes inHIV-infected persons. Our secondary objective was todetermine the relationship of adiposity and its associatedinflammation with airway remodeling, as measured byairway wall thickness on CT imaging, in HIV-infectedpersons. We hypothesized that visceral (mediastinal) adipose tissue and adipose-associated inflammatory markers(adiponectin and IL-6) would be associated with airwayremodeling and the asthma phenotype of airflow obstruction and no association with the COPD phenotype of airflow obstruction, in HIV-infected persons.MethodsParticipantsThis study was a cross-sectional secondary analysis ofindividuals with documented HIV infection who were18 years of age or older, recruited between July 1, 2007and April 30, 2010 from the HIV/AIDS clinic at the University of Pittsburgh Medical Center using posted advertisements and by contacting patients in a researchregistry. Exclusion criteria included any contraindicationto pulmonary function testing and those with increasedrespiratory symptoms or fevers within the prior 4 weeksto exclude active pulmonary infection. Participants whocompleted a CT scan of the chest in the established cohort were included in this study. A description of thegroup and pulmonary function data from the primaryanalysis has been published previously [2, 9]. Participants signed written informed consent, and the University of Pittsburgh IRB approved the protocol.Data collectionDemographic and clinical data, including age, gender,race, smoking status, and illicit drug use were collectedthrough standardized interviews by research coordinators, and if unable to obtain, were then collectedthrough a review of the medical record. A modified version of the American Thoracic Society (ATS) Division ofLung Diseases questionnaire was used to collect information on respiratory symptoms [38]. Participants completed the questionnaire on the same day as bloodcollection, pulmonary function testing, and CT imaging.A prior diagnosis of asthma was ascertained by askingparticipants if their doctor had ever told them they hadasthma (doctor-diagnosed asthma), in addition to severalother pulmonary-related diseases such as COPD or sarcoidosis [9].
Barton et al. BMC Pulmonary Medicine (2016) 16:111Metabolic, immunologic and serologic parametersHeight and weight were measured to calculate BMI. Induced sputum samples were collected for sputum cellcounts [39]. Peripheral blood samples were collected atthe time of enrollment, and serum or plasma aliquotswere stored at -80C ranging from 2 to 6 years andassayed following a single thaw. Markers of inflammation (interleukin [IL-6], high-sensitivity C-reactive protein [CRP]), monocyte/macrophage activation (sCD163)and the adipokine adiponectin were assayed using ELISA(R&D Systems; Minneapolis, MN). Total IgE was alsomeasured in the clinical laboratory to assess for an association between allergic/atopic measures and prevalentairway obstruction phenotypes. Leptin was not measuredbecause blood samples were obtained in a non-fastingstate. The CD4 T-lymphocyte cell count and the plasmaHIV ribonucleic acid (RNA) level within the prior threemonths were obtained from medical record review.Pulmonary function testingAll participants completed pre- and post-bronchodilatorspirometry (480 μg of albuterol administered through aspacer from a metered-dose inhaler) and single breathdiffusing capacity for carbon monoxide (DLCO) in accordance with ATS standards [40, 41]. The percent predicted forced expiratory volume in 1 second (FEV1) andforced expiratory capacity (FVC) were calculated usingthe Hankinson prediction equations [42]. DLCO percentpredicted was determined using equations from Neas et aland corrected for hemoglobin and carboxyhemoglobin [43].Imaging parametersCT of the chest was used to determine airway wall thickness (WA%) in the smallest one-third of measurable airways. We used a fully automated computer scheme todetect and quantify airway sections depicted in axial section of the CT examination as previously described [44].Mediastinal (a surrogate for visceral adipose tissue inthe chest) and subcutaneous adipose volumes were determined using commercially available software (sliceOmatic,Tomovision; Magog, Canada). The non-contrast chest CTscans, collected as part of the parent study [45], wereprocessed with a standard algorithm in 2.5 mm thickness.Adipose tissue was defined as voxels in Hu range of -190to -30 [46]. The subcutaneous region included this Hurange extending from skin to fascia circumferentially. Theborders of the mediastinum were defined laterally by theedge of the most lateral mediastinal structure (superiorvena cava, right atrium, left ventricle, descending aorta,and main pulmonary artery), anteriorly by the sternum,and posteriorly by the vertebral body or the descendingaorta, whichever was the more anterior structure. The superior margin of the mediastinum was defined by the firstslice inferior to the aortic arch, and the inferior marginPage 3 of 10was defined by the most inferior slice where the diaphragm does not touch the heart.To determine the inter-reader reliability of adiposemeasures, adipose tissue measurements from a subset ofCT scans [10] were measured independently by twodifferent investigators (JHB, MRG), blinded to patientcharacteristics.Statistical analysisParticipants were classified as having a COPD phenotypeof airflow obstruction (post-bronchodilator FEV1/FVCless than the lower limit of normal – below the 95 %confidence interval) or an asthma phenotype of airflowobstruction (either doctor-diagnosed asthma or a bronchodilator response on pulmonary function testing in accordance with ATS standards) [47]. We used thiscomposite of doctor-diagnosed asthma or bronchodilator responsiveness because the pulmonary function testing was done for research purposes and did not includeprovocation testing, so participants with treated andwell-controlled asthma may not have had airflow obstruction or reversibility at the time of the study visit.Participants with overlapping definitions of airflow obstruction were included in both the COPD and asthmagroups for analysis.Participant characteristics and measures were summarized for all participants and compared between thosewith and without the COPD phenotype or the asthmaphenotype of airflow obstruction. Data were normalizedusing logarithmic or square root transformation if necessary. Parametric testing was performed with t-test, andranksum test was used for non-parametric comparisons.Categorical and dichotomous variables were comparedbetween those with and without the COPD phenotypeor the asthma phenotype of airflow obstruction usingchi-square test. Pearson correlation coefficients wereused to determine correlations between WA% and lungfunction. To determine inter-reader reliability of CT adipose measures, Lin’s concordance correlation coefficients were calculated for both subcutaneous andmediastinal adipose tissue measures. Multivariable logistic regression was performed to determine if participantcharacteristics (age, gender, race, BMI, smoking status,viral load), adipose measures (subcutaneous and visceraladipose volumes), and inflammatory markers (CRP, adiponectin, IgE) were independently associated with theCOPD phenotype or the asthma phenotype of airflowobstruction. Linear regression was used to determine associations between airflow obstruction and WA% withthe same series of variables used in the logistic regression including participant characteristics, CT adiposemeasures, and inflammatory markers. Stepwise regression was used for both linear and logistic model selection, including variables significant at a level of p 0.1 in
Barton et al. BMC Pulmonary Medicine (2016) 16:111Page 4 of 10univariate analyses. Logistic models were additionallytested for fit with Hosmer-Lemeshow goodness-of-fittest [48]. Statistical analyses were conducted usingStataSE version 13 (StataCorp LP, College Station, TX).ResultsA total of 121 HIV-infected participants were evaluated.Overall, the mean (SD) age of all participants was 45.1(9.8) years, and the majority were men (67.8 %) with ahistory of smoking (82.6 %) (Table 1). Most participantswere on antiretroviral therapy (ART) (87.6 %) with amean CD4 count of 599.1 cells/μL, and 84 (69.5 %) hadan HIV RNA viral level 50 copies/mL. Twenty-three(19 %) participants had the COPD phenotype of airflowobstruction. Thirty-three (27 %) participants were classified as having the asthma phenotype of airflow obstruction; 25 of them had doctor-diagnosed asthma, six ofwhom also had a bronchodilator response, and eightparticipants had a bronchodilator response without priordoctor-diagnosed asthma. Twelve (10 %) participants fitboth definitions of the COPD and asthma phenotypes,and were included in both groups for analysis.Participant characteristics differed between those withand without the COPD phenotype of airflow obstruction. Those with the COPD phenotype were older, hadheavier smoking history as measured by pack-years, andgreater intravenous drug use (Table 1). BMI did not differ between those with and without the COPD phenotype of airflow obstruction (mean [SD] 27.0 kg/m2 [7.9]vs. 27.8 kg/m2 [6.1], p 0.59) (Fig. 1). Participant demographics were similar between those with and withoutthe asthma phenotype of airflow obstruction, except forBMI (mean [SD] 30.7 kg/m2 [8.1] vs. 26.5 kg/m2 [5.3], p 0.008), and female sex (n, 15 vs. 24, p 0.06).Table 1 Participant characteristics by phenotype of airflow obstructionCOPD(n 23)No COPD(n 98)p-valueAsthmaa(n 33)No asthma(n 88)p-value50.4 (5.7)43.9 (10.1) 0.00143.0 (9.5)46.0 (9.8)0.14Female, n (%)6 (26.1)33 (33.7)0.4815 (45.5)24 (27.3)0.06African American, n (%)13 (56.5)53 (54.1)0.8321 (63.6)43 (48.9)0.4327.0 (7.9)27.8 (6.1)0.5830.7 (8.1)26.5 (5.3)0.008Age, mean (SD)2BMI (kg/m ), mean (SD)Smoke status, n (%)0.180.13Never1 (4.4)20 (20.4)2 (6.1)19 (21.6)Former7 (30.4)24 (24.5)21 (23.9)10 (30.3)CurrentPack-years smoked, median (range)15 (65.2)54 (55.1)20.0 (0-102)9.8 (0-45) 0.00121 (63.6)48 (54.6)13.5 (0-102)10.8 (0-75)0.33Intravenous drug use (ever), n (%)3 (13.0)3 (3.1)0.051 (3.0)5 (5.7)0.99Cocaine use (ever), n (%)5 (21.7)23 (23.5)0.865 (15.2)23 (26.1)0.20Marijuana use (ever), n (%)9 (39.1)56 (57.1)0.1215 (45.5)50 (56.8)0.26HAART use, n (%)21 (91.3)85 (86.7)0.5528 (84.9)78 (88.6)0.57578.6 (270.4)603.5 (339.6)0.75596.7 (299.1)599.9 (338.6)0.9616 (69.6)68 (69.4)0.9919 (57.6)65 (73.9)0.08Doctor-diagnosed asthma8 (34.8)17 (17.4)0.9925 (75.8)0naBronchodilator response6 (26.1)8 (8.2)0.0214 (42.4)0naCough9 (39.1)26 (26.5)0.2314 (42.4)21 (23.9)0.05Phlegm9 (39.1)38 (38.8)0.9814 (42.4)33 (37.5)0.62Wheeze12 (52.2)31 (31.6)0.0619 (57.6)24 (27.3)0.002Dyspnea10 (43.5)35 (35.7)0.4914 (42.4)31 (35.2)0.47CD4 count (cells/μl), mean (SD)HIV RNA level 50copies/mL, n (%)pre-BD FEV1 %pred, mean (SD)72.6 (19.0)95.8 (16.7) 0.00177.7 (20.6)96.5 (16.2) 0.001pre-BD FEV1/FVC, mean (SD)0.61 (0.09)0.78 (0.06) 0.0010.69 (0.12)0.77 (0.08) 0.001 0.0010.73 (0.12)0.80 (0.08)0.00312 (36.4)11 (12.5)0.0030.63 (0.13)0.67 (0.14)0.13post-BD FEV1/FVC, mean (SD)0.62 (0.08)0.81 (0.06)post-BD FEV1/FVC LLN, n (%)23 (100)0 (0)DLco % predicted, mean (SD)0.57 (0.15)0.68 (0.13)na 0.001Abbreviations: SD Standard deviation, BMI Body Mass Index, HAART Highly active antiretroviral therapy, BD Bronchodilator, FEV1 Forced expiratory volume in1 second, FVC Forced vital capacity, %pred Percent predicted, LLN Lower limit of normal, DLco Diffusion capacity of the lung for carbon monoxideaAsthma phenotype is defined by a history of doctor-diagnosed asthma or a bronchodilator response during pulmonary function testing (Increase in FEV1 or FVCof greater than 200 ml and 12 %)
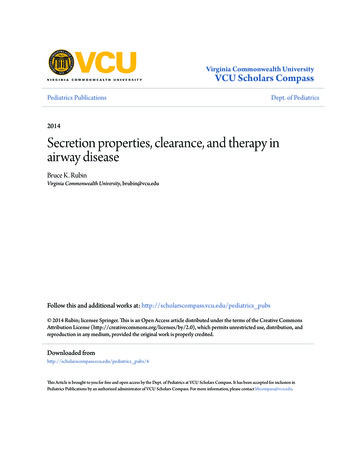
Barton et al. BMC Pulmonary Medicine (2016) 16:111Page 5 of 10Fig. 1 Mean and standard deviation (error bar) of body mass index (BMI) (a), diffusing capacity of carbon monoxide (DLCO) % predicted (b), andwall area % (c) in those with and without a COPD phenotype of airflow obstruction (post-bronchodilator forced expiratory volume at 1 second/forced vital capacity less than the lower limit of normal) and in those with and without an asthma phenotype of airflow obstruction (doctordiagnosed asthma or bronchodilator response)Those with the COPD phenotype had lower pre- andpost-bronchodilator FEV1 %predicted and FEV1/FVC asexpected by definition, compared to those without COPD.The participants with the asthma phenotype of obstruction had lower pre-BD FEV1 (78 %[21] vs. 97 %[16]; p 0.001) and pre-BD FEV1/FVC (69 %[12] vs. 77 %[8]; p 0.001) compared to those without asthma. DLCO wasmoderately reduced amongst all participants (mean,66 %); however, it was lower in participants with theCOPD phenotype compared to those without COPD(57 %[15] vs. 68 %[13], p 0.001). DLCO was no differentin those with the asthma phenotype of obstruction compared to those without asthma (63 %[13] vs. 67 %[14], p 0.13) (Fig. 1).Several inflammatory markers were different betweenthe two phenotypes of airflow obstruction (Table 2).CRP levels were higher in participants with both phenotypes of airflow obstruction (COPD p 0.04, asthma p 0.04) versus those without airflow obstruction. The totalIgE level was elevated in the asthma phenotype group ofairflow obstruction (p 0.03); however, there was no difference in the number of participants with elevated sputum eosinophils. Adiponectin tended to be lower in theasthma phenotype group compared to those withoutasthma (p 0.07). There was no difference in the level ofsCD163 amongst all participants. There was no difference in the level of IL-6 between those with or withoutCOPD, however, those with the asthma phenotype ofTable 2 Inflammatory markers and CT measurements by phenotype of airflow obstructionCOPD(n 23)Sputum eosinophils 1.53 %, (n 108)bNo COPD(n 98)p-valueAsthmaa(n 33)No asthma(n 88)p-value3 (13.6)8 (9.3)0.555 (16.1)6 (7.8)0.20Sputum neutrophils (%), mean (SD)55.9 (19.6)50.6 (19.6)0.2750.0 (22.4)52.4 (18.5)0.57C-reactive protein (mg/L), median (range)(n 117)3.4 (0-74.2)1.1 (0-107.6)0.042.3 (0-77.6)1.1 (0-107.6)0.04IgE level (IU/mL) median (range) (n 116)33.8 (2.2-1359.0)41.5 (0.8-2758.5)0.6083.9 (5.1-1447.0)28.7 (0.8-2758.5)0.03Soluble CD163 (ng/mL), median (range)(n 103)IL-6 median, n (%) (n 98)Adiponectin (ng/mL), median (range)(n 115)Wall area % (n 117), mean (SD)SubQ adipose volume (cm3), median (range)c3Mediastinal adipose volume (cm ), median(range)cMediastinal/SubQ, median (range)887.9 (381.5-1999.3) 670.0 (180.1-2381.5)0.22726.9 (324.1-2193.1) 682.5 (180.1-2381.5)0.1111 (64.7)38 (46.9)0.1819 (67.9)30 (42.9)0.035038 (0-14590)2822 (0-22611)0.102195 (0-12663)3713 (0-22611)0.0747.6 (4.4)47.9 (5.7)0.8451.0 (4.7)46.8 (5.3) 0.00122.9 (3.4-66.8)26.8 (2.9-85.1)0.3033.3 (4.0-85.1)22.1 (2.9-77.7)0.0043.3 (1.8-13.9)4.0 (1.1-13.5)0.403.9 (1.4-13.9)4.0 (1.1-11.6)0.330.19 (0.08-0.63)0.17 (0.04-0.62)0.470.15 (0.06-0.58)0.13 (0.04-0.63)0.02Abbreviations: SD Standard deviation, IQR interquartile range, IL Interleukin, IFN Interferon, SubQ SubcutaneousaAsthma phenotype is defined by a history of doctor-diagnosed asthma or a bronchodilator response during pulmonary function testingbSputum eosinophil count of 1.53 % defined as the upper limit of normalcAdipose volume is standardized by dividing per 5 mm measured in the z-axis
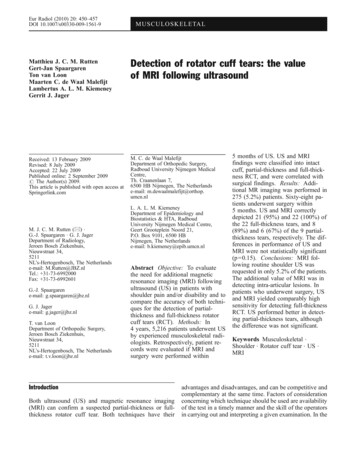
Barton et al. BMC Pulmonary Medicine (2016) 16:111obstruction had higher IL-6 levels compared to thosewithout asthma (p 0.03).There was excellent inter-reader reliability for subcutaneous (r 0.955; p 0.001) and mediastinal (r 0.995; p 0.001) adipose measures. There was no difference in thevolumes of adipose tissue in the mediastinum or the subcutaneous regions of those with and without the COPDphenotype of obstruction (Table 2). Participants with theasthma phenotype of obstruction had a greater volume ofsubcutaneous adipose tissue (33.3 cm3 vs. 22.1 cm3, p 0.004), but no difference in the volume of mediastinal adipose tissue compared to those without asthma (3.9 cm3vs. 4.0 cm3, p 0.33).BMI and CT adipose measurements correlated with several markers of inflammation. Adiponectin correlated inversely with BMI (r -0.23, p 0.01), and more stronglywith mediastinal adipose tissue (r -0.41, p 0.001) thansubcutaneous tissue (r -0.19, p 0.04)(data not shown).Mediastinal adipose tissue correlated inversely withIgE (r -0.19, p 0.04)(data not shown). Both BMI(mean [SD], 30.1 kg/m2 [8.2] vs. 25.7 kg/m2 [4.0]; p 0.001) and subcutaneous adipose tissue volume (mean(SD) 17.4 cm3/slice (5.6) vs. 14.6 cm3/slice (4.8); p 0.008) were greater with high IL-6 (data not shown).There was no correlation between adipose tissue and CRPor sCD163 (data not shown).Airway wall thickness (WA%) did not differ betweenthose with and without the COPD phenotype of obstruction, but was greater in the group with the asthmaphenotype of airflow obstruction (51.0 % vs. 46.8 %; p 0.001) (Fig. 1). Greater WA% was associated with lowerpre-BD FEV1 (r -0.19; p 0.04); there was no association between WA% and pre-BD FEV1/FVC ratio orDLCO (data not shown). Greater WA% was associatedwith BMI, as well as both subcutaneous and mediastinaladipose volumes (Fig. 2). Greater WA% was associatedwith symptoms of wheezing (p 0.02) and tended to bePage 6 of 10associated with phlegm production, but was not associated with cough or dyspnea (data not shown).We performed multivariable regression models toidentify factors associated with the COPD phenotype ofairflow obstruction, the asthma phenotype of obstruction, and WA% (Table 3). A list of all variables includedin the models can be found in the Methods section. TheCOPD phenotype was associated with older age and longer smoking history. The asthma phenotype was associated with the female sex, younger age, smoking history,and lower adiponectin values. Greater WA% was associated with greater BMI, younger age, higher sCD163, andhigher CD4 counts. People who smoked cigarettes orused cocaine had lower WA%.DiscussionThis study demonstrates that there are unique associations that may be contributing to the pathogenesis oftwo airway obstruction phenotypes in HIV-infected persons. We found that the COPD phenotype of airflow obstruction was associated with heavier smoking and olderage. In contrast, the asthma phenotype of airflow obstruction was associated with the female sex, youngerage, smoking history, and lower adiponectin levels.These findings suggest that, while there is some degreeof overlap in the two phenotypes, the association of adiponectin, an important adipose-related mediator of inflammation, with the asthma phenotype of obstructionmay be mechanistically important in HIV-associatedasthma.Asthma has several phenotypes of disease in the HIVuninfected population and may, similarly, have severalphenotypes in the HIV-infected population. Similar tothe general population, there is strong evidence that theallergic phenotype of asthma is present, with elevatedtotal IgE. Additionally, a subset of asthma in HIV mayrepresent the adult-onset, obesity-mediated phenotype.Fig. 2 Wall area thickness correlates with measures of adiposity including body mass index (BMI) (a), and the volumes of subcutaneous (b) andmediastinal (c) adipose tissue in a group of HIV-infected persons
Barton et al. BMC Pulmonary Medicine (2016) 16:111Page 7 of 10Table 3 Multivariable analysis models of pulmonary functionabnormalities and airway wall thickness with participantcharacteristics and inflammatory markersCOPD phenotypeOR (95 % CI)p-valuePack-years smoked, per pack-year1.05 (1.02-1.08)p 0.003Age, per year1.07 (1.01-1.14)p 0.03OR (95 % CI)p-value5.48 (1.78-16.9)p 0.003Age, per year0.95 (0.91-0.99)p 0.04Smoking history, per pack-years1.03 (1.00-1.06)p 0.04Asthma phenotypeFemale vs. male0.98 (0.96-0.99)p 0.01Coef. (95 % CI)p-valueBody mass index, per kg/m0.39 (0.23-0.54)p 0.001Age, per year-0.13 (-0.22-0.05) p 0.003Adiponectin, per ln(ng/mL)Airway wall thickness2Former smoker vs. never smoker-3.76 (-6.34-1.18) p 0.005Current smoker vs. never smoker-3.21 (-5.57-0.86) p 0.008Ever used cocaine vs. never used cocaine -2.35 (-4.60-0.10) p 0.04soluble CD163, per ln (ng/mL)2.95 (1.26-4.64)p 0.001CD4 T-cells, per 100 cell/μL0.27 (0.01-0.52)p 0.04Abbreviations: OR Odds ratio, Coef Coefficient, CI Confidence interval, CRPC-reactive protein, FEV1 Forced expiratory volume in 1 second, FVC Forced vitalcapacity, ln natural logarithmWe have previously shown an association betweenasthma and BMI in HIV [9], suggesting that the increasingly recognized adult-onset obesity phenotype mightalso be more prevalent in the HIV-infected population[49, 50]. Our univariate analyses highlight the significantassociation of increasing volume of subcutaneous tissuewith the asthma phenotype of airflow obstruction morethan mediastinal adipose tissue as we had hypothesized.Increased deposition of visceral adipose tissue is morestrongly associated with metabolic dysregulation and inflammation in the HIV-uninfected population; therefore,subcutaneous adipose tissue in the HIV-infected population may be playing a more significant role in asthmapathogenesis. This study also demonstrated a strong correlation between BMI and adipose measures, both subcutaneous and mediastinal, with increased airway wallthickness, a marker of airway inflammation and remodeling. In multivariable analysis, there was a significantcorrelation between adiponectin and the asthma phenotype of obstruction, an adipose-mediated inflammatorymarker. Several studies have shown a link between adiponectin and asthma in obese asthmatics compared tonon-obese asthmatics, but this association has not previously been reported in HIV [14, 17, 18].Alternatively, HIV-associated asthma may be relatedto chronic HIV-associated inflammation. HIV leads toimmune activation and chronic inflammation, with elevated levels of IL-6, CRP, and D-Dimer compared to thegeneral population [21–24]. In our study, CRP tended tobe associated with greater airway obstruction. We andothers have shown that serum IL-6 is associated withadiposity, suggesting that there is increased inflammation related to obesity as well [51]. In our multivariableregression model, airway remodeling was associated withgreater BMI, higher CD4 counts, and higher sCD163levels, suggesting that macrophage activation fromchronic immune activation [25, 26] and obesity mayboth play a role in airway remodeling, but the degree towhich they are related is unclear [52, 53].Inflammation related to lipodystrophy is an importantfactor causing HIV-associated non-AIDS diseases. Several other HIV co-morbidities, including cardiovasculardisease and neurocognitive dysfunction, have been associated with increased adiposity and inflammation [28–30].Our findings mirror these associations, suggesting
* Correspondence: gingomr@upmc.edu 1Department of Medicine, University of Pittsburgh, Pittsburgh, USA 4Division of Pulmonary, Allergy, and Critical Care Medicine, Department of Medicine, University of Pittsburgh, 3459 Fifth Avenue, 628 NW, Pittsburgh, PA 15213, USA Full list of author information is available at the end of the article