Transcription
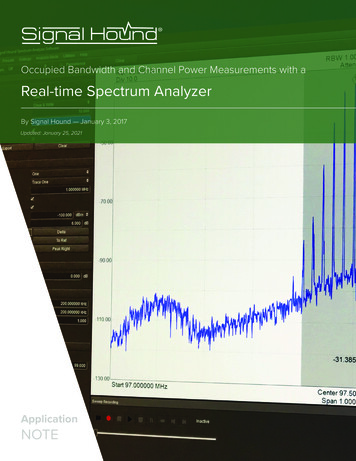
Occupied Bandwidth and Channel Power Measurements with aReal-time Spectrum AnalyzerBy Signal Hound — January 3, 2017Updated: January 25, 2021ApplicationNOTE
SIGNAL HOUND1502 SE COMMERCE AVE, STE 101BATTLE GROUND, WA 98604 2021 ALL RIGHTS RESERVED.
IntroductionAs wireless telecommunication features continue to expand into virtually everycontrol and sensor technology in military, industrial, and domestic environments, awide array of new wireless transmitters and transmitter components will need to bedesigned, prototyped, calibrated, and analyzed for quality assurance. There are manymeasurement methods and figures of merit that can be brought to bear in analyzingtransmitter performance. Two such methods, occupied bandwidth (OBW) and channelpower measurements, are relatively easy measurements to make that can revealdistortion, poor power amplifier (PA) design, filter effects, system noise, and othersignal degradation factors.Recently, with the advent of real-time spectrum analyzers (RTSAs), pulsed, frequency-hopping,and other transient/intermittent signals can now be characterized using OBW and channel powermeasurements. Signal Hound’s Spike software and one of the Signal Hound RTSAs, such as aBB60C, can be used to analyze highly modulated signals and transient signals using built-inoccupied bandwidth and channel power measurement features.This document will walk through an example setup and testing procedure for both occupiedbandwidth and channel power measurements. The goal of the walkthrough is to demonstrate andexplain the critical aspects of occupied bandwidth and channel power measurements and how SignalHound tools can be used to reliably produce low-cost and low-learning-curve measurements rapidlyand with little setup.
Occupied Bandwidth and Channel Power Measurementswith a Real-time Spectrum AnalyzerTable of ContentsIntroduction 3Overview of Occupied Bandwidth Measurements 5Overview of Channel Power Measurements 6Channel Power 6Adjacent Channel Power (ACP) or Adjacent Channel Leakage (ACL) 6Adjacent Channel Power Ratio (ACPR) or Adjacent Channel Leakage Ratio (ACLR) 6Equipment and Accessories for ACPR and OBW Measurements Test Equipment Suggested for ACPR and OBW Measurements: Equipment Setup and Configuration for the OBW and ACPR Walkthroughs 778Setting Up the BB60C with Spike 8Setting Up The VSG25A 9Occupied Bandwidth Measurement Walkthrough Occupied Bandwidth Sinusoidal Frequency Modulated Signal Test Procedure Occupied Bandwidth Measurement for Pulsed or Intermittent Signals 101012Using Max-Hold Trace Mode with Spike 13Export and Analyze Trace Data 13Channel Power and Adjacent Channel Power Ratio Walkthrough 14Channel Power Measurement Procedure 14Adjacent Channel Power Ratio Measurement 15Further Reading 15
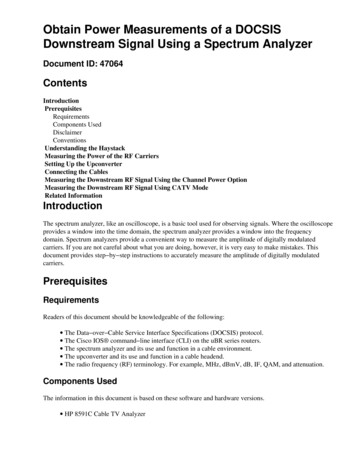
Overview of Occupied Bandwidth Measurements// 5Overview of Occupied Bandwidth MeasurementsFor any frequency or phase modulated signal, occupied bandwidth measurements are critical in ensuring that the transmission hardwareand modulation parameters are properly designed to prevent interference and efficient transmission. For example, cellular technologies,Wi-Fi, and many more recent digital modulated technologies use a variety of modulation parameters, and some are even reprogrammable.Hence, ensuring that the occupied bandwidth of the modulated transmissions stay within a specified bandwidth under all modulationconfigurations can help a designer make the necessary tradeoffs between hardware costs and data rate and bit-error-rate (BER).As pulsed radar signals and transient modulation signals are nearly impossible to catch with standard spectrum analyzers, RTSAs enablecapture and record of real-time signals, and can be used to illuminate important signal characteristics necessary in identifying and analyzingpulsed hardware and modulation schemes. OBW is one such measurement, where wide-bandwidth real-time signal capture of an entirepulsed signal and its transient behavior is necessary to make an accurate analysis of the transmitter and modulations signal characteristics(see Figure 1).There are several methods of measuring OBW. However, the general structure of the measurement concludes that OBW is the bandwidthof a signal in which 99% of the total integrated power of the transmitted spectrum is contained. Some standards also include specificsettings for an analyzer to properly take an occupied bandwidth measurement. For example, the 3GPP dictates that the measurement ofthe distribution of the power spectrum is made using a Gaussian filter with a bandwidth greater than 10 MHz and a resolution bandwidthfilter (RBW) set to 30 kHz or less for WCDMA modulation.The order of operations for the measurement is that first the total spectral power in the frequency range is measured. Following thiscalculation and beginning at the lowest frequency range in the sweep, the power distribution at each frequency is summed until thesummation reaches exactly 0.5% of the total spectral power within the sweep range. This measurement is repeated inversely startingat the highest frequency range and summing the power at each frequency until the sum reaches 0.5% of the total power. Thismethod reveals the upper and lower frequency boundaries of the occupied bandwidth at the 0.5% points.Figure 1—Some spectrum analyzer software packages are able to automatically measure occupied bandwidth,saving the effort of exporting trace data and analyzing it in 3rd party data analysis suites.
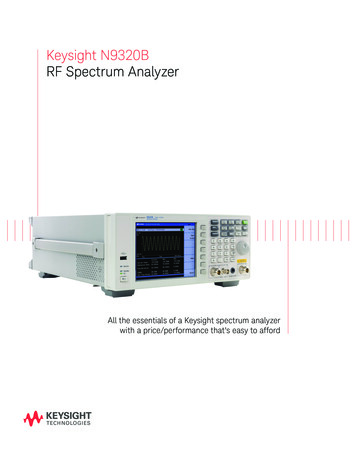
6 // Overview of Channel Power MeasurementsOverview of Channel Power MeasurementsFrom Wi-Fi, Bluetooth, and cellular to broadcast radio stations and satellite TV, much of the usable RF/microwave spectrum is segmentedinto designated channels. However, there is very limited spectrum and most countries limit certain applications to a small range offrequencies. Thus, many telecommunications protocols depend upon tightly packed channels that further subdivide the spectrumin hopes of preventing interference and optimizing use of the available spectrum.As not all radio hardware is created equal, some modulation schemes may be more prone to nonlinear distortions and phase noiserelated spectral regrowth; interference from adjacent channels can dramatically reduce communications capability. Measuringthe power within a channel, and how much power is also transmitted into adjacent channels, can prevent transmitter designs andoperation that lead to interference.Channel PowerMeasuring the amount of power transmitted within the designedchannel is necessary in the adjacent channel power ratio (ACPR) oradjacent channel leakage ratio (ACLR) measurements. Additionally,measuring the channel power can give insight into the efficiency ofthe transmission system and the modulation scheme chosen.Channel power is calculated with a digital spectrum analyzer byintegrating the FFT bins over the programmed channel bandwidthusing the following equation:Adjacent Channel Power (ACP) or AdjacentChannel Leakage (ACL)Another measurement of interest is the adjacent channel power(ACP), which is the measured power in the adjacent channels to thechannel of interest. This measurement is performed as the channelpower measurement is performed in the adjacent channels.Adjacent Channel Power Ratio (ACPR) orAdjacent Channel Leakage Ratio (ACLR)The comparison of the amount of power in the primary channel tothe amount of power in the adjacent channels is often used as atransmitter and modulation scheme figure of merit of the linearityand noise performance. ACPR is the logarithmic comparison of thechannel power in the primary channel compared to the adjacentchannel power.The window bandwidth is equivalent to the noise bandwidth of theRBW filter setting used, and the Pch result is in milliwatts if the FFTbin data is provided in dBm. Specifically, in Spike, the averagedetector and power video units must be selected with the spurreject algorithm checked as disabled. These settings are necessaryto achieve an accurate measurement for channel power, as thecalculation requires a sample detector or root-mean square(RMS) power averaging detector to be used.The ACPR measurement is best suited to revealing the significanceof the nonlinear characteristics of the power amplifier, amplifiersubassembly components/connections, and the mixer components.The impacts of phase noise and the systems noise behavioralso contribute to the ACPR performance of the system.Fortunately, Spike paired with a Signal Hound RTSA enables easymeasurement of channel power, adjacent channel power, and ACPR.Additionally, Spike is capable of measuring the channel powercharacteristics for more than just the immediately adjacentchannel, and can be configured to measure secondaryand tertiary adjacent channels.Figure 2—Channel power of an FM broadcast band
Equipment and Accessories for ACPR and OBW Measurements // 7Equipment and Accessories for ACPR and OBW MeasurementsPrior to more flexibly programmed spectrum analyzers and RTSAs, ACPR and OBW were performed by specialized or custom test sets.Typically, all that is necessary for this measurement is a spectrum analyzer and software with OBW and ACPR measurement modes,the device-under-test (DUT), and the accessory interconnect, cabling, PC, and power supplies. If the spectrum analyzer software is notcapable of OBW and ACPR measurements, the trace data can be exported and analyzed using a 3rd party software suite capable ofmathematical analysis of array data.Signal Hound has enabled ACPR and OBW measurements in a very cost-effective, efficient, and small footprint implementation withtheir series of RTSAs and Spike. For convenience and easy demonstration, this guide uses the Signal Hound BB60C for thespectrum analyzer and the Signal Hound VSG25A to emulate a DUT.Test Equipment Suggested for ACPR and OBW Measurements:Signal Hound BB60CThe 27 MHz of instantaneous bandwidth provided by the BB60C enables real-time OBW and ACPRmeasurements of very wide-bandwidth signals, transient or continuous. However, if a frequency or phasemodulated continuous wave signal is the desired measurement target, a swept-spectrum analyzer can beused to similar effect. This walkthrough will use the BB60C RTSA.Signal Hound BB60C AccessoriesUSB 3.0 Double Power Cable – Provided by Signal Hound with every BB60C. These cables need to beconnected to a USB 3.0 compatible PC. Only a USB 3.0 compatible PC can adequately supply thenecessary power through the USB cables and carry the digitized frequency data from the RTSA. SMA to BNC Adapter – Used for convenient connection to BNC interconnect transmission lines.Spike Spectrum Analyzer Software (from Signal Hound)Spike requires a PC equipped with Windows 7, 8, or 10 operating system either 32 or 64-bit.For Signal Hound’s BB-series RTSAs, an Intel Desktop quad-core i5/i7 processor model number 3000 seriesor later is required. Additionally, a minimum of 4 GB of RAM are required, with 8 GB of RAM being therecommended hardware. Spike typically requires less than 1 GB of available hard disk space.Download for free at https://signalhound.com/spike.Signal Hound VSG25AA 100 MHz to 2.5 GHz vector signal generator from Signal Hound. USB 2.0 Male A to Male B-type – This cable is used to connect the Signal Hound VSG25A to thePC via a USB 2.0 port. SMA to BNC Adapter – Used for convenient connection of the VSG25A to the BB60C. Signal Hound VSG25A Control Software – This software is used to program the VSG25A and isavailable for free on the Signal Hound G25/VSG25 104.zipEquipment & Accessories BNC-BNC Cable – This coaxial cable is used to connect the VSG25A to the BB60C during theOBW and ACPR measurements. PC with 2x USB 3.0 and 1x USB 2.0 Ports and Necessary Specs – This PC is used to control theVSG25A and to run Spike and BB60C data.
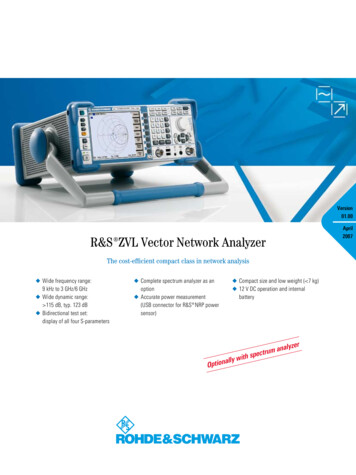
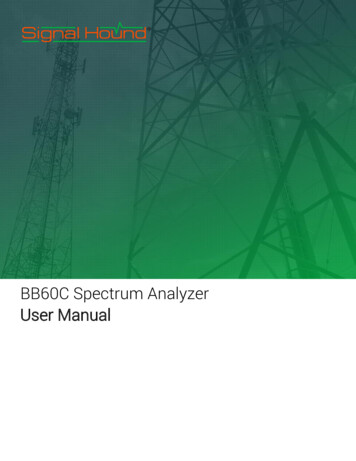
8 // Equipment Setup and Configuration for the OBW and ACPR WalkthroughsEquipment Setup and Configuration for the OBW and ACPR WalkthroughsThese walkthroughs leverage the Signal Hound BB60C, VSG25A, Spike, and VSG25A Software to demonstrate an occupied bandwidthmeasurement. The VSG25A is used as the DUT in the measurement as it is a signal generator capable of complex vector modulation,including frequency modulation.The connection diagram below describes the appropriate connection and connection types for each component of the OBW andACPR measurements. Hand tightening of the SMA to BNC coaxial connectors should be adequate for the SMA ports on the VSG25Aand the BB60C. Conversely, an SMA to SMA cable can be used to directly connect the VSG25A and BB60C.Note—Test ports will degrade with performance over time and have a finite number of mating cycles before failure. Hence, an intermediate adapter is used to preventearly test port degradation and failure.As the VSG25A and the BB60C are both powered by the USB ports of the PC, it is suggested to run the devices on the PC USB ports capableof supplying adequate power to both devices. If two separate USB 3.0 connections are used for the BB60C’s dual USB cable and a USB 2.0connection is used for the VSG25A, this arrangement should be adequate.Note—All appropriate protective gear, grounding mats/straps, and a clean environment should be used when operating any electrical measurements.Setting Up the BB60C with SpikeTest equipment setup of the BB60C1.Ensure the test environment or operator is properlygrounded and clean2.Connect the SMA to BNC adapter to the RF SMA port onthe BB60C3.Connect the BNC cable to the SMA to BNC adapter4.Connect both USB male connectors to the PC USB 3.0female connections5.Insert the USB cable into the USB 3.0 port of the BB60C6.Observe the green ‘Ready’ light before proceeding7.Connect the BB60C with Spikea.Ensure that Spike is properly installedb. Ensure that the USB drivers are properly configuredc.Launch Spiked. Connect the BB60C with Spike by clickingFile Connect BB60COnce the BB60C is connected to the PC with the dual USB 3.0cable (see Figure 3) and the appropriate drivers and Spike areinstalled, a green ‘Ready’ light should appear. This ‘Ready’ lightshould turn orange rapidly after booting up Spike andconnecting the BB60C, as the default measurementparameters are engaged and measurement begins.Figure 3—The VSG25A, BB60C, and PC connection order.
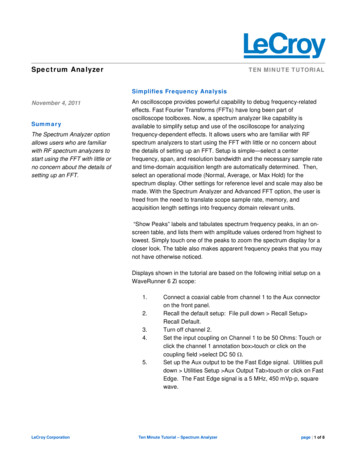
Equipment Setup and Configuration for the OBW and ACPR WalkthroughsSetting Up The VSG25AAfter proper installation of the VSG25A control software, the following steps connect the VSG25A to the computer.Test equipment setup of the VSG25A1.Ensure the test environment or operator is properly grounded and clean2.Connect the SMA to BNC adapter to the RF SMA port on the VSG25A3.Connect the BNC cable to the SMA to BNC adapter (the other end should already be attached to the BB60C)4.Connect the USB male connector to the PC USB 2.0 female connection5.Insert the USB cable into the VSG25A’s USB 2.0 port6.Observe the green ‘Ready’ light before proceeding7.Connect the VSG25A with the VSG25A softwarea.Ensure that the VSG25A software is properly installedb. Ensure that the USB drivers are properly installedc.Launch the VSG25A softwareFigure 4—An Example setup for OBW and ACPR measurements using theSignal Hound BB60C, VSG25A, and Spike with an intel i7 PC.// 9
10 // Occupied Bandwidth Measurement WalkthroughOccupied Bandwidth Measurement WalkthroughThe following procedures work through the process of using Signal Hound equipment for occupied bandwidth measurements.Occupied Bandwidth Sinusoidal Frequency Modulated Signal Test ProcedureThis section of the walkthrough will detail the programming parameters and steps of properly measuring the occupied bandwidthof a 97.9 MHz carrier frequency modulated with a 20 kHz sine wave with an FM deviation of 25 kHz at -30 dBm. The VSG25A is usedas the DUT in the measurement performed by the BB60C RTSA and recorded and controlled by Spike.1. Setup the BB60C and Spike for OBW MeasurementThe following steps detail the exact parameter definitions to be input in Spike. These parameters can be manipulated as the BB60C is takingmeasurements. However, if the VSG25A and BB60C are appropriately connected, the only signal in the measurements before activating theVSG25A should be the noise floor, and possibly, low-level spurs.Configuring sweep settings in Spike for OBW measurement1.From the main menu, select Analysis Mode Sweep2.In the Frequency panel, set the following:a.6.a.c.In the Amplitude panel, set the following:a.e. Select UpdateRef Level -30 dBIn the Bandwidth panel, set the following:a.RBW Shape Flat Top, Nutall, or GaussianAvg Count 10d. Color yellowb. Div 10 dB4.Trace Oneb. Type Clear & WriteCenter Frequency 97.5 MHzb. Span 1 Mhz3.In the Traces panel, set the following:f.Deselect Hide7.In the Offsets panel, in the Ref Offset field, type 0.000.8.In the Occupied Bandwidth panel, set the following:b. RBW 616.455078 Hza.c.b. % Power 99.000VBW RBWSelect Enabledd. Select Auto RBWe. Select Auto VBW5.In the Acquisition panel, set the following:a.Video Units Powerb. Detector Averagec.Swp Time 1.000 msFigure 5—Signal Hound’s Spike can be configured to measureoccupied bandwidth with the click of an enable option.
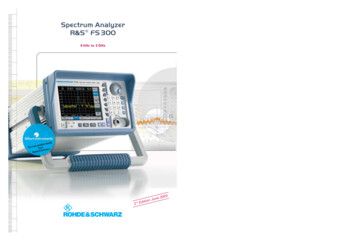
11 // Occupied Bandwidth Measurement Walkthrough2. Setup VSG25A for the measurement3. Analyzing the MeasurementWhen launching the VSG25A software, a dialog with all of theprogrammable parameters of the VSG25A will open. The image andconfiguration parameter listing below provides the description ofhow to generate a sinusoidal frequency modulated signal at 97.5MHz with a modulation rate of 20 kHz and FM deviation of 25 kHzat -30 dBm power level.After applying the RF On setting, a single tone should appearat 97.5 MHz. Once the Mod setting is On, then the sinusoidalfrequency modulation should become apparent as several tonesappear symmetric around 97.5 MHz. The diagram below indicatesobservable areas of interest. A marker is used to show that the peakfrequency of the signal is at the desired 97.5 MHz. The markersettings on the left-hand side of Spike panel can be used to adjustthe marker parameters and create new markers. To place a markeron the peak frequency, simply click “Peak Search” in the Markersselection field.Configuring The VSG25A for OBW Measurement1.Select the FM button in the panel on the right-hand sideof the window2.In the fields near the top of the window, set the following:a.Frequency (MHz) 97.5b. Amplitude (dBm) -303.In the Frequency Modulation panel, set the following:a.Modulation Rate (kHz) 20b. FM Deviation (kHz) 25c.4.Modulation Shape Sine WaveClick Apply SettingsNote—This must be done before proceeding to the next steps.5.In the RF pane, select On6.In the Mod pane, select OnFigure 7—Areas of interest in the measurementThe modulated signal should be located at roughly 97.5 MHz witha power level within several dBm of -30 dBm. However, the signalshould have less than -30 dBm of power at the peak frequency assome signal power is spread over the modulated signal range.The occupied bandwidth feature should create upper and lowerfrequency markers designating the boundaries within which 99%of the power is contained. There is an OBW display window on thebottom left of the measurement window, which indicates the OBWmeasurement and the total power of the signal. The total signalpower should be within a few fractions of a dBm of -30 dBm.It should be observed that the occupied bandwidth of the signalis much greater than the modulation depth and the FM deviationsettings of the transmitter. This effect occurs as a result of theresultant tones of the pure sinusoidal modulation, as well as theimperfect linearity, noise, and phase noise characteristics of thetransmitter.Figure 6—Configuring the VSG25A for FM modulation.
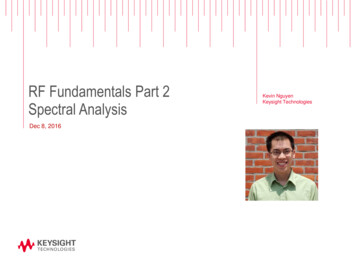
12 // Occupied Bandwidth Measurement for Pulsed or Intermittent SignalsOccupied Bandwidth Measurement for Pulsed or Intermittent SignalsUnlike with continuous wave signals, pulsed signals and transient signals may not necessarily have consistent characteristics in time offrequency. In the case of some signals, such as pulsed radar, these signals may demonstrate consistently repeating pulsed square wavesignals with set repetition rate, constant pulse width, constant shape, and amplitude. In this case, it is easy enough to trigger on thissignal and accurately measure its characteristics, including occupied bandwidth.However, for pulsed or transient signals that may be intermittent or have unknown characteristics, taking these measurements may bea greater challenge. Fortunately, a real-time spectrum analyzer is able to observe and measure this transient behavior down to the attacktime limits of the analyzer. Several tools exist to help identify and measure intermittent time-varying signals, such as a waterfallspectrum display (spectrogram), persistent display, max-hold, zero span mode, etc.The following walkthrough will demonstrate using the max-hold and trace-data export features to provide detailed analysis, includingoccupied bandwidth, for pulsed and other transient signals. The export of trace data is necessary, as Spike occupied bandwidthmeasurement feature will currently only measure the incoming data instantaneously.1. Setup BB60C and Spike for the PulsedOBW MeasurementAs this measurement also uses the VSG25A and the samefrequencies are used as in the continuous wave OBW measurement,the configuration of the BB60C and Spike is the same as theprevious measurement. See 1. Setup BB60C and Spike forOBW Measurement for details.2. Setup VSG25A for the Pulsed OBW MeasurementThis measurement will use the VSG25A to generate a square pulsewave with consistent frequency and timing characteristics at 97.5MHz with a pulse width of 100ms and a pulse period of 1000ms at-30 dBm power level.3.In the Pulse Modulation panel, set the following:a.Pulse Width (ms) 100b. Pulse Period (ms) 1000 (the equivalent of 1 second)4.Click Apply SettingsNote—This must be done before proceeding to the next steps.5.In the RF pane, select On6.In the Mod pane, select OnNow you can use 2D spectrogram mode within Spike to monitor andconfirm the appropriate signal characteristics over time, bandwidth,and amplitude.Configuring The VSG25A for Pulsed OBW Measurement1.Select the Pulse button in the panel on the right-hand sideof the window2.In the fields near the top of the window, set the following:a.Frequency (MHz) 97.5b. Amplitude (dBm) -30Figure 8—The VSG25A configured for a pulsed OBW measurement.
13 // Occupied Bandwidth Measurement for Pulsed or Intermittent Signals7. In the upper left-hand corner of the Spike interface, from theSpectrogram menu, select 2D SpectrogramSpike now displays the RF activity in the spectrum waterfall plot(see Figure 9).3.Click the color swatch in the Color field. The Select Colorwindow appears4.In the Select Color window, either click on a color chip or usethe available fields to configure your trace color, and click Ok5.Select UpdateAs the signal is apparently pulsed at an even pulsing ratio, amethod of catching the highest power at each frequency ofinterest is to use the Max-Hold trace mode instead of theClear and Write trace mode.Figure 10—The Max-Hold trace in red and Clear and Write trace in yellowdemonstrate that the Max-Hold trace is able to reveal the highest powerlevels at each individual frequency and hold those values for comparison.Figure 9—A 2D Spectrogram reveals the intensity of power levels within thesweep range. However, a real-time spectrum analyzer is capable of capturingeven extremely short duration signals as long as they are contained withinthe instantaneous bandwidth of the analyzer.Using Max-Hold Trace Mode with SpikeThe Max-Hold feature of Spike uses the highest power level yetmeasured in each frequency bin and displays that as a trace. Thisapproach reveals the highest power at each frequency over the lengthof observation. Spike enables multiple traces to be viewable in thesame display. If a second trace is configured to have the Max-Holdproperty, then both a Clear and Write and Max-Hold trace can bedisplayed for comparison.Export and Analyze Trace DataAs Spike is unable to perform an occupied bandwidth measurementon anything but instantaneous data from the BB60C, external tools willbe necessary to calculate the OBW. This can be done by exporting thetrace data and further analyzing the data in 3rd party software. Theexport function will export a CSV file (.csv) that can be read by othersoftware and can be further analyzed.Exporting the Max-Hold Trace Data from SpikeWhile Spike is displaying pulsed data from the VSG25A,do the following:Creating a Second Trace with Max-Hold Mode1.In the Traces panel, from the Type drop-down menu,select Max HoldWhile Spike is displaying pulsed data from the VSG25A,do the following:2.Near the bottom of the Traces panel, click Export3.Save the CSV file in an appropriate location to be accessedby the 3rd party software1.In the Traces panel, from the Trace drop-down menu,select Two2.From the Type drop-down menu, select Max HoldThe CSV is now ready for analysis by any of the software toolsavailable on the market for analyzing array data from CSV files.Examples include MATLABTM, LABVIEWTM, MicrosoftTM Excel,and many others.
14 // Channel Power and Adjacent Channel Power Ratio WalkthroughChannel Power and Adjacent Channel Power Ratio WalkthroughThis section of the walkthrough will demonstrate the use of Spike built-in channel power, adjacent channel power, and adjacent channelpower ratio measurement features. The first two sections of this walkthrough use the VSG25A as the signal generating DUT.Channel Power Measurement ProcedureConfiguring Spike for channel power measurementsThe following procedure works through the process of usingSignal Hound equipment for channel power measurements.While Spike is displalying data from your test setup:1. Setup the BB60C, VSG25A, and Spikefor a Channel Power MeasurementUsing the same settings specified in the Occupied BandwidthMeasurement Walkthrough for the VSG25A, BB60C, and Spikeprepares the equipment for the walkthrough. This time, however,the only difference is that the Channel Power Settings areconfigured instead of manipulating the OccupiedBandwidth parameters.2. Configure the Channel Power SettingsAs with the OBW measurement, Spike provides a convenientmeasurement field. In the same field as OBW, Channel Powermeasurement can also be configured and programmed toautomatically perform channel power and adjacent channelpower ratio measurements. It is important to note that thecenter frequency of the primary channel should be the centerfrequency of the frequency sweep programmed in the Frequencyfields. The Channel Power measurements assume that thecenter frequency desired in the sweep center frequency.1.In Spike, in the Channel Power panel, set the following:a.Width 200 kHzb. Spacing 200 kHzc.2.Count 1Select Enabled3. Observe the Channel Power MeasurementThe results of the Channel Power measurement are a number indBm below, and in the center, of the channel of interest. A greyshaded area is placed on the frequency display, which indicatesthe channel being measured (see Figure 11).Figure 11—The Channel Power measurement reveals the total power withina programed channel. If a signal has highly linear and low noise/phase noisecharacteristics, the majority of the transmitted signal power should be contained within the primary channel.The Width field sets the bandwidth of the channel to bemeasured. The Spacing field dictates the center-frequency tocenter-frequency spacing of the channels. For example, to measurea channelized modulation protocol with guard bands, the Widthcan be set to the maximum channel bandwidth minus thesum of the guard band bandwidths.
15 // Further ReadingAdjacent Channel Power Ratio MeasurementWhere the channel power measures the total power within achannel, adding additional “counts” or channels in the ChannelPower field in Spike, will automatically measure the power inthe adjacent channels and provide a ratio of the adjacent channelpower to the primary channel.1. Configure the Channel Power SettingsThe only configuration difference between ACPR and CPmeasurements is the use of the “count” field. Changing thecount field will increase the number of channels that areincluded in the channel power measurements.Configure Spike for Channel Power MeasurementsWhile Spike is displaying data from your test setup:1. In Spike, in the Channel Power panel, set the following:a.Width 200 kHzFigure 12—The ACPR measures the amount of signal energy that has bledinto the adjacent channels, and can be used to predict interference.This measurement requires a closed system test, as outside interferencecould artificially inflate the power in the adjacent channels comparedto the primary channel.b. Spacing 200 kHzc.Count 32. Select Enabled2. Observe the Channel Power andACPR MeasurementsOnce the Enable field is selected, grey fields will appear designatingeach channel being measured. A count of 3 measures the primarychannel and the two adjacent channels (see Figure 13). The ChannelPower and the ACPR are displayed in the center of each measuredchannel. The ACPR measurement is displayed below the ChannelPower and is in the units of “dBc,” which are scalar logarithmic units.Extended areaFigure 13—Changing the “Count” field in Spike to 4 or more extends theadjacent channel power ratio measurement beyond the immediatelyadjacent channels.Further ReadingDownload the Spike manual from www.signalhound.com/spike for more OBW and CPM information.
About Signal HoundSignal Hound designs and builds powerful, affordable spectrum analyzers and signal generators for engineers and RFprofessionals around the globe. Whether you’re needing EMC precompliance capabilities in a small two-person shop orspectrum monitoring on a national scale, our test equipment is desi
The 27 MHz of instantaneous bandwidth provided by the BB60C enables real-time OBW and ACPR measurements of very wide-bandwidth signals, transient or continuous. However, if a frequency or phase modulated continuous wave signal is the desired measurement target, a swept-spectrum analyzer can be used to similar effect.