Transcription
Agilent X-SeriesSignal AnalyzerThis manual provides documentation for thefollowing X-Series Analyzers:MXA Signal Analyzer N9020AEXA Signal Analyzer N9010AN9020A/N9010ASpectrum Analyzer ModeMeasurement Guide
Notices Agilent Technologies, Inc. 2008Manual Part NumberNo part of this manual may be reproducedin any form or by any means (includingelectronic storage and retrieval or translation into a foreign language) without prioragreement and written consent from Agilent Technologies, Inc. as governed byUnited States and international copyrightlaws.N9060-90022Supersedes:N9060-90022, August 2008March 2009Printed in USAAgilent Technologies, Inc.1400 Fountaingrove ParkwaySanta Rosa, CA 95403TrademarkAcknowledgementsMicrosoft is a U.S. registeredtrademark of Microsoft Corporation. Print Date Windows and MS Windows areU.S. registered trademarks ofMicrosoft Corporation.Adobe Reader is a U.S. registeredtrademark of Adobe SystemIncorporated.Java is a U.S. trademark of SunMicrosystems, Inc.MATLAB is a U.S. registeredtrademark of Math Works, Inc.Norton Ghost is a U.S. trademarkof Symantec Corporation.WarrantyThe material contained in this document is provided “as is,” and issubject to being changed, withoutnotice, in future editions. Further,to the maximum extent permittedby applicable law, Agilent disclaimsall warranties, either express orimplied, with regard to this manualand any information containedherein, including but not limited tothe implied warranties of merchantability and fitness for a particular purpose. Agilent shall notbe liable for errors or for incidentalor consequential damages in connection with the furnishing, use, orperformance of this document or ofany information contained herein.Should Agilent and the user have aseparate written agreement withwarranty terms covering the material in this document that conflictwith these terms, the warrantyterms in the separate agreementshall control.Technology LicensesThe hardware and/or software describedin this document are furnished under alicense and may be used or copied only inaccordance with the terms of such license.Restricted Rights LegendIf software is for use in the performanceof a U.S. Government prime contract orsubcontract, Software is delivered andlicensed as “Commercial computer software” as defined in DFAR 252.227-7014(June 1995), or as a “commercial item” asdefined in FAR 2.101(a) or as “Restrictedcomputer software” as defined in FAR52.227-19 (June 1987) or any equivalentagency regulation or contract clause. Use,duplication or disclosure of Software issubject to Agilent Technologies’ standardcommercial license terms, and non-DODDepartments and Agencies of the U.S.Government will receive no greater thanRestricted Rights as defined in FAR52.227-19(c)(1-2) (June 1987). U.S. Government users will receive no greater thanLimited Rights as defined in FAR 52.22714 (June 1987) or DFAR 252.227-7015(b)(2) (November 1995), as applicable inany technical data.Safety NoticesCAUTIONA CAUTION notice denotes ahazard. It calls attention to anoperating procedure, practice, orthe like that, if not correctly performed or adhered to, could resultin damage to the product or loss ofimportant data. Do not proceedbeyond a CAUTION notice untilthe indicated conditions are fullyunderstood and met.WARNINGA WARNING notice denotes ahazard. It calls attention to anoperating procedure, practice,or the like that, if not correctlyperformed or adhered to, couldresult in personal injury ordeath. Do not proceed beyond aWARNING notice until the indicated conditions are fullyunderstood and met.2
WarrantyThis Agilent technologies instrument product is warranted against defects in material and workmanship fora period of one year from the date of shipment. During the warranty period, Agilent Technologies will, atits option, either repair or replace products that prove to be defective.For warranty service or repair, this product must be returned to a service facility designated by AgilentTechnologies. Buyer shall prepay shipping charges to Agilent Technologies and Agilent Technologies shallpay shipping charges to return the product to Buyer. However, Buyer shall pay all shipping charges, duties,and taxes for products returned to Agilent Technologies from another country.Where to Find the Latest InformationDocumentation is updated periodically. For the latest information about this analyzer, including firmwareupgrades, application information, and product information, see the following lent.com/find/exaTo receive the latest updates by email, subscribe to Agilent Email formation on preventing analyzer damage can be found at:http://www.agilent.com/find/tips3
4
Contents2. Front and Rear Panel FeaturesFront-Panel Features . . . . . . . . . . . . . . . . . . . . . . . . . . . . . . . . . . . . . . . . . . . . . . . . . . . . . . . 18Display Annotations . . . . . . . . . . . . . . . . . . . . . . . . . . . . . . . . . . . . . . . . . . . . . . . . . . . . . . . 22Rear-Panel Features . . . . . . . . . . . . . . . . . . . . . . . . . . . . . . . . . . . . . . . . . . . . . . . . . . . . . . . 24Front and Rear Panel Symbols . . . . . . . . . . . . . . . . . . . . . . . . . . . . . . . . . . . . . . . . . . . . . . . 263. Measuring Multiple SignalsComparing Signals on the Same Screen Using Marker Delta . . . . . . . . . . . . . . . . . . . . . . . 28Comparing Signals not on the Same Screen Using Marker Delta . . . . . . . . . . . . . . . . . . . . 30Resolving Signals of Equal Amplitude . . . . . . . . . . . . . . . . . . . . . . . . . . . . . . . . . . . . . . . . . 32Resolving Small Signals Hidden by Large Signals . . . . . . . . . . . . . . . . . . . . . . . . . . . . . . . 36Decreasing the Frequency Span Around the Signal . . . . . . . . . . . . . . . . . . . . . . . . . . . . . . . 39Easily Measure Varying Levels of Modulated Power Compared to a Reference . . . . . . . . 414. Measuring a Low Level SignalReducing Input Attenuation . . . . . . . . . . . . . . . . . . . . . . . . . . . . . . . . . . . . . . . . . . . . . . . . . 46Decreasing the Resolution Bandwidth . . . . . . . . . . . . . . . . . . . . . . . . . . . . . . . . . . . . . . . . . 49Using the Average Detector and Increased Sweep Time . . . . . . . . . . . . . . . . . . . . . . . . . . . 52Trace Averaging . . . . . . . . . . . . . . . . . . . . . . . . . . . . . . . . . . . . . . . . . . . . . . . . . . . . . . . . . . 545. Improving Frequency Resolution and AccuracyUsing a Frequency Counter to Improve Frequency Resolution and Accuracy . . . . . . . . . . 586. Tracking Drifting SignalsMeasuring a Source Frequency Drift . . . . . . . . . . . . . . . . . . . . . . . . . . . . . . . . . . . . . . . . . . 62Tracking a Signal . . . . . . . . . . . . . . . . . . . . . . . . . . . . . . . . . . . . . . . . . . . . . . . . . . . . . . . . . 647. Making Distortion MeasurementsIdentifying Analyzer Generated Distortion . . . . . . . . . . . . . . . . . . . . . . . . . . . . . . . . . . . . . 68Third-Order Intermodulation Distortion . . . . . . . . . . . . . . . . . . . . . . . . . . . . . . . . . . . . . . . . 718. Measuring NoiseMeasuring Signal-to-Noise . . . . . . . . . . . . . . . . . . . . . . . . . . . . . . . . . . . . . . . . . . . . . . . . . . 76Measuring Noise Using the Noise Marker . . . . . . . . . . . . . . . . . . . . . . . . . . . . . . . . . . . . . . 78Measuring Noise-Like Signals Using Band/Interval Density Markers . . . . . . . . . . . . . . . . 81Measuring Noise-Like Signals Using the Channel Power Measurement . . . . . . . . . . . . . . . 83Measuring Signal-to-Noise of a Modulated Carrier . . . . . . . . . . . . . . . . . . . . . . . . . . . . . . . 855Table of Contents1. Getting Started with the Spectrum Analyzer Measurement ApplicationMaking a Basic Measurement . . . . . . . . . . . . . . . . . . . . . . . . . . . . . . . . . . . . . . . . . . . . . . . . . 8Recommended Test Equipment . . . . . . . . . . . . . . . . . . . . . . . . . . . . . . . . . . . . . . . . . . . . . . 12Accessories Available . . . . . . . . . . . . . . . . . . . . . . . . . . . . . . . . . . . . . . . . . . . . . . . . . . . . . . 13
Table of ContentsContentsImproving Phase Noise Measurements by Subtracting Signal Analyzer Noise . . . . . . . . . .899. Making Time-Gated MeasurementsGenerating a Pulsed-RF FM Signal . . . . . . . . . . . . . . . . . . . . . . . . . . . . . . . . . . . . . . . . . . . .94Connecting the Instruments to Make Time-Gated Measurements . . . . . . . . . . . . . . . . . . . .99Gated LO Measurement . . . . . . . . . . . . . . . . . . . . . . . . . . . . . . . . . . . . . . . . . . . . . . . . . . . .101Gated Video Measurement . . . . . . . . . . . . . . . . . . . . . . . . . . . . . . . . . . . . . . . . . . . . . . . . .104Gated FFT Measurement . . . . . . . . . . . . . . . . . . . . . . . . . . . . . . . . . . . . . . . . . . . . . . . . . . .10710.Measuring Digital Communications SignalsChannel Power Measurements . . . . . . . . . . . . . . . . . . . . . . . . . . . . . . . . . . . . . . . . . . . . . . .110Occupied Bandwidth Measurements . . . . . . . . . . . . . . . . . . . . . . . . . . . . . . . . . . . . . . . . . .112Making Adjacent Channel Power (ACP) Measurements . . . . . . . . . . . . . . . . . . . . . . . . . .114Making Statistical Power Measurements (CCDF) . . . . . . . . . . . . . . . . . . . . . . . . . . . . . . . .118Making Burst Power Measurements . . . . . . . . . . . . . . . . . . . . . . . . . . . . . . . . . . . . . . . . . .122Spurious Emissions Measurements . . . . . . . . . . . . . . . . . . . . . . . . . . . . . . . . . . . . . . . . . . .127Spectrum Emission Mask Measurements . . . . . . . . . . . . . . . . . . . . . . . . . . . . . . . . . . . . . .12911.Demodulating AM SignalsMeasuring the Modulation Rate of an AM Signal . . . . . . . . . . . . . . . . . . . . . . . . . . . . . . . .132Measuring the Modulation Index of an AM Signal . . . . . . . . . . . . . . . . . . . . . . . . . . . . . . .13512.IQ Analyzer MeasurementCapturing Wideband Signals for Further Analysis . . . . . . . . . . . . . . . . . . . . . . . . . . . . . . .138Complex Spectrum Measurement . . . . . . . . . . . . . . . . . . . . . . . . . . . . . . . . . . . . . . . . . . . .139IQ Waveform (Time Domain) Measurement . . . . . . . . . . . . . . . . . . . . . . . . . . . . . . . . . . .14113.ConceptsResolving Closely Spaced Signals . . . . . . . . . . . . . . . . . . . . . . . . . . . . . . . . . . . . . . . . . . . .146Trigger Concepts . . . . . . . . . . . . . . . . . . . . . . . . . . . . . . . . . . . . . . . . . . . . . . . . . . . . . . . . .148Time Gating Concepts . . . . . . . . . . . . . . . . . . . . . . . . . . . . . . . . . . . . . . . . . . . . . . . . . . . . .151AM and FM Demodulation Concepts . . . . . . . . . . . . . . . . . . . . . . . . . . . . . . . . . . . . . . . . .168IQ Analysis Concepts . . . . . . . . . . . . . . . . . . . . . . . . . . . . . . . . . . . . . . . . . . . . . . . . . . . . .169Spurious Emissions Measurement Concepts . . . . . . . . . . . . . . . . . . . . . . . . . . . . . . . . . . . .171Spectrum Emission Mask Measurement Concepts . . . . . . . . . . . . . . . . . . . . . . . . . . . . . . .172Occupied Bandwidth Measurement Concepts . . . . . . . . . . . . . . . . . . . . . . . . . . . . . . . . . . .17314.Programming ExamplesX-Series Spectrum Analyzer Mode Programing Examples . . . . . . . . . . . . . . . . . . . . . . . . .17689601X VXA Signal Analyzer Programming Examples . . . . . . . . . . . . . . . . . . . . . . . . . .1796
1Getting Started with the Spectrum AnalyzerMeasurement ApplicationThis chapter provides some basic information about using the Spectrum Analyzer and IQ AnalyzerMeasurement Application Modes. It includes topics on:“Making a Basic Measurement” on page 8. “Recommended Test Equipment” on page 12. “Accessories Available” on page 13.Getting Started with the SpectrumAnalyzer Measurement Application Technical Documentation Summary:Your Signal Analysis measurement platform:Getting StartedTurn on process, Windows XP use/configuration, Front and rear panel.SpecificationsSpecifications for all available Measurement Applications and optional hardware(for example, Spectrum Analyzer and W-CDMA).Functional TestingQuick checks to verify overall instrument operation.Instrument MessagesDescriptions of displayed messages of Information, Warnings and Errors.Measurement Application specific documentation:(For example, Spectrum Analyzer Measurement Application or W-CDMA Measurement Application.)Measurement Guide andProgramming ExamplesExamples of measurements made using the front panel keys or over a remoteinterface. The programming examples use a few different programming languages,and copies of the executable files are ions of front panel key functionality and the corresponding SCPIcommands. May also include some concept information.7
Getting Started with the Spectrum Analyzer Measurement ApplicationMaking a Basic MeasurementMaking a Basic MeasurementRefer to the description of the instrument front and rear panels to improve your understanding of theAgilent Signal Analyzer measurement platform. This knowledge will help you with the followingmeasurement example.Getting Started with the SpectrumAnalyzer Measurement ApplicationThis section includes: “Using the Front Panel” on page 9. “Presetting the Signal Analyzer” on page 10. “Viewing a Signal” on page 10.CAUTIONMake sure that the total power of all signals at the analyzer input does not exceed 30dBm (1 watt).8Chapter 1
Getting Started with the Spectrum Analyzer Measurement ApplicationMaking a Basic MeasurementUsing the Front PanelEntering DataWhen setting measurement parameters, there are several ways to enter or modify the value of the activefunction:Increments or decrements the current value.Arrow KeysIncrements or decrements the current value.Numeric KeypadEnters a specific value. Then press the desired terminator (either a unitsoftkey, or the Enter key).Unit SoftkeysTerminate a value that requires a unit-of-measurement.Enter KeyTerminates an entry when either no unit of measure is needed, or you wantto use the default unit.Using Menu KeysMenu Keys (which appear along the right side of the display) provide access to many analyzer functions.Here are examples of menu key types:ToggleAllows you to activate/deactivate states.Example:SubmenuDisplays a new menu of softkeys.Example:ChoiceA submenu key allows you to view a new menu of softkeysrelated to the submenu key category.Allows you to make a selection from a list of values.Example:AdjustToggles the selection (underlined choice) each time you press thekey.A choice key displays the currently selected submenu choice, inthis example, dBm. When the choice is made, the submenuautomatically returns.Highlights the softkey and sets the active function.Examples:Press this type of key and enter a value.The default for softkeys with an automatic (Auto) or manual(Man) choice is automatic. After you enter a value, the selectionchanges to manual. You can also press the softkey twice to changeto manual.Chapter 19Getting Started with the SpectrumAnalyzer Measurement ApplicationKnob
Getting Started with the Spectrum Analyzer Measurement ApplicationMaking a Basic MeasurementPresetting the Signal AnalyzerThe preset function provides a known starting point for making measurements. The analyzer has twomain types of preset:User PresetRestores the analyzer to a user-defined state.Mode PresetThis type of preset restores the currently selected mode to a default state.For details, see the help or User’s and Programmer’s Reference.Getting Started with the SpectrumAnalyzer Measurement ApplicationCreating a User PresetIf you constantly use settings which are not the normal defaults, use the following steps to create auser-defined preset:1. Set analyzer parameters as desired.2. Press User Preset, Save User Preset to set the current parameters as the user preset state.3. Then press User Preset, User Preset when you want to select the preset state.Viewing a Signal1. Press Mode Preset to return the current mode settings to its factory defaults.2. Press Input/Output, RF Calibrator, 50, MHz. to route the internal 50 MHz signal to the analyzerinput.3. Press AMPTD Y Scale, 10, dBm to set the reference level to 10 dBm.4. Press FREQ Channel, Center Freq, 40, MHz to set the center frequency to 40 MHz.The 50 MHz reference signal appears on the display.5. Press SPAN, 50, MHz to set the frequency span to 50 MHz.Reading Frequency & Amplitude6. Press Peak Search.This activates a marker and places it on the highest amplitude signal.Note that the frequency and amplitude of the marker appear in the active function block in theupper-right of the display. You can use the knob, the arrow keys, or the softkeys in the Peak Searchmenu to move the marker around on the signal.7. If you have moved the marker, return it to the peak of the 50 MHz signal by pressing Peak Searchagain.Changing Reference Level8. Press AMPLTD Y Scale and note that reference level (Ref Level) is now the active function. PressMarker ?, Mkr ? Ref Lvl.Note that changing the reference level changes the amplitude value of the top graticule line.10Chapter 1
Getting Started with the Spectrum Analyzer Measurement ApplicationMaking a Basic MeasurementImproving Frequency Accuracy9. To increase the accuracy of the frequency reading in the marker annotation, turn on the frequencycount function. Press Marker, More, Marker Count.The Marker Count softkeys appear.Note softkey Counter On Off. If Off is underlined, press the softkey to toggle marker count on.The marker active function annotation changes from Mkr1 to Cntr1. The displayed resolution in the marker annotation improves.NOTEWhen you use the frequency count function, if the ratio of the resolution bandwidth to thespan is less than 0.002, you would get a display message that you need to reduce theSpan/RBW ratio. This is because the resolution bandwidth is too narrow.10. Press Marker ?, Mkr ? CF to move the 50 MHz peak to the center of the display.Valid Marker Count Range11. Move the marker down the skirt of the 50 MHz peak. Note that although the readout in the activefunction changes, as long as the marker is at least 26 dB above the noise, the counted value(upper-right corner of display) does not change. For an accurate count, the marker does not have to beexactly at the displayed peak.NOTEMarker count functions properly only on CW signals or discrete peaks. For a validreading, the marker must be 26 dB above the noise.12. Press BW, Res BW, then enter a new value. This action makes the resolution bandwidth (RBW) theactive function and allows you to experiment with different resolution bandwidth values.13. Press Marker, Off to turn the marker off.Chapter 111Getting Started with the SpectrumAnalyzer Measurement Application
Getting Started with the Spectrum Analyzer Measurement ApplicationRecommended Test EquipmentRecommended Test EquipmentThe following table lists the test equipment you will need to perform the example measurementsdescribed in this manual.Getting Started with the SpectrumAnalyzer Measurement ApplicationNOTETo find descriptions of specific analyzer functions for the N9060A Spectrum AnalyzerMeasurement Application refer to the Agilent Technologies User’s and Programmer’sReference.Test EquipmentSpecificationsRecommended Model0.25 MHz to 4.0 GHzExt Ref InputE443XB series or E4438CSignal SourcesSignal Generator (2)AdaptersType-N (m) to BNC (f) (6)1250-0780CablesBNC, 122 cm (48 in) (3)10503AMiscellaneousDirectional Bridge86205A12Chapter 1
Getting Started with the Spectrum Analyzer Measurement ApplicationAccessories AvailableAccessories AvailableA number of accessories are available from Agilent Technologies to help you configure your analyzerfor your specific applications. They can be ordered through your local Agilent Sales and Service Officeand are listed below.NOTEFor the latest information on Agilent signal analyzer options and upgrade kits, visit thefollowing Internet URL: http://www.agilent.com/find/sa upgrades.50 Ohm LoadThe Agilent 909 series of loads come in several models and options providing a variety of frequencyranges and VSWRs. Also, they are available in either 50 ohm or 75 Ohm. Some examples include the:909A: DC to 18 GHz909C: DC to 2 GHz909D: DC to 26.5 GHz50 Ohm/75 Ohm Minimum Loss PadThe HP/Agilent 11852B is a low VSWR minimum loss pad that allows you to make measurements on 75Ohm devices using an analyzer with a 50 Ohm input. It is effective over a frequency range of dc to 2GHz.75 Ohm Matching TransformerThe HP/Agilent 11694A allows you to make measurements in 75 Ohm systems using an analyzer with a50 Ohm input. It is effective over a frequency range of 3 to 500 MHz.AC ProbeThe Agilent 85024A high frequency probe performs in-circuit measurements without adversely loadingthe circuit under test. The probe has an input capacitance of 0.7 pF shunted by 1 megohm of resistanceand operates over a frequency range of 300 kHz to 3 GHz. High probe sensitivity and low distortionlevels allow measurements to be made while taking advantage of the full dynamic range of the signalanalyzer.AC Probe (Low Frequency)The Agilent 41800A low frequency probe has a low input capacitance and a frequency range of 5 Hz to500 MHz.Chapter 113Getting Started with the SpectrumAnalyzer Measurement ApplicationThere are also some instrument options available that can improve your measurements.Some options can only be ordered when you make your original equipment purchase.Some are also available as kits that you can order and install later. Order kits through yourlocal Agilent Sales and Service Office.
Getting Started with the Spectrum Analyzer Measurement ApplicationAccessories AvailableBroadband Preamplifiers and Power AmplifiersGetting Started with the SpectrumAnalyzer Measurement ApplicationPreamplifiers and power amplifiers can be used with your signal analyzer to enhance measurements ofvery low-level signals. The Agilent 8447D preamplifier provides a minimum of 25 dB gain from 100 kHz to 1.3 GHz. The Agilent 87405A preamplifier provides a minimum of 22 dB gain from 10 MHz to 3 GHz. (Poweris supplied by the probe power output of the analyzer.) The Agilent 83006A preamplifier provides a minimum of 26 dB gain from 10 MHz to 26.5 GHz. The Agilent 85905A CATV 75 ohm preamplifier provides a minimum of 18 dB gain from 45 MHz to1 GHz. (Power is supplied by the probe power output of the analyzer.) The 11909A low noise preamplifier provides a minimum of 32 dB gain from 9 kHz to 1 GHz and atypical noise figure of 1.8 dB.GPIB CableThe Agilent 10833 Series GPIB cables interconnect GPIB devices and are available in four differentlengths (0.5 to 4 meters). GPIB cables are used to connect controllers to a signal analyzer.USB/GPIB CableThe Agilent 82357A USB/GPIB interface provides a direct connection from the USB port on your laptopor desktop PC to GPIB instruments. It comes with the SICL and VISA software for Windows 2000/XP.Using VISA software, your existing GPIB programs work immediately, without modification. The82357A is a standard Plug and Play device and you can interface with up to 14 GPIB instruments.RF and Transient LimitersThe Agilent 11867A and 11693A RF Limiters protect the analyzer input circuits from damage due tohigh power levels. The 11867A operates over a frequency range of dc to 1800 MHz and begins reflectingsignal levels over 1 mW up to 10 W average power and 100 watts peak power. The 11693A microwavelimiter (0.1 to 12.4 GHz, usable to 18 GHz) guards against input signals over 1 milliwatt up to 1 wattaverage power and 10 watts peak power.The Agilent 11947A Transient Limiter protects the analyzer input circuits from damage due to signaltransients. It specifically is needed for use with a line impedance stabilization network (LISN). Itoperates over a frequency range of 9 kHz to 200 MHz, with 10 dB of insertion loss.Power SplittersThe Agilent 11667A/B/C power splitters are two-resister type splitters that provide excellent outputSWR, at 50 Ω impedance. The tracking between the two output arms, over a broad frequency range,allows wideband measurements to be made with a minimum of uncertainty.11667A: DC to 18 GHz11667B: DC to 26.5 GHz11667C: DC to 50 GHz14Chapter 1
Getting Started with the Spectrum Analyzer Measurement ApplicationAccessories AvailableStatic Safety Accessories9300-1367Wrist-strap, color black, stainless steel. Four adjustable links and a 7 mm post-typeconnection.9300-0980Wrist-strap cord 1.5 m (5 ft.)Getting Started with the SpectrumAnalyzer Measurement ApplicationChapter 115
Getting Started with the SpectrumAnalyzer Measurement ApplicationGetting Started with the Spectrum Analyzer Measurement ApplicationAccessories Available16Chapter 1
Front and Rear Panel Features2Front and Rear Panel Features “Front-Panel Features” on page 18. “Display Annotations” on page 22. “Rear-Panel Features” on page 24. “Front and Rear Panel Symbols” on page 26.17
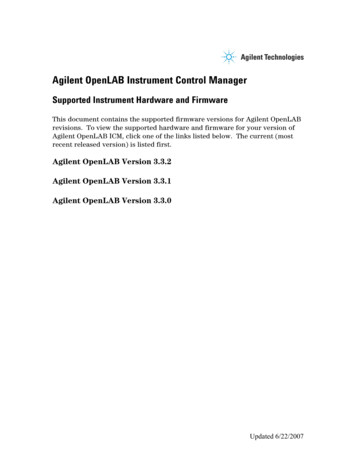
Front and Rear Panel FeaturesFront and Rear Panel FeaturesFront-Panel FeaturesFront-Panel FeaturesItemDescription#Name1Menu KeysKey labels appear to the left of the menu keys to identify the current functionof each key. The displayed functions are dependent on the currently selectedMode and Measurement, and are directly related to the most recent key press.2Analyzer Setup KeysThese keys set the parameters used for making measurements in the currentMode and Measurement.3Measurement KeysThese keys select the Mode, and the Measurement within the mode. They alsocontrol the initiation and rate of recurrence of measurements.4Marker KeysMarkers are often available for a measurement, to measure a very specificpoint/segment of data within the range of the current measurement data.5Utility KeysThese keys control system-wide functionality such as: instrument configuration information and I/O setup,printer setup and printing,file management, save and recall,instrument presets.6Probe PowerSupplies power for external high frequency probes and accessories.7Headphones OutputHeadphones can be used to hear any available audio output.8Back Space KeyPress this key to delete the previous character when entering alphanumericinformation. It also works as the Back key in Help and Explorer windows.18Chapter 2
ItemDescription#Name9Delete KeyPress this key to delete files, or to perform other deletion tasks.10USB ConnectorsStandard USB 2.0 ports, Type A. Connect to external peripherals such as amouse, keyboard, DVD drive, or hard drive.11Local/Cancel/(Esc) KeyIf you are in remote operation, Local: returns instrument control from remote back to local (the front panel).turns the display on (if it was turned off for remote operation).can be used to clear errors. (Press the key once to return to local control,and a second time to clear error message line.)If you have not already pressed the units or Enter key, Cancel exits thecurrently selected function without changing its value.Esc works the same as it does on a pc keyboard. It: exits Windows dialogsclears errorsaborts printingcancels operations.12RF InputConnector for inputting an external signal. Make sure that the total power of allsignals at the analyzer input does not exceed 30 dBm (1 watt).13Numeric KeypadEnters a specific numeric value for the current function. Entries appear on theupper left of the display, in the measurement information area.14Enter and Arrow KeysThe Enter key terminates data entry when either no unit of measure is needed,or you want to use the default unit.The arrow keys: Increment and decrement the value of the current measurement selection.Navigate help topics.Navigate, or make selections, within Windows dialogs.Navigate within forms used for setting up measurements.Navigate within tables.Note:The arrow keys cannot be used to move a mouse pointer aroundon the display.15Menu/ (Alt) KeyAlt works the same as a PC keyboard. Use it to change control focus inWindows pull-down menus.16Ctrl KeyCtrl works the same as a PC keyboard. Use it to navigate in Windowsapplications, or to select multiple items in lists.17Select / Space KeySelect is also the Space key and it has typical PC functionality. For example, inWindows dialogs, it selects files, checks and unchecks check boxes, and picksradio button choices. It opens a highlighted Help topic.18Tab KeysUse these keys to move between fields in Windows dialogs.19KnobIncrements and decrements the value of the current active function.20Return KeyExits the current menu and returns to the previous menu. Has typical PCfunctionality.Chapter 219Front and Rear Panel FeaturesFront and Rear Panel FeaturesFront-Panel Features
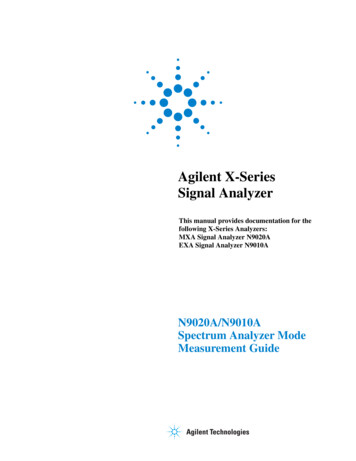
Front and Rear Panel FeaturesFront and Rear Panel FeaturesFront-Panel FeaturesItemDescription#Name21Full Screen KeyPressing this key turns off the softkeys to maximize the graticule display area.Press the key again to restore the normal display.22Help KeyInitiates a context-sensitive Help display for the current Mode. Once Help isaccessed, pressing a front panel key brings up the help topic for that keyfunction.23Speaker Control KeysEnables you to increase or decrease the speaker volume, or mute it.24Window Control KeysThese keys select between single or multiple window displays. They zoom thecurrent window to fill the data display, or change the currently selectedwindow. They can be used to switch between the Help window navigationpane and the topic pane.25Power Standby/ OnTurns the analyzer on. A green light indicates power on. A yellow lightindicates standby mode.Note:The front-panel switch is a standby switch, not a LINE switch(disconnecting device). The analyzer continues to draw powereven when the line switch is in standby.Th
Getting Started with the Spectrum Analyzer Measurement Application 1 Getting Started with the Spectrum Analyzer Measurement Application This chapter provides some basic information about using the Spectrum Analyzer and IQ Analyzer Measurement Application Modes. It includes topics on: "Making a Basic Measurement" on page 8.