Transcription
RF Fundamentals Part 2Spectral AnalysisDec 8, 2016Kevin NguyenKeysight Technologies
Agenda– Overview– Theory of Operation Traditional Spectrum Analyzers Modern Signal Analyzers– Specifications– Features– Wrap-upRF FundamentalsPart 2Page 2
OverviewWhat is Spectrum Analysis–Passive Receiver–Display and measureamplitude versus frequency–Separate or demodulatecomplex signals into theirbase components (sinewaves)RF FundamentalsPart 2Page 3
OverviewFrequency vs Time DomainAmplitude(power)Time domainMeasurements(Oscilloscope)Frequency DomainMeasurements(Spectrum Analyzer)RF FundamentalsPart 2Page 4
OverviewTypes of Measurements Available– Frequency, power,modulation, distortion, andnoise Spectrum monitoring Spurious emissions Scalar network analysis Noise figure & phase noise Harmonic & intermodulationdistortion Analog, digital, burst, &pulsed RF modulation Wide bandwidth vectoranalysis Electromagnetic interferenceModulationNoiseSpur SearchACP– Measurement range: -172 dBmto 30 dBm– Frequency range: 3 Hz to 1.1THzRF FundamentalsPart 2Page 5
OverviewDifferent Types of AnalyzersSwept AnalyzerAFilter 'sweeps' over rangeof interestLCD shows fullspectral displayf1f2fRF FundamentalsPart 2Page 6
OverviewDifferent Types of AnalyzersFFT AnalyzerAParallel filters measuredsimultaneouslyLCD shows fullspectral displayf1f2fRF FundamentalsPart 2Page 7
Analyzer Definitions– Spectrum Analyzer: A spectrum analyzer measures the magnitudeof an input signal versus frequency within the full frequency range ofthe instrument. The primary use is to display and measureAmplitude vs. Frequency of known and unknown RF and Microwavesignals.RF FundamentalsPart 2Page 8
Analyzer Definitions– Vector Signal Analyzer: A vector signal analyzer measures themagnitude and phase of an input signal at a single frequency withinthe IF bandwidth of the instrument. The primary use is to make inchannel measurements, such as error vector magnitude, codedomain power, and spectral flatness, on known signals.RF FundamentalsPart 2Page 9
Analyzer Definitions– Signal Analyzer: A signal analyzer provides the functions of aspectrum analyzer and a vector signal analyzer.RF FundamentalsPart 2Page 10
Agenda– Overview– Theory of Operation Traditional Spectrum Analyzers Modern Signal Analyzers– Specifications– Features– Wrap-upRF FundamentalsPart 2Page 11
Theory of OperationSwept Spectrum Analyzer Block DiagramRF InputAttenuatorIF GainIF re-Selector or LowPass Input talReferenceOscillatorADC, Display &Video ProcessingRF FundamentalsPart 2Page 12
Theory of OperationDisplay rtFrequencyFrequencySpanCenter FrequencyRF FundamentalsPart 2Page 13
MixerTheory of OperationMixerRFfsigLOfsig1.5 GHz3.6 GHzfsig - fLOIFfLOfsig fLOfLO6.5 GHzRF FundamentalsPart 2Page 14
IF FilterTheory of OperationIF Filter (Resolution Bandwidth (RBW)InputSpectrumIF Bandwidth(RBW)DisplayABCRF FundamentalsPart 2Page 15
Theory of OperationEnvelope DetectorBefore detectorAfter detectorEnvelopeDetectorRF FundamentalsPart 2Page 16
EnvelopeDetectorTheory of OperationEnvelope Detector and Detection TypesDigitally Implemented Detection TypesBins/Buckets(Sweep Points)Positive Detection: largest valuein bin displayedNegative detection: smallest valuein bin displayedSample detection: middle value inbin displayedOther Detectors: Normal(Rosenfell), Average (RMS Power)RF FundamentalsPart 2Page 17
EnvelopeDetectorTheory of OperationAverage Detector TypeVoltsPositive PeakDetectionbinxxSampleDetectionxNegative PeakDetectionTimePower Average Detection (rms): Square root of the sum of thesquares of ALL of the voltage data values in the bin divided by 50ΩRF FundamentalsPart 2Page 18
VideoFilterTheory of OperationVideo Filter (Video Bandwidth – VBW)RF FundamentalsPart 2Page 19
Theory of OperationHow it All Works Together – 3 GHz Spectrum AnalyzerSignal RangefLO - fsfs01LO Range23fLO fSfsGHzMixerfLOIF Filter012433.6Input5Detector66.53.6f IFSweep GeneratorALOfLO0343.65GHz6123 (GHz) fLCD Display6.5RF FundamentalsPart 2Page 20
Modern Signal Analyzer Block DiagramPre-ampDigital IFFilterAnalog IFFilterADCAttenuationDigital DetectorsFFTSwept vs. FFTDigital Log AmpYIGReplacedbyRF FundamentalsPart 2Page 21
Agenda– Overview– Theory of Operation Traditional Spectrum Analyzers Modern Signal Analyzers– Specifications– Features– Wrap-upRF FundamentalsPart 2Page 22
Key Specifications– Safe spectrum analysis– Frequency Range– Accuracy: Frequency & Amplitude– Resolution– Sensitivity– Distortion– Dynamic RangeRF FundamentalsPart 2Page 23
SpecificationsDefinitions– Specifications describe the performance of parameters covered bythe product warranty (temperature 0 to 55 C, unless otherwisenoted).– Typical values describe additional product performance informationthat is not covered by the product warranty. It is performance beyondspecification that 80 % of the units exhibit with a 95 % confidencelevel over the temperature range 20 to 30 C. Typical performancedoes not include measurement uncertainty.– Nominal values indicate expected performance, or describe productperformance that is useful in the application of the product, but is notcovered by the product warranty.RF FundamentalsPart 2Page 24
SpecificationsPracticing Safe Spectrum Analysis - Safe Hookups to RF– Use best practices to eliminate static discharge to the RF input!– Do not exceed the Damage Level on the RF Input!– Do not input signals with DC bias exceeding what the analyzer cantolerate while DC coupled!!0 V DC MAX 30dBm (1W) MAXRF FundamentalsPart 2Page 25
SpecificationsFrequency RangeDescriptionSpecificationsInternal MixingBands03 Hz to 3.6 GHz13.5 to 8.4 GHz28.3 to 13.6 GHz313.5 to 17.1 GHz417 to 26.5 GHz526.4 to 34.5 GHz634.4 to 50 GHzRF FundamentalsPart 2Page 26
SpecificationsAccuracy: Frequency & Amplitude- Components which contribute to uncertainty are: Input mismatch (VSWR) RF Input attenuator (Atten. switching uncertainty) Mixer and input filter (frequency response) IF gain/attenuation (reference level accuracy) RBW filters (RBW switching uncertainty) Log amp (display scale fidelity) Reference oscillator (frequency accuracy) Calibrator (amplitude accuracy)RF FundamentalsPart 2Page 27
SpecificationsAccuracy: Absolute vs RelativeAbsoluteAmplitudein dBmRelativeAmplitudein encyNote: Absolute accuracy is also “relative” to the calibrator reference pointRF FundamentalsPart 2Page 28
SpecificationsAccuracy: Frequency ResponseSignals in the Same Harmonic Band 1 dB0- 1 dBBAND 1Absolute amplitude accuracy – Specification: 1 dBRelative amplitude accuracy – Specification: 2 dBRF FundamentalsPart 2Page 29
SpecificationsAccuracy: Frequency Readout Accuracy [(time since lastadjustment x aging rate) temperature stability calibration accuracy] 1.55 x 10⁻⁷/ yearFrequency Readout Accuracy [(Marker Frequency x Frequency Reference Accuracy) (0.1% x Span) (5% x RBW) 2Hz (0.5 x Horizontal Resolution)] span / (sweep points – 1)Example: 1 GHz Marker Frequency, 400 kHz Span,3 kHz RBW, 1000 Sweep PointsCalculation: (1x10⁹Hz) x ( 1.55x10⁻⁷/Year)400kHz Span x 0.1%3kHz RBW x 5%2Hz 0.5 x 400kHz/(1000-1)Total uncertainty 155Hz 400Hz 150Hz 202Hz 907Hz– Utilizing internal frequency counter improves accuracy to 155 Hz– The maximum number of sweep points for the X-Series Analyzers is 40,001 whichhelps to achieve the best frequency readout accuracyRF FundamentalsPart 2Page 30
SpecificationsResolutionWhat Determines Resolution?ResolutionBandwidthRBW Type andSelectivityNoise SidebandsRF FundamentalsPart 2Page 31
SpecificationsResolution: Resolution BandwidthMixer3 dB BW3 dBEnvelopeDetectorInputSpectrumLOIF Filter/ ResolutionBandwidth Filter (RBW)SweepRBWDisplayRF FundamentalsPart 2Page 32
SpecificationsResolution: Resolution Bandwidth10 kHz RBW3 dB10 kHzDetermines resolvability of equal amplitude signalsRF FundamentalsPart 2Page 33
SpecificationsResolution: RBW Selectivity or Shape Factor3 dB3 dB BW60 dB60 dBBWSelectivity 60 dB BW3 dB BWDetermines resolvability of unequal amplitude signalsRF FundamentalsPart 2Page 34
SpecificationsResolution: RBW Selectivity or Shape FactorRBW 10 kHzRBW 1 kHzSelectivity 15:13 dBDistortionProducts7.5 kHz60 dB60 dB BW 15 kHz10 kHz 10 kHzRF FundamentalsPart 2Page 35
SpecificationsResolution: RBW Type and SelectivityTypical SelectivityAnalog 15:1Digital 5:1ANALOG FILTERDIGITAL FILTERRES BW 100 HzSPAN 3 kHzThe X-series RBW shape factor is 4.1:1RF FundamentalsPart 2Page 36
SpecificationsResolution: RBW Determines Sweep TimeMeas UncalSwept too fastThe penalty for sweeping too fast is an uncalibrated display.RF FundamentalsPart 2Page 37
Resolution: RBW Type Determines Sweep TimeAnalog RBW280 secDigital RBW2.3 secRF FundamentalsPart 2Page 38
SpecificationsResolution: Noise SidebandsPhase NoiseNoise sidebands can prevent resolution of unequal signals.RF FundamentalsPart 2Page 39
Res BWFilterLOSweepA spectrum analyzer generates and amplifies noise just like any active circuit.RF FundamentalsPart 2Page 40
SpecificationsSensitivity/DANL2.2 dBSensitivity is the smallest signal that can be measured.RF FundamentalsPart 2Page 41
SpecificationsSensitivity/DANL: IF Filter (RBW)Displayed noise is a function of IF filter bandwidth:noise decreases as bandwidth decreases.100 kHz RBW10 dB10 kHz RBW10 dB1 kHz RBWRF FundamentalsPart 2Page 42
SpecificationsMixerSensitivity/DANL:Video BW Filter or Trace AveragingVideo BW or trace averaging smoothes noise for easieridentification of low level signals.RF FundamentalsPart 2Page 43
SpecificationsSensitivity/DANL: Input AttenuationEffective level of displayed noise is a function of RF input attenuation:signal to noise ratio decreases as RF input attenuation increases.signal level10 dBAttenuation 10 dBAttenuation 20 dBRF FundamentalsPart 2Page 44
SpecificationsDynamic RangeThe ratio, expressed in dB, of the largest to the smallest signalssimultaneously present at the input of the spectrum analyzer that allowsmeasurement of the smaller signal to a given degree of uncertainty.DynamicRangeRF FundamentalsPart 2Page 45
SpecificationsDisplayed DANL per RBW and Mixer Input Power.SIGNAL-TO-NOISE RATIO, dBc0-20Displayed Noise in a1 kHz RBW-40-60-80-100-60Displayed Noise in a100 Hz RBW-300POWER AT MIXER INPUT - ATTENUATOR SETTING, dBm 30RF FundamentalsPart 2Page 46
SpecificationsDistortion: MixersFrequency TranslatedSignalsResultantSignal ToBe MeasuredMixer GeneratedDistortionRF FundamentalsPart 2Page 47
SpecificationsDistortion: Second and Third OrderDistortion products increase as a function of fundamental's power.332Powerin dBPowerin dB2f1- f 23f1f2Two-Tone Intermod2f2- f1f3f2fHarmonic DistortionThird Order: 3 dB/dB of FundamentalSecond Order: 2 dB/dB of FundamentalRF FundamentalsPart 2Page 48
SpecificationsDistortion: A Function of Mixer Level0DISTORTION, POWER AT MIXER INPUT - ATTENUATOR SETTING dBm 30SHIRF FundamentalsPart 2Page 49
SpecificationsDynamic Range (DANL, RBW, Distortion)SIGNAL-TO-NOISE RATIO,dBcDynamic range can be presented graphically.Maximum 2nd OrderDynamic Range-20Maximum 3rd OrderDynamic Range-40608010060Optimum Mixer Levels300 TOISOI 30POWER AT MIXER INPUT - ATTENUATOR SETTING dBmRF FundamentalsPart 2Page 50
SpecificationsDynamic RangeDynamic range for spur search depends on closeness to carrier.Dynamic RangeLimited ByCompression/NoiseDynamic RangeLimited By Noise SidebandsdBc/HzDisplayed AverageNoise LevelNoise Sidebands100 kHzto1 MHzRF FundamentalsPart 2Page 51
SpecificationsDynamic Range vs Measurement Range 30 dBmMAXIMUM POWER LEVEL 3 dBmDISPLAY RANGE100 dB @ 10 dB/Div(200 dB @ 20dB/Div)-40 dBmMEASUREMENTRANGE195 dBSIGNAL/NOISERANGE158 dBINCREASINGRBW ORATTENUATIONMIXER COMPRESSIONTHIRD-ORDER DISTORTION(Dynamic Range)SECOND-ORDER DISTORTION(Dynamic Range)-50 dBmNOISE SIDEBANDS0 dBc (Dynamic Range)SIGNAL /3rd ORDERDISTORTION115 dB range SIGNAL/ 2nd ORDERDISTORTION105 dB RANGESIGNAL/NOISESIDEBANDS-129 dBc @ 10kHzOFFSET-155 dBm (1 Hz BW & 0 dB ATTENUATION) MINIMUM NOISE FLOOR (DANL)-165 dBm with preampRF FundamentalsPart 2Page 52
Agenda– Overview– Theory of Operation Traditional Spectrum Analyzers Modern Signal Analyzers– Specifications– Features– Wrap-upRF FundamentalsPart 2Page 53
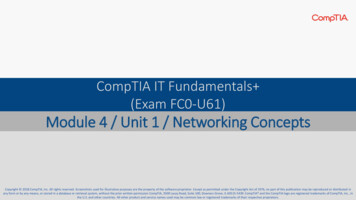
N OISE F LOOR E XTENSION ( N F E )FeaturesSensitivity/DANL: Noise Floor Extension Standard Standard With LNP With NFE With NFE–The PXA combines real-time measurement processing with an unprecedented characterization ofthe analyzer’s own noise to allow that noise to be accurately removed from measurements.–The improvement from noise floor extension varies from RF to millimeter wave. At RF, from about3.5 dB for CW and pulsed signals to approximately 8 dB for noise-like signals, and up to 12 dB ormore in some applications.–DANL at 2 GHz is –161 dBm without a preamp and –172 dBm with the preamp.RF FundamentalsPart 2Page 54
FeaturesSensitivity/DANL: Low Noise Path (LNP)–At microwave frequencies any sort of signal routing or switching results in signal path loss.–Preamplifiers can compensate for this loss and improve signal/noise for small signals, butthey can cause distortion in the presence of larger signals–LNP allows the “lossy” elements normally found in the RF input chain to be completelybypassed for highest sensitivity without a preamplifier–LNP allows measurements of small spurs w/o speed penalty imposed by narrow RBW thatwould otherwise be needed for adequate noise levelRF FundamentalsPart 2Page 55
FeaturesSensitivity/DANL: Low Noise Path Block DiagramRF FundamentalsPart 2Page 56
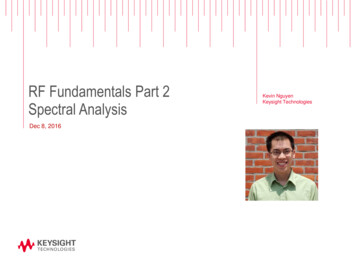
FeaturesFast Sweep ProcessingBy adjusting the phase response of the RBW filters, the LO can beswept at a faster rate without creating errors. 36 seconds 0.63 secondsSweep without fast sweep enabledSweep with fast sweep enabledRF FundamentalsPart 2Page 57
Data Acquisition and ProcessingSwept ModeSwept LO– A swept LO w/ an assignedRBW.Freq– Covers much wider span.Lost Information– Good for events that arestable in the frequencydomain.Lost Information– Magnitude ONLY, no phaseinformation (scalar info).Lost Information– Captures only events thatoccur at right time and rightfrequency point.– Data (info) loss when LO is“not there”.TimeRF FundamentalsPart 2Page 58
Data Acquisition and ProcessingVector Signal Analyzer ModeParked LO– A parked LO w/ a given IF BW– Collects IQ data over an intervalof time.FreqMeas TimeorFFTWindowLength– Performs FFT for time- freqdomain conversion– Captures both magnitude andphase information (vector info).Lost Information– Data is collected in bursts withdata loss between acquisitions.Meas TimeorFFTWindowLengthAnalysis BWTimeRF FundamentalsPart 2Page 59
Data Acquisition and ProcessingReal-Time ModeParked LO– A parked LO w/ a given IF BW– Collects IQ data over an interval oftime.Freq– Data is corrected and FFT’d inparallelAcquisition orslice time– Vector information is lost– Advanced displays for large amountsof FFT’sReal TimeProcessingSome data may stillbe “lost”Acquisition orslice timeReal-time BWTimeRF FundamentalsPart 2Page 60
Real-Time Spectrum AnalysisSwept vs RTSAFrom this .to thisRF FundamentalsPart 2Page 61
Real-Time DisplaysDensitySpectrumSpectrogramPower vs Time Also know asHistogramPersistence Colorindicatesnumber of hits Screentypicallyupdates every30 ms Persistencecan be manualor infinite Accumulate allFFT’s to asingle trace Apply detector Superimposedon the densitydisplay Used formarkeroperations Real-timespectrum slices –no gaps 10,000spectrogramtraces available Scroll throughstored traces Use markers onand betweentraces PvT overconfigurable range Gapless time datatransformed tofrequency domain Different displaysavailable Level based triggeravailableRF FundamentalsPart 2Page 62
P ROBABILITY OF I NTERCEPTD E T E C T LSpectrumOW L EVEL S IGNALS W ITH P RECISIONReal-TimeAnalysisApplication: Detect Low Level Signals with Precision– Short burst comms, LPI radar systems make itvery difficult to analyze jamming & interference– Communication jamming needs to be done veryquickly for adaptive threats– POI of 3.57 usec for 100% POI with full amplitudeaccuracy to catch the most elusive signals– Excellent noise performance at X-band furtherimproves POIRF FundamentalsPart 2Page 63
FeaturesTrace Zoom– Allows you to zoom inon your trace data– Same trace in bothscreens, but bottomscreen shows “close up”view with fewer points– Great to look moreclosely at high-densitytracesRF FundamentalsPart 2Page 64
ScalabilityMulti-Channel, Higher Speed/Throughput, Smaller FootprintRF FundamentalsPart 2Page 65
Extend Frequencies to 325GHz and Beyond– Supported measurements: Spectrum analysisBetter close-in phase noiseperformance than internallymixed 67 GHz analyzers! PowerSuite one-button powermeasurements N9068A phase noisemeasurement application 89600A VSA– Supported external mixers: M1970V/E/W 11970 Series OML Inc. VDIRF FundamentalsPart 2Page 66
Wide Analysis BandwidthModern designs demand more bandwidth for capturing high data ratesignals and analyzing the quality of digitally modulated bandwidths.Aerospace and Defense– Radar: chirp errors &modulation quality– Satellite: capture 36/72 MHzBWs with high data rates– Military Communications:capture high data rate digitalcomms & measure EVMEmerging Communications– WLAN, 802.16 (wirelesslast mile), mesh networks– Measure EVM onbroadband, high data ratesignalsCellular Communications– W-CDMA ACPR & multicarrier pre-distortion– High dynamic range over60 MHz BW to see low level3rd order distortion for 4carrier pre-distortionalgorithmsRF FundamentalsPart 2Page 67
RF Measurement Resources Keysight RF Learning Center www.keysight.com/find/klc Webcast Recordings Application Notes AN 150 – Spectrum Analysis Basics 8 Hints for Better Spectrum Analysis 10 Hints for Making Better Noise Figure Measurements Videos Register for Future WebcastsRF FundamentalsPart 2Page 68
- Spectrum Analyzer: A spectrum analyzer measures the magnitude of an input signal versus frequency within the full frequency range of . Video Filter (Video Bandwidth - VBW) Video Filter RF Fundamentals Part 2 . Page Theory of Operation 20 How it All Works Together - 3 GHz Spectrum Analyzer 3.6 GHz