Transcription
SOCIAL STUDIESWeek Eleven: Charts and Graphs IntroductionWeekly Focus: IntroductionWeekly Skill: Charts and GraphsLesson Summary: This week students will be introduced to various charts and graphs formats. They willbe asked to identify appropriate charts and graphs for particular scenarios. Finally, they will have anopportunity to create their own chart or graph.Materials Needed: Charts and graphs handout, Group Roles, In-Class Assignment/Assessment,paper, markers or color pencilsObjectives: Students will be able to Identify various types of graphs and chartsDemonstrate comprehension of charts and graphs by correctly answering comprehensionquestionsCorrectly match appropriate chart or graph as evidence to a claimCreate their own chart or graph to visually demonstrate informationCommon Core Standards Addressed: CCSS.ELA-Literacy.RH.11-12.2, CCSS.ELA-Literacy.RH.11-12.7Notes: On the 2014 test, students will need to not only be able to read a chart and/or graph, they willalso need to be able to think about charts and graphs as evidence and choose which chart orgraph bests supports a stated position.Heather Herrman, Minnesota Literacy Council, 2012p.1Updated by Lindsey Cermak, Minnesota Literacy Council, 2014GED Social Studies Curriculum
SOCIAL STUDIESWeek Eleven: Charts and Graphs IntroductionActivities:Testing: TABETime: 50 minutesFor the first hour, students will be testing on the TABE Reading test. Talk to your coordinator about thisas well as your role as a proctor.Break: 10 minutesActivity 1: Introduction to Charts and GraphsTime: 60 minutes1) Explain to students that today we will be looking at various types of charts and graphs.Being able to comprehend the information in these graphs will be an important skill for theGED test. We will continue to work with charts and graphs in the upcoming weeks.2) Warm-Up: Ask students to get into groups of three or four. Then, write these questions onthe board: What is a chart? What is a graph? What is one example of a chart or graphthat you’ve seen used recently? Why do people use charts and/or graphs instead of justwriting information in a paragraph or essay format? Have students take five to ten minutesin groups to brainstorm answers and then share out as a class. You may find it useful to passout “group roles” to students.3) Hand out Charts and Graphs Sheet. Read through the back “Tips” together. Then, askstudents in their groups to practice these tips by taking a look at the graphs on the front ofthe sheet (Hours GED Students Spend Studying). Assign each group a graph to look at andhave them, in their groups, answer these questions: What, in your own words, does thegraph show? How many people total are represented in the graph?4) Go over the answers as a class. All of the answer should be the same, or roughly the same.Explain to students that each of these graphs is showing the same information, just indifferent ways. Go over the different types of graphs together.5) Finally, explain to students that information on a chart or graph can also be used tosupport an argument. Ask students for what claim these graphs might be used asevidence to support. Give them this example: “GED students need a homework center.”Together, talk about why these graphs would support this claim. Have them discussanother possible claim in groups and come back together to share.Assessment: Have students work in groups or individually to complete the assessment activity, thengo over as a class.Extension Activity: Creating Chart or GraphTime: 50 minutesDivide students into groups and have them follow the steps on the extension activity on theassignment sheet. Save time for groups to present their graphs at the end of class.Heather Herrman, Minnesota Literacy Council, 2012p.2Updated by Lindsey Cermak, Minnesota Literacy Council, 2014GED Social Studies Curriculum
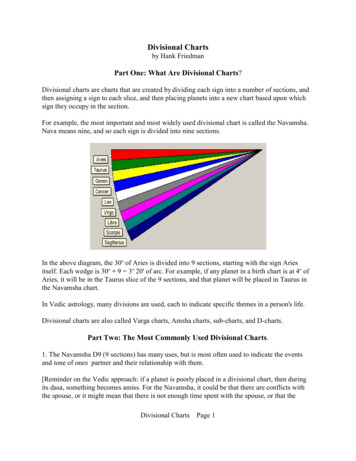
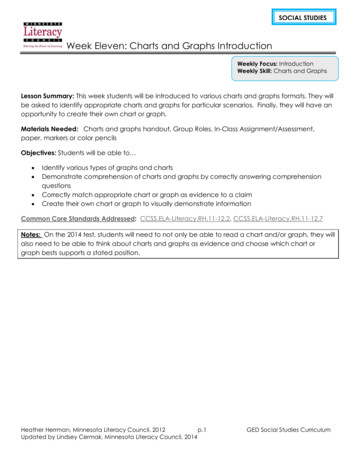
SOCIAL STUDIESWeek Eleven: Charts and Graphs IntroductionTYPES OF CHARTS AND GRAPHSPie GraphBar GraphLine GraphHours GEDStudents Studyper WeekHours GEDStudents Studyper WeekHours GEDStudents Studyper Week35%31%3 hours4 hoursor moreStudents19% 15%2 hoursStudentsStudents1 hour orless1098765432101234hour hours hours hoursororlessmore109876543210Chart/TableHours GEDStudents Studyper Week985# ofStudentsHours Studied perweek41 hour or less82 hours93 hours54 hours or less41 hour 234or less hours hours hoursormore26 Students Surveyed Pie graphs show what part ofa whole something is. Parts must add up to 100% Bar graphs use rectangularbars to show how large eachvalue is. The bars may be horizontalor vertical.Heather Herrman, Minnesota Literacy Council, 2012p.3Updated by Lindsey Cermak, Minnesota Literacy Council, 2014 A line graph uses pointsconnected by lines to showhow large in valuesomething is.GED Social Studies Curriculum A chart orders informationin rows and columns.
SOCIAL STUDIESWeek Eleven: Charts and Graphs IntroductionTIPS FOR READING CHARTS AND GRAPHSCharts and Graphs: Visual forms of representing data.Charts and graphs use pictures and words to provide a quick snapshot of information.BEFORE YOU READ1. Read the title or heading of the visual first. This will indicate the topic of the graphic or the type of information presented.2. Next read all the labels on the visual. These are usually written along the vertical and horizontal axes of the chart or table.The labels tell you what each line, mark, or section on the graphic represents.3. Read any other text that has been written on or around the graphic. Writers often provide short explanations for thedifferent parts of the graphic.4. Lines or sections on the graphic may be printed in different colors or patterns. Look for a key to tell you what the differentcolors mean. Each color represents a different category of data.5. Symbols may also be used to represent information. Look for a key to tell you what the symbols mean.AS YOU READ6. Take notes on the data you found in the chart, table, timeline, or graph. This will help you keep the information organized.AFTER YOU READ7. Analyze the data you gathered and determine what conclusions you can draw based on the data.8. Remember that valuable information is contained in the visual representations of data. You may be tested on items foundthere.Tips excerpted from International Center for Learner Leadership in Education: Reading Strategies for Career Academies and Career-TechnicalEducationHeather Herrman, Minnesota Literacy Council, 2012p.4Updated by Lindsey Cermak, Minnesota Literacy Council, 2014GED Social Studies Curriculum
SOCIAL STUDIESWeek Eleven: Charts and Graphs IntroductionGroup Work RolesLEADER Makes sure that every voice is heardFocuses work around the learning task; guide group from exercise to exerciseSound bites: Let’s hear from next.” “That’s interesting, but let’s get back to our task.”RECORDER Compiles group members’ ideas:o Make a star on the sections/numbers we need to go overo Write specific questionsSound bites: “I think I heard you say ; is that right?” “How would you like me to writethis?”TIME KEEPER Encourages the group to stay on taskAnnounces when time is halfway through and when time is nearly upSound bite: "We only have five minutes left. Let’s see if we can wrap up by then.”PRESENTER Presents the group’s finished work to the classSound bite: “Which questions do we need to go over in this section?” “What else do weneed to ask?Created by Jen Ouellette for the Minnesota Literacy CouncilHeather Herrman, Minnesota Literacy Council, 2012p.5Updated by Lindsey Cermak, Minnesota Literacy Council, 2014GED Social Studies Curriculum
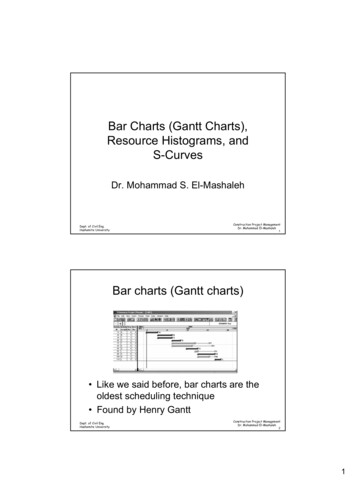
SOCIAL STUDIESWeek Eleven: Charts and Graphs IntroductionIN-CLASS ASSESSMENTI. CHARTS AND GRAPHS COMPREHENSION QUESTIONSDirections: Look at each of the charts and graphs examples below and answer the questionsbeneath them.Graph 1: U.S. Average Family Spending1) What type of chart or graph is this?2) In your own words, what does this graph show?3) What are three different categories of spending that the graph shows?4) What is one fact that you learned from this graph?BONUS QUESTION: What is a claim that could use this graph as evidence to support it?Heather Herrman, Minnesota Literacy Council, 2012p.6Updated by Lindsey Cermak, Minnesota Literacy Council, 2014GED Social Studies Curriculum
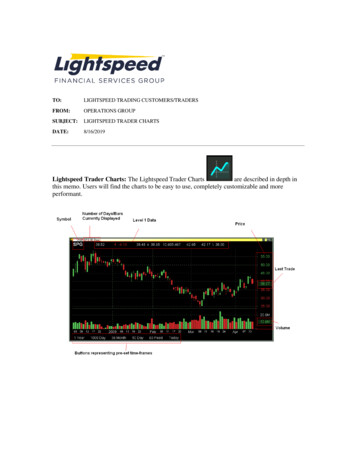
SOCIAL STUDIESWeek Eleven: Charts and Graphs IntroductionExample 2:1) What type of chart or graph is this?2) In your own words, what does this graph show?3) What do the numbers on the Y axis represent?4) What do each of the bar colors represent? Which bar color represents more than onegroup?5) What are three different categories of age that the graph shows?Heather Herrman, Minnesota Literacy Council, 2012p.7Updated by Lindsey Cermak, Minnesota Literacy Council, 2014GED Social Studies Curriculum
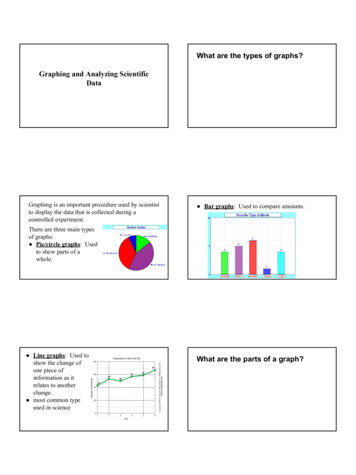
SOCIAL STUDIESWeek Eleven: Charts and Graphs IntroductionExample 3:1) What type of chart or graph is this?2) In your own words, what does this graph show?3) What do the numbers on the y-axis represent?4) What are the categories on the x-axis?5) What, overall, can you tell about the nation’s population by looking at this graph?BONUS QUESTION: What is a claim that could use this graph as evidence to support it?Heather Herrman, Minnesota Literacy Council, 2012p.8Updated by Lindsey Cermak, Minnesota Literacy Council, 2014GED Social Studies Curriculum
SOCIAL STUDIESWeek Eleven: Charts and Graphs IntroductionExample 4:Average Daily Temperature in St. PaulDateJanuary 1Average DailyTemperature(degreesFahrenheit)5January 28January 322January 421January 513January 63January 72Using the information in the chart above, create a line graph below.Heather Herrman, Minnesota Literacy Council, 2012p.9Updated by Lindsey Cermak, Minnesota Literacy Council, 2014GED Social Studies Curriculum
SOCIAL STUDIESWeek Eleven: Charts and Graphs IntroductionII. CREATE YOUR OWN GRAPHDirections:1) First, come up with a question that you’d like to ask the class. The question should either be ayes/no question or a question that you can represent with numbers.2) Write the question in the survey box below. Then, send one member of the group around tosurvey the other groups. He or she should record and report back with the answers.3) Decide as a group if you’d like to create a pie graph, bar graph, line graph, or table. Worktogether to prepare a visual representation of the information that you have gathered. Useanother sheet of paper to make the table/graph.4) Your graph should have a title and key.5) Be ready to present your graph to the class.Question:Total Number of People Surveyed:Results:Heather Herrman, Minnesota Literacy Council, 2012p.10Updated by Lindsey Cermak, Minnesota Literacy Council, 2014GED Social Studies Curriculum
in groups to brainstorm answers and then share out as a class. You may find it useful to pass out "group roles" to students. 3) Hand out Charts and Graphs Sheet. Read through the back "Tips" together. Then, ask students in their groups to practice these tips by taking a look at the graphs on the front of