Transcription
NeW yORk ChICAgO LONDON DUBAI* TOkyO sINgAPORe syDNey ADAThe secrets of CandlestickCharts UnveiledBy GFTAbove all, Integrity.FUTURES FOREX CFDsWorldwide Leaders in Online TradingCD04U.041.102808*Coming soon616 956 9273gftforex.comm A INW e B / L I v e C h AT
INTRODUCTIONOver the last few decades, traders have begun to use candlestick charts farmore frequently than any other technical analysis tool.Candlestick charts have a simple, easy to analyze appearance. Unlike bar orline charts, candlestick charts provide more detailed information about themarket at a glance. With this information, you can use candlestick charts,one of the seven types of charts available within DealBook 360, to makedecisions about the market quickly and with more confidence.The Secrets of Candlestick Charts Unveiled2
The First Light:A Brief History of Candlestick ChartsThe principles behind candlestick charting were first developed over 250 yearsago by Munehisa Homma*, a Japanese businessman who traded rice futures.Homma realized that the rice futures market was strongly influenced by theemotions of the traders. He knew that traders tended to hold on to their positionsfor as long as the market moved their way. If something happened in the marketand the traders lost confidence, they would reverse their positions quickly.Homma understood that what happened between the open and the close of ricefutures was essential to technical interpretation, so he developed a process toreliably track trader confidence and identify trends in the market.These principles, which form the basis of modern candlestick charting, were sosuccessful that Homma became very wealthy and the number of people whoused his principles to trade grew. Over time, Japanese traders found Homma’sprinciples so useful that he received the title of honorary Samurai.Be Nimble:The Benefits of Candlestick ChartsToday, candlestick charts are one of the most common tools traders use fortechnical analysis. Most traders prefer to use the candlestick chart because it canhelp them to: Determine the current state of the market at a glance. Just by lookingat the color and length of a candlestick, traders can determine instantly if themarket is strengthening (becoming bullish) or weakening (becoming bearish). See the direction of the market more easily. On a candlestick chart, the colorand shape of the candlestick can help traders determine if an uptrend is part ofbullish momentum or simply a bearish spike. Identify market patterns quickly. Candlestick charts display specific bullishand bearish reversal patterns that cannot be seen on other charts.*Many histories of candlestick charting refer to Munehisa Homma as Munehisa Honma. Some texts even state his name as SokyuHomma or Sokyu Honma. We refer to him throughout the document as Munehisa Homma.The Secrets of Candlestick Charts Unveiled3
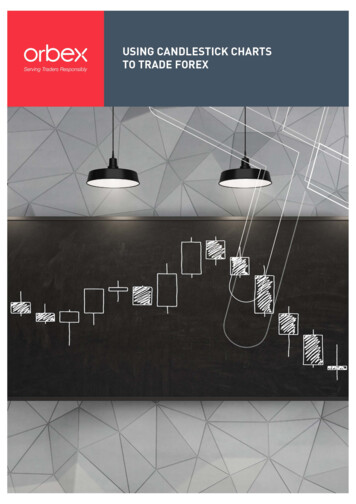
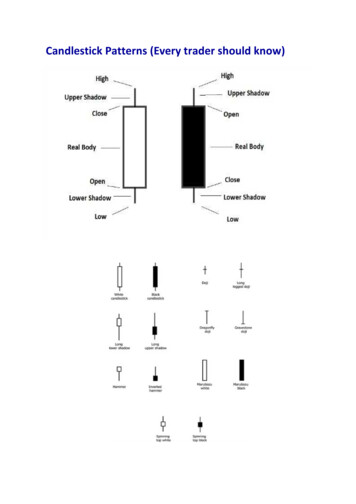
FLAme ON: CANDLesTICk FeATUResWhen you open a candlestick chart, you may notice that it looks similarto a bar chart.!!Figure 1. A bar chart (left) and a candlestick chart (right) for gBP/UsD currency pair.highCloseLike the bars in a bar chart, eachcandlestick on the candlestick chartshows the range of a currency in a verticalline and is defined by four price points(high, low, open and close).OpenLowFigure 2. A candlestick and its price points.At this point, you may be wondering, “So, how can candlestick charts tell memore about the state of the market?” We’ll discuss this in a moment. First, let’stake a closer look at candlesticks.The Secrets of Candlestick Charts Unveiled4
ANATOmy OF A CANDLesTICkshadowEach candlestick is made up of two parts– a body and shadows.BodyshadowThe candlestick body is a rectangle that represents the level of trading activityfor a specified period. For example, on a chart with a ten minute time scale, acandlestick would represent all of the trading activity in a ten minute period onthe market.Candlestick shadows (also called tails or wicks) are the thin lines above and belowthe body. An upper shadow displays how high trading went while a lower shadowshows how low it went.ReADINg CANDLesTICksThe appearance of the candlestick body and its shadows provide a lot ofinformation about the state of the market and where it’s going.The length of the candlestick body shows where the majority of the trading tookplace. A long body suggests that the market is trading heavily in one direction,while a small body indicates lighter trading.In our examples, you’ll notice that green candlesticks appear in an “up” candle;in other words, the currency closed higher than the previous candle’s close. Redcandlesticks show a “down” candle or that the currency closed below the previouscandle’s open.The Secrets of Candlestick Charts Unveiled5
Figure 3. Candlesticks of up trends are colored green and those of down trends are red.Traditionally, up trends were represented by white candlesticks, while downtrends were depicted by black candlesticks. Today, traders using DealBook 360can select any color combination they want. For our purposes, we’ll continue touse the green and red colors to show ups and downs.Figure 4. examples of long and short bodies and shadows on the daily euro/dollar chart.The appearance of shadows can also tell you which way themarket is heading. Long shadows show that trading went far pastthe open and close values while short shadows indicate that mostof the trading happened near the open and close. Typically, shortshadows mean that there is little change in the market direction,but a long shadow can signify a big change.The Secrets of Candlestick Charts Unveiled6
IDeNTIFyINg CANDLesTICk PATTeRNsBeing able to read the candlesticks in a candlestick chart can help you see thecurrent state and direction of the market. This can help you make decisions aboutthe market now, but how about what the market will do in the future?Candlestick charts can also display specific bullish (strengthening) and bearish(weakening) patterns that cannot be seen on other charts. These can help youfind potential market opportunities and make decisions about what to do in thefuture. Let’s look at a few patterns that may help you.ONe-DAy ReveRsAL PATTeRNsOne pattern that traders frequently look for is a candlestick reversal pattern.You may already know that a reversal indicates a sudden change in the marketdirection. For example, a bullish reversal means that the market may move upfrom a down trend while a bearish reversal indicates that the market is shiftingdown from an up trend.A one-day reversal is usually a signal that the general direction of the market forthat day is changing. While one-day reversals are significant to traders for shortterm trading, they know this pattern can also be the starting point of a more longterm market reversal.One of the most recognized one-day reversal patterns is the doji.On a candlestick chart, a doji resembles a cross because it has littleto no body.!The Secrets of Candlestick Charts Unveiled7
When a doji appears on a chart, it usually means the opening and closing pricesof the candlestick were identical. This means that the market reached the end ofthe trend and temporarily balanced. Usually, the markets tend to reverse after adoji appears, although significant market pressure on one side may postpone thereversal briefly.There are many variations of the doji. For example, the long-legged doji has longupper and lower shadows that show the level of trader indecision in the market.When a doji appears midway through an up or down trend, the pattern is called arickshaw man. Often, the appearance of this doji means that the trend is aboutto reverse suddenly.A paper umbrella is a doji candlestick with a small body and along lower shadow. When this type of doji appears at the top of anuptrend, it is called a hangman. When a paper umbrella appearsat the bottom of a downtrend, it is called a hammer.Figure 5. example of a hangman in dollar/yen.A doji may also appear with other patterns that indicate reversal trends in themarket. Whenever a doji appears, traders should watch the market and preparefor a reversal.The Secrets of Candlestick Charts Unveiled8
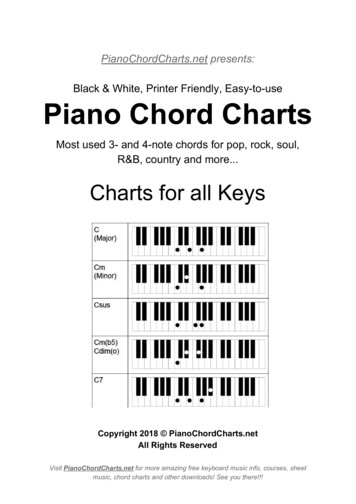
TWO-DAy CANDLesTICk ReveRsAL PATTeRNsAnother type of candlestick reversal pattern is the two-day reversal pattern. Again,this kind of reversal signals that the general direction of the market is changing,but the change occurs over two days. These patterns appear at an extreme up ordown trend in the market, so many traders watch for these patterns so that they canmanage their own position in the market.Like one-day reversal patterns, a two-day reversal pattern can be either bullish orbearish. In this section, we’ll look first at bullish and then bearish reversal patterns.The most common bullish reversal patterns are the bullish engulfing pattern andthe piercing line pattern.!Figure 6. example of a bullish engulfing pattern on the daily dollar/yen chart.The bullish engulfing pattern occurs at the end of a down trendand consists of a bullish candlestick with a body longer than theprevious day’s bearish body. Bar chart users may recognize this asa bullish key reversal. Note that the bullish engulfing candlestickdoesn’t have to reverse the entire previous bearish candlestick —only its body.The Secrets of Candlestick Charts Unveiled9
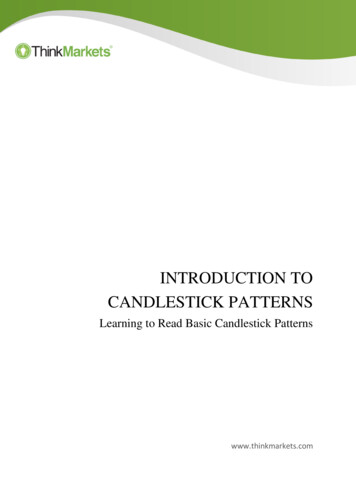
The piercing line is a miniature version of a bullish engulfingpattern. Following a bearish movement in the markets, thecurrency opens at the same level as the previous low and closes ator above the 50 percent level of the previous candlestick’s range.!Figure 7. example of the piercing line seen on the Australian dollar/Japanese yen chart.In contrast, the two most common bearish reversal patterns are the bearishengulfing pattern and the dark cloud cover pattern.!!Figure 8. A market example of the bearish engulfing pattern in sterling/dollar.The bearish engulfing pattern appears at the high of anuptrend and is formed by a bearish candlestick with a bodylonger than the previous day’s bearish body. It closes below thelow of the previous candle.The Secrets of Candlestick Charts Unveiled10
The dark cloud cover pattern occurs at the top of an up trend andconsists of one long bullish candlestick followed by two bearishcandlesticks, the first long and the second short. The long bearishcandlestick, which is considered the “dark cloud,” must have aclosing price within the price range of the bullish candlestick, butis also below the midpoint of bullish candlestick’s open and closeprices.!Figure 9. An example of a dark cloud cover pattern on the euro/Norwaykroner daily chart.Again, recognizing these reversal patterns in a trend helps traders make decisionsabout their position and prepare for movement in the market.The Secrets of Candlestick Charts Unveiled11
The “WAIT AND see” PATTeRNsWhile most patterns on the candlestick chart can show you possible up or downtrends, certain patterns can also indicate when traders should slow or stop tradingand wait for clearer market signals. These are called wait and see patterns; two ofthe best known are the inside range and tweezers.Figure 10. Three inside ranges in euro/dollar before the pair broke higher.An inside range is a pattern where the open and close of onecandlestick happen within the body of the previous candlestick.This pattern can appear over two or more days and often theconsecutive ranges face in opposite directions.When an inside range occurs, the market movement is slight and provides littleindication of its direction. For traders, this pattern usually means securing theirpositions and waiting until a new pattern in the market emerges.The tweezers refers to two consecutive candlesticks that have matching highsor lows. When the consecutive candlesticks have matching highs, the pattern iscalled a tweezers top. When candlesticks have matching lows, the pattern is atweezers low.The tweezers pattern indicates that a currency is rising to a specific price, fallingto a lower price, and then repeating the rise and fall. As with the inside rangepattern, traders who can see a tweezers pattern in the charts should slow andeven possibly stop their trading until a clearer trend in the market emerges.The Secrets of Candlestick Charts Unveiled12
Sakata’s Five MethodsBefore Homma developed candlestick charting, traders in his hometown of Sakata,Japan followed a set of rules and methods called Sakata’s Constitution. Hommalater used a set of patterns in this constitution, called Sakata’s Five Methods, asthe basis of his candlestick charting principles. Today, these patterns still help tradersidentify simple trends in the market.Sakata’s Five Methods consist of five specific patterns: three mountains, threerivers, three gaps, three parallel lines, and three methods. What’s thesignificance of three? Japanese culture at the time believed three to be a significant,even divine number. Homma also believed that when traders found a promisingtrade, they should wait for three days. If the trade still looked good after three days,it would then be profitable.As you read the description of these patterns, some may already sound familiar toyou. Nonetheless, these candlestick formations can help you predict simple trends inthe market.The three mountains pattern shows three candlesticks moving up or down in atrend. Usually, this pattern indicates that the trend is about to end. If the middlecandlestick is higher than the other two, the formation becomes a three Buddhaformation or a head-and-shoulders pattern. Traders should plan for the market toreverse its direction.The three river method also indicates a reversal pattern. This pattern looks differentdepending on if the reversal is bullish or bearish. The bearish version of this pattern,called a three river evening star, shows a long bullish candlestick, a short, bullishcandlestick (also called an island or a star), and a bearish candlestick where the lowis below the midpoint of the candlestick body on the first day. The bullish version,called a three river morning star, shows a long bearish candlestick, a short, bearishcandlestick, and a bullish candlestick where the low is below the midpoint of thecandlestick body on the first day.The three gaps pattern appears when the trading is high. A gap happens whenthe opening price moves significantly higher or lower than the close of the lastcandlestick and creates an empty spot on the chart. The three gaps pattern usuallymeans a trend is over and is about to change. After the third gap of this patternappears and the market reverses, the market moves enough to close the length ofthe second gap.The Secrets of Candlestick Charts Unveiled13
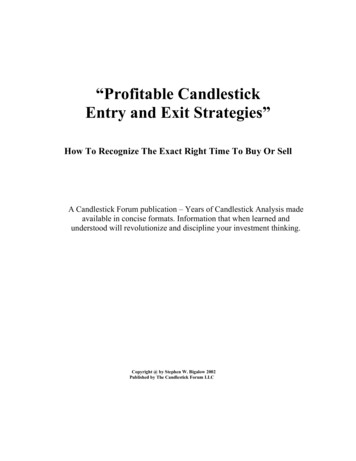
The three parallel candlestick pattern refers to three consecutive candlesticksthat are going the same way and have a similar height. This means the ongoingdirection is expected to continue and traders should plan accordingly. When thethree candlesticks are bullish, the formation is known as the three soldiers; whenbearish, the pattern is called the three crows.The rising three method is a pattern that shows a long candlestickfollowed by three short candlesticks moving in the oppositedirection. These are followed by another long candlestick thatcontinues the original trend.Figure 11. A market example of the three rising method in the dollar/yen.In Figure 11, you can see a bearish rising three: a bearish candlestick is followedby three bullish candlesticks and then another bearish candlestick. This patternusually means there is inactivity in the market and that a lot of tight trading ishappening.The Secrets of Candlestick Charts Unveiled14
Summary and ConclusionWhile candlestick charting may seem like a lot to learn, don’t worry. As youread candlestick charts, these common patterns will become more familiarto you. Over time, you’ll learn about other patterns and combinations ofpatterns that you can use to determine the state of the market, anticipateits possible direction, and identify market patterns.One of the best ways to analyze candlestick charts and test yourknowledge of patterns is by opening a GFT practice trading account. If youalready have a live account with GFT, you can also view candlestick chartingon historical data. DealBook 360 enables you to view candlestick charts ina range of time scales and even compare other charting types. In no time atall, you’ll see why candlestick charts are one of the most popular and trulyuseful technical analysis tools.GFT refers to Global Futures & Forex, Ltd. and all of its divisions, branches and subsidiaries, including Global Forex Trading and GFT Global Markets UK Limited. Global Futures& Forex, Ltd., doing business as Global Forex Trading and as GFT Futures, is registered with the U.S. Commodity Futures Trading Commission as a futures commission merchant,and is a member of the National Futures Association. In Japan, Global Futures & Forex, Ltd. is registered with the Financial Services Agency as a financial instruments firm and isa member of the Financial Futures Association of Japan. In Australia, GFT refers to Global Futures & Forex, Ltd., ARBN 103 508 461, Australian Financial Services Licence number226625. For Australian investors, a Product Disclosure Statement (PDS) is available from the company website www.gft.com.au. Interested parties should read and consider thePDS before making any decision to deal in GFT products. In the United Kingdom, GFT is the business name of GFT Global Markets UK Limited, which is registered in England andWales (Registration No. 5394757), with registered address of 34th Floor CGC 34-03, 25 Canada Square, London E14 5LQ, and is authorised and regulated by the FinancialServices Authority. , , GFT , CFD 360 , CHART STUDIO , DEALBOOK , FORESIGHT-A.I , FX 360 , SPREADBETTING 360 , are either registered trademarksor trademarks of Global Futures & Forex, Ltd., in the United States and/or other countries. The absence of a name or logo in this list does not constitute a waiver of any and allintellectual property rights that Global Futures & Forex, Ltd. has established in any of its trademarks, service marks or logos. All other trademarks, service marks or logos are theproperty of their respective owners. Each investment product is offered only to and from jurisdictions where solicitation and sale are lawful, and in accordance with applicablelaws and regulations in such jurisdiction. Trading of foreign exchange contracts, contracts for differences (CFDs), derivatives and other investment products which are leveraged,can carry a high level of risk and may not be suitable for all investors. It is possible to lose more than the initial investment. The risks must be understood prior to trading. 2008Global Futures & Forex, Ltd. All rights reserved.The Secrets of Candlestick Charts Unveiled15
The Secrets of Candlestick Charts Unveiled Over the last few decades, traders have begun to use candlestick charts far more frequently than any other technical analysis tool. Candlestick charts have a simple, easy to analyze appearance. Unlike bar or line charts, candlestick charts provid