Transcription
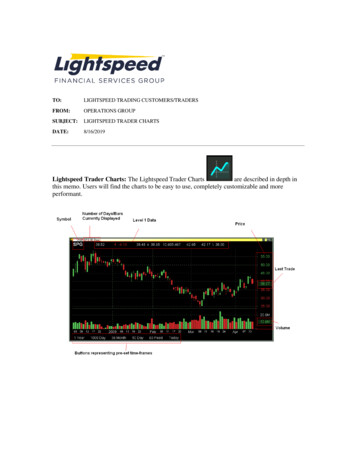
TO:LIGHTSPEED TRADING CUSTOMERS/TRADERSFROM:OPERATIONS GROUPSUBJECT:LIGHTSPEED TRADER CHARTSDATE:8/16/2019Lightspeed Trader Charts: The Lightspeed Trader Chartsare described in depth inthis memo. Users will find the charts to be easy to use, completely customizable and moreperformant.
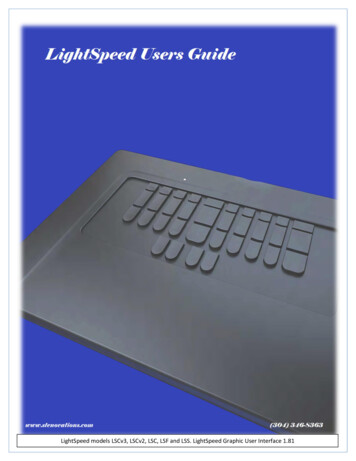
I.Changing the Chart ParametersThe charts allow users to create time frame “buttons.” These buttons are used to quickly switchbetween pre-defined time frames and chart settings and are displayed at the bottom of your chartwindow.There are several ways to change the Chart Parameters you are looking at: 1) Buttons at thebottom of the chart, 2) Right Clicking and Selecting Chart Parameters, 3) Using your mousewheel to Scroll backward/forward through time.1) Selecting Chart ParametersSelect from Daily, Weekly, Monthly Periods and enter your # of Days, Weeks, Months back. Ifyou select and Intraday period, you may choose from a # of Days Back or for a Fixed bar size,select a # of Bars Back.2) Using and Editing the ButtonsYou may use the predefined Timeframe Buttons to change the Displayed Timeframe or you maycreate your own buttons with Timeframes. To create your own button, select the parameters inthe above window, name it, then click Add.Note: Users can also map the keyboard keys “Chart Button Next” and “Chart Button Previous”from the Non-Trading Function keys on the Keyboard Tab to cycle through their pre-definedChart Parameters.3) Zooming/Changing Timeframes with your Mouse wheelWhen using your mouse to change time frames, it will scroll back in the period you are currentlyviewing. For instance, if you are looking at a Daily Chart the mouse wheel will scroll back Days,and if you are looking at a Weekly chart you will scroll back in weeks. When viewing anIntraday Chart you can scroll back in Bars if you have selected to view a # of Bars back or youwill scroll back in Days back respectively.Note: If you want to modify an existing button you must first select the button, then modify theparameters, and then select Add again. Or, you must select your parameters, retype the name ofthe button and then select Add. Once you click on an existing button without selecting Add, yourchanges will be lost.
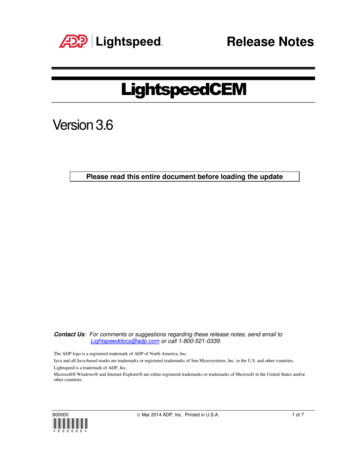
II. Chart Style Part 1: Customizing the Colors1.2.3.4.5.6.7.8.Change the background color of the chart.Change the foreground color of the chart (gridlines and axis lines).Change the text color.Change the up/down text color (the colored axis, the net change, executions). Note: Thisdoes not change the color of your candles or bars, which is changed in the “Studies” Tab.Modify the Font of the Symbol in the top right corner of your chart.Modify the Font of the Level 1 information and your buttons.Modify the Font of your Axis Labels.Save your Layout as a Style. This will allow you to save different styles of charts. The“Style” includes all of the above settings (Colors and Fonts) as well as any studies youhave added.
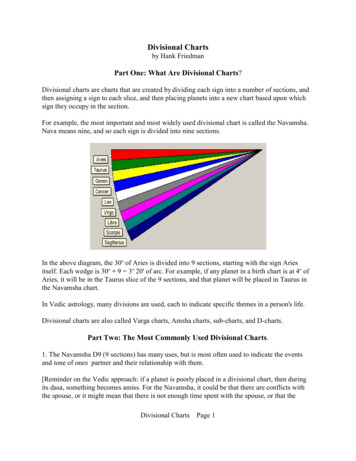
III. Chart Style Part 2: Customizing Chart TypeSelecting Price Chart TypeCandle: When Candle is selected, choose yourup and down candle color and size and size ofthe wickHollow Candle: Also called “JapaneseCandle” will display hollow “Up” Candles andColored “Down” Candles.OHLC Bar: Configure the colors for your up/down Bars easily.Line: The Line of a Line Charts can be madethin, medium or thick.Mountain: Mountain Charts are shaded-inLine ChartsSimple Bar: Simple Bar Charts are typicallyused to plot volume but can also be used in thePrice Chart
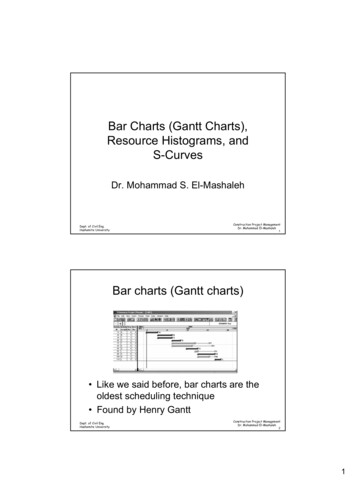
IV. Chart Style Part 3: Adding StudiesTo add a Study right click in the chart and select the Studies option, you will be taken to theStudies tab, seen above. Select from Simple Moving Average, Exponential Moving Average,Bollinger Bands, MACD, RSI, Previous Close Line, or Comparison Charts.Moving Average and Exponential MovingAverage: The Average will be calculatedbased on the closing price of the last X Barsin your chart. Select the # of Bars, selectLine or Mountain display, choose color, andselect AddBollinger Bands: Consist of a middle band X period of SMA, an upper band at Ntimes standard deviation above and a lowerband at N times standard deviation below.Choose your # of Bars (X period, usually20) and choose your # of standard deviations(N, usually 2). Choose your color for themiddle, upper and lower bands.Comparison Chart: Lightspeed’s answer tothe “overlay,” a comparison chart will startat the same point as your price chart andoverlay a symbol, index or future of yourchoice. Just enter the symbol to overlay andchoose your style and color.MACD: Stands for Moving AverageConvergence/ Divergence. MACD willdisplay in its own pane below the chart.Choose the # of Bars and color for the signalline (usually 9), choose the fast and slowEMA bars and color (usually 12 and 26respectively).
RSI: Relative Strength Index will also showup in its own pane below your price chart.Select your EMA smoothing period (usually14) and color and style.Previous Close Line: This is a lineindicating the prior day’s closing price. It isavailable on intraday charts only. Choose acolor.V. Chart Style Part 4: Saving your Chart StyleOnce you have configured your chart with your desired Chart Type, Colors, Display Settingsand Studies you can save it as your own personal Style. Simply name your Style [Layout] andClick Add.Note: If you want to Modify an existing Style, you must retype the name of the style and selectAdd, once you click on an existing style, it will reset it and you will lose all changes.
Some Tips and Tricks for the Lightspeed Charts Individual Charts can be Linked in the same manner as any other windows inLightspeed. You can liink a chart to “Focus,” Unlink it for a stand-alone chart, or Link aChart to a specific Level 2 Window. Creating and deleting Buttons is especially easy by right-clicking on an existing button.Choices for Adding a New Button, Editing or Deleting an existing button will come up inthe right-click menu. By default, users must double-click within the chart window to bring up the cross-hairs.If you would like to change that to single-click, you may do so in the Display subtab. Users can add extra space at the end of their chart (to predict future movement) byincreasing the “Extra Pixels” in the Display subtab. In order to compare a price chart with another symbol, index or futures contract select“Comparison Chart” from the list of Studies in the “Studies” subtab. Lightspeedcurrently provides a comparison chart and an overlay. An "overlay" shows the line of thesecond symbol on top of your chart for best fit, while the comparison chart actually startsat the same point as your price chart, for reference. Users can map the keyboard keys “Chart Button Next” and “Chart Button Previous”from the Non-Trading Function keys on the Keyboard Tab to scroll through their predefined Chart Parameters. Hold down the Alt key to start drawing a Trendline without using the right click menu.It will default to the type of trendline you last drew (Segment, Ray, Line). Hold down CTRL and use your mouse wheel to move the chart along the Y-Axis. HoldDown ALT and use your mouse wheel to adjust the chart by increasing/decreasing the YAxis.Copyright 2001-2017 Lightspeed Financial, LLC. All rights reserved.
TO: LIGHTSPEED TRADING CUSTOMERS/TRADERS FROM: OPERATIONS GROUP SUBJECT: LIGHTSPEED TRADER CHARTS DATE: 8/16/2019 Lightspeed Trader Charts: The Lightspeed Trader Charts are described in depth in this memo. Users will find the charts to be easy to use, completely customizable and more performant.