Transcription
Atmos. Chem. Phys., 20, 12459–12482, 2020https://doi.org/10.5194/acp-20-12459-2020 Author(s) 2020. This work is distributed underthe Creative Commons Attribution 4.0 License.Ice-nucleating particle concentrations of the past: insightsfrom a 600-year-old Greenland ice coreJann Schrod1 , Dominik Kleinhenz1 , Maria Hörhold2 , Tobias Erhardt3 , Sarah Richter1 , Frank Wilhelms2,4 ,Hubertus Fischer3 , Martin Ebert5 , Birthe Twarloh2 , Damiano Della Lunga2 , Camilla M. Jensen3 , Joachim Curtius1 ,and Heinz G. Bingemer11 Institutefor Atmospheric and Environmental Sciences, Goethe University Frankfurt, Frankfurt am Main, GermanyHelmholtz-Zentrum für Polar- und Meeresforschung, Bremerhaven, Germany3 Climate and Environmental Physics, Physics Institute & Oeschger Centre for Climate Change Research,University of Bern, Bern, Switzerland4 GZG, Department of Crystallography, University of Göttingen, Göttingen, Germany5 Institute for Applied Geosciences, Technical University of Darmstadt, Darmstadt, Germany2 Alfred-Wegener-Institutsource: https://doi.org/10.7892/boris.147785 downloaded: 16.7.2022Correspondence: Jann Schrod (schrod@iau.uni-frankfurt.de)Received: 5 June 2020 – Discussion started: 17 June 2020Revised: 9 September 2020 – Accepted: 21 September 2020 – Published: 31 October 2020Abstract. Ice-nucleating particles (INPs) affect the microphysics in cloud and precipitation processes. Hence, theymodulate the radiative properties of clouds. However, atmospheric INP concentrations of the past are basically unknown. Here, we present INP measurements from an ice corein Greenland, which dates back to the year 1370. In total 135samples were analyzed with the FRIDGE droplet freezing assay in the temperature range from 14 to 35 C. The sampling frequency was set to 1 in 10 years from 1370 to 1960.From 1960 to 1990 the frequency was increased to one sample per year. Additionally, a few special events were probed,including volcanic episodes. The typical time coverage of asample was on the order of a few months. Historical atmospheric INP concentrations were estimated with a conversionfactor, which depends on the snow accumulation rate of theice core, particle dry deposition velocity, and wet scavengingratio. Typical atmospheric INP concentrations were on theorder of 0.1 L 1 at 25 C. The INP variability was found tobe about 1–2 orders of magnitude. Yet, the short-term variability from samples over a seasonal cycle was considerablylower. INP concentrations were significantly correlated tosome chemical tracers derived from continuous-flow analysis (CFA) and ion chromatography (IC) over a broad rangeof nucleation temperatures. The highest correlation coefficients were found for the particle concentration (sphericaldiameter dp 1.2 µm). The correlation is higher for a timeperiod of seasonal samples, where INP concentrations follow a clear annual pattern, highlighting the importance of theannual dust input in Greenland from East Asian deserts during spring. Scanning electron microscopy (SEM) analysis ofselected samples found mineral dust to be the dominant particle fraction, verifying their significance as INPs. Overall, theconcentrations compare reasonably well to present-day INPconcentrations, albeit they are on the lower side. However,we found that the INP concentration at medium supercooledtemperatures differed before and after 1960. Average INPconcentrations at 23, 24, 25, 26, and 28 C weresignificantly higher (and more variable) in the modern-dayperiod, which could indicate a potential anthropogenic impact, e.g., from land-use change.1IntroductionIce cores offer an unparalleled opportunity to study atmospheric conditions of the past. The physicochemical state ofthe atmosphere is recorded and preserved for many atmospheric constituents in the form of entrained gas bubblesand aerosol particles. Fittingly, ice core archives have beendubbed a window into the past by scientists and media alike.Over the past decades, many different parameters and proxieshave been measured in ice cores using a diverse set of tech-Published by Copernicus Publications on behalf of the European Geosciences Union.
12460J. Schrod and H. G. Bingemer et al.: Ice-nucleating particles from an ice core in Greenlandniques from a variety of scientific fields. Unfortunately, heterogeneous ice nucleation, which is of primary importance toatmospheric ice formation and therefore very relevant to polar snow accumulation, has not received much attention in icecore sciences. To date, there has been only a single study toanalyze the concentration of ice-nucleating particles (INPs)from ice cores (Hartmann et al., 2019). Yet, this parameter isvitally important from an atmospheric science and climatemodeling perspective, since it strongly influences cloud formation and modulates precipitation processes. Mülmenstädtet al. (2015) confirmed that the majority of global precipitation is produced in clouds involving the ice phase. Moreover,INPs influence the phase of a cloud and in turn interact withradiation processes (Lohmann, 2015).There are a number of open questions regarding the natureof INPs: their geographical and vertical distribution, seasonalvariation, and the types of aerosol particles that contributeto their population even in today’s atmosphere. Hence, it ishardly surprising that very little knowledge exists about thepreindustrial concentrations and sources of INPs. Carslawet al. (2017) reviewed the state of aerosols in the preindustrial atmosphere. However, they did not discuss this specific matter in depth, because “our understanding of globalice-nucleating particles in terms of particular aerosol components is only just emerging” (Carslaw et al., 2017). Theyconclude that a potential change in INP concentrations sincethe preindustrial period remains entirely possible, as are related impacts on cloud formation, precipitation processes,and the radiation budget. Also, knowledge about the preindustrial baseline of cloud-active aerosols is essential for climate modelers, as – together with the scattering and absorption properties of the aerosol – it constrains the baseline uponwhich the current radiative forcing by anthropogenic aerosolsis calculated. In fact, climate models are highly sensitive tothe preindustrial aerosol conditions (Andreae et al., 2005;Carslaw et al., 2013). As a consequence, a lack of knowledgeof the preindustrial aerosol state leads to large uncertaintieswhen radiative forcings are estimated.Many modeling studies exist, which suggest that general aerosol characteristics have changed significantly sincepreindustrial times, such as aerosol composition, numberconcentration, size distribution, and mixing state (e.g., Stieret al., 2006; Tsigaridis et al., 2006; Hamilton et al. , 2014).Evidently, this trend is implied in ice core observational datafor black carbon (McConnell et al., 2007; Kaspari et al.,2011) and various other trace elements and aerosols (Kaspari et al., 2009; Carslaw et al., 2017, and references therein).Yet, the significance of anthropogenic pollution particles toatmospheric ice nucleation is still in question. Recently, Zhaoet al. (2019) investigated the effects of pollution aerosol onthe ice phase in moderate and strong convective systems ina top-down approach using a combination of satellite observations and model simulations. They present evidence that inthe moderate convection case, where heterogeneous ice nucleation is more relevant, the ice particle effective radius isAtmos. Chem. Phys., 20, 12459–12482, 2020increased, indicating that continental pollution aerosol mayin fact contain a considerable fraction of INPs. On the otherhand, further experimental studies suggest that most anthropogenic aerosol particles are typically poor INPs. For example, Chen et al. (2018) found that the heavy air pollutionof Beijing did not affect the INP concentration in this urban setting in the investigated temperature range from 6to 25 C. Overall, there are still few studies available onthe ice nucleation efficiency of anthropogenic aerosol andsome of the presented evidence is conflicting. Although purepollution aerosols are considered rather inactive INPs, thisdoes not per se mean that the INP population as a wholehas not changed at all over the last centuries. On the contrary, it seems rather likely that certain particles with icenucleating potential may in fact be more abundant in today’s atmosphere. Biomass burning aerosol is probably themost uncertain and least likely contributor to anthropogenicINPs. Both the magnitude and sign of a potential anthropogenic change in global fire emissions since the preindustrial period is the subject of active scientific debate (Hamilton et al., 2018, and references therein). Moreover, the literature is still divided about the ice-nucleating capability ofaerosol particles from biomass burning (or soot in general)(Twohy et al., 2010; McCluskey et al., 2014; Umo et al.,2015; Grawe et al., 2016; Levin et al., 2016; Ullrich et al.,2017; Grawe et al., 2018; Kanji et al., 2020). Anthropogenicmetal-enriched particles from industrial processes (e.g., fromcoal combustion, mining, smelting) have been consistentlyfound in the Arctic during Arctic haze events (e.g., Shaw,1995). Such heavy metals appear regularly as a small fraction of ice residuals in field experiments (Ebert et al. , 2011;Eriksen Hammer et al. , 2018). The most likely candidate forINPs, however, may actually be soil or desert dust particlesfrom areas that may have been subject to land-use changeand desertification since the preindustrial times. The IPCCSpecial Report Climate Change and Land (IPCC, 2019) estimates that 12 %–14 % of today’s global ice-free land surface are croplands. Intensive and extensive pasture land aswell as savannahs and shrublands used for livestock farming make up another 30 %–47 %. Due to the expansion ofthese agricultural areas as well as the practices themselves,the erosion of these agricultural soils is increasing. In fact,it is estimated that soil erosion is currently between 10 and100 times higher (depending on tillage) than the natural soilformation rate (IPCC, 2019). Eroded soil particles may enter the atmosphere and potentially affect microphysical cloudformation processes. Indeed, soil dust, in part derived fromagricultural areas/practices, has been proven to be an activeINP in many studies (Conen et al., 2011; Tobo et al., 2014;O’Sullivan et al., 2015; Hill et al., 2016; Steinke et al., 2016).Furthermore, the range and intensity of desertification, whichis defined as the land degradation of arid, semiarid and drysub-humid areas (i.e., drylands), have increased in the pastseveral decades (Shukla et al., 2019). According to the IPCCSpecial Report, drylands currently cover about 46 % of thehttps://doi.org/10.5194/acp-20-12459-2020
J. Schrod and H. G. Bingemer et al.: Ice-nucleating particles from an ice core in Greenlandglobal land area, of which approximately 9 % were identified as hotspots of desertification. Especially during droughtssuch areas are susceptible to higher dust storm activity, whichmay introduce more mineral dust to the atmosphere. For example, Ganor et al. (2010) found the number of events thattransport African dust over the eastern Mediterranean to increase significantly over the years 1958–2006. ConcerningGreenland, isotopic studies showed that the main sourcesof mineral dust aerosol in both glacial times and during theHolocene are natural Chinese desert areas, and in particularthe Taklamakan Desert (Svensson et al., 2000; Bory et al.,2003); however a recent increase in mineral dust concentration from these areas due to anthropogenic impacts is notdocumented. Mineral dust from China, and the TaklamakanDesert in particular, has been characterized in several laboratory ice nucleation studies (Field et al., 2006; Niemand et al.,2012; Boose et al., 2016; Ullrich et al., 2017; Paramonovet al., 2018), which revealed a relatively high ice active sitedensity in the temperature range below 25 C, comparableto other natural deserts such as the Sahara (e.g., Niemandet al., 2012; Boose et al., 2016).Hartmann et al. (2019) were the first to estimate theconcentration of INPs from two Arctic ice cores fromLomonosovfonna, Svalbard (78.82 N, 17.43 E), and Summit, Greenland (72.58 N, 37.64 W), using the droplet freezing devices Leipzig Ice Nucleation Array (LINA, 90 1 µL)and Ice Nucleation Droplet Array (INDA, 96 50 µL). Theyanalyzed 69 samples in total (42 from Svalbard and 27from Greenland). Svalbard samples were subdivided intomultiyear samples (six samples in 2–6-year resolution) andsub-year samples (36 samples with a resolution of somemonths), which covered the same time periods as the multiyear samples. The investigated time periods were approximately 1480, 1720, 1780, 1800, and 1950. Greenland samples covered the time from 1735 to 1989 with a resolution ofabout 2–5 years per sample. Cumulative INP data are presented mainly at temperatures of 10, 15, and 20 C.Hartmann et al. (2019) observed no long-term trend in theINP concentration. Furthermore, they found the “short-term”variability of INP concentrations from adjacent sub-yearsamples to be as large as or even larger than the total variability of the complete data set. In their closing remarks, theyrecommend that future studies focus on creating a continuousrecord of ice core INP concentrations for the last few centuries. Further, they suggest including a simultaneous analysis of INP-related chemical and biological substances and analyzing ice cores from other Arctic locations to gain knowledge about the spatial distribution of INP concentrations overtime.Here, we present INP data from an ice core from northeastern central Greenland (B17, 72.25 N, 37.62 W) that datesback to about 1370 (Weißbach et al., 2016). The ice corewas drilled in the framework of the North Greenland Traverse (NGT, 1993–1995) and reaches a depth of about 100 m.In total 135 samples were measured with the FRIDGE rument (FRankfurt Ice Nuclei Deposition FreezinG Experiment; Klein et al., 2010; Schrod et al., 2016) in its dropletfreezing mode (Hiranuma et al., 2015; DeMott et al., 2018;Hiranuma et al., 2019). Samples were selected in regular intervals of 10 years to cover the whole period of the ice core.Most of these discrete samples typically integrate over a timeperiod of half a year. Furthermore, sampling frequency wasincreased to one sample per year between 1960 and 1990to establish a statistically sound “modern-day” reference period. Moreover, certain samples were selected based on extraordinarily high concentrations in their “dust” concentration and/or peaks in the electrolytic conductivity, where thesepeaks are most often caused by H2 SO4 (from volcanic eruptions). Prior to our ice nucleation measurements, the icecore was analyzed for dust, conductivity, and soluble par ticle concentrations of Ca2 , Na , NH 4 , and NO3 usingcontinuous-flow analysis (CFA) (Kaufmann et al., 2008) at the University of Bern and for Ca2 , Na , NH 4 , NO3 , K ,2 2 Mg , F , MSA , Cl , Br , and SO4 using ion chromatography (IC) at the Alfred Wegener Institute for Polarand Marine Research (AWI), Bremerhaven. Finally, we analyzed a high-resolution period with almost monthly resolution (1463–1464, N 12) to investigate a potential seasonalvariation in the INP concentrations.22.1MethodsIce core NGT B17The ice core B17 was drilled during the NGT in 1993–1995by the Alfred Wegener Institute as one of 13 ice cores alongthe traverse. The drill site is located east of the main ice divide in central Greenland (72.25 N, 37.62 W, 2820 m a.s.l.).The ice core has a total depth of 100.8 m, a depth whichcorresponds to the year 1363 CE. More information aboutthe characteristics of B17 and the other NGT ice cores canbe found in Weißbach et al. (2016). Weißbach et al. (2016)present and discuss the density profile, the water accumulation rate, and the ratio of stable water isotopes (δ 18 O) of theice cores B16–B23 and B26–B30. Complementary chemical profiles of selected NGT ice cores are presented in Fischer et al. (1998) and Bigler et al. (2002). Recently, Burgay et al. (2019) introduced Fe2 as a potential new proxyto identify volcanic events by presenting B17 measurementsusing a chemiluminescence method. The ice core was datedon the basis of identified volcanic layers (Weißbach et al.,2016), interpolating between these tie points, supported bymeasurements of stable water isotopes.2.2Sample preparations and overview ofmeasurementsAfter the B17 core was drilled in the early 1990s, it wascut into pieces of 1 m each and stored at 25 C in coldAtmos. Chem. Phys., 20, 12459–12482, 2020
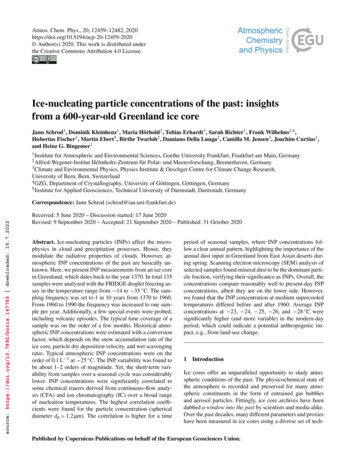
12462J. Schrod and H. G. Bingemer et al.: Ice-nucleating particles from an ice core in Greenlandstorage at AWI. In 2018, a longitudinal subsection of theice core with a cross section of 35 mm 35 mm was cutfrom the whole length of the core. The pieces of the icecore were transported in a frozen state to the University ofBern, where they were continuously melted using a wellestablished decontamination technique, which is the first stepin the continuous-flow analysis (CFA) (Kaufmann et al.,2008) (Sect. 2.3). The decontaminated meltwater flow wasthen split between the online chemical analysis and a fraction, which was sampled directly into numbered clean vialsof discrete aliquots for offline ion chromatography (IC) measurements (Sect. 2.4). Each vial was filled with approximately 1.5–8 mL of sample water, translating to 4–20 cm ofcore depth. Further, depending on the exact sampling resolution this corresponds to a time resolution of about 1–10 datapoints per year. Subsequently, the vials were refrozen andshipped to AWI to measure the concentration of major ionsin order to complement the CFA measurements. As the ICanalysis required a few microliters only, the vials still contained most of the sample water after the measurements. Apart of these samples were later selected for the ice nucleation analysis in this study (Sect. 2.5). These samples weretransported from Bremerhaven to Frankfurt in a small insulated PP-foam cooling box with additional cold packs. Then,samples were stored inside a freezer (Waeco Coolmatic CF40) at about 17 C. Hence, it was ensured that samples remained frozen at all times in our laboratory. However, sample vials may have been subject to temperatures between 0 Cand room temperature for up to some tens of hours in total(during repeated cycles of melting, storage, and refreezing;non-INP measurements; and transport, etc.). Prior to the icenucleation measurement (Sect. 2.6), each sample was slowlymelted over night in a refrigerator at about 6 C. After theice nucleation analysis the samples were refrozen. Selectedsamples that were previously analyzed for their INP activity, were transported to TU Darmstadt for chemical and morphological single-particle analysis using a scanning electronmicroscope (SEM) (Sect. 2.7).2.3Online chemical analysisFor the CFA analysis the subsections of the ice core weremelted continuously in a way that separated meltwater fromthe potentially contaminated outside of the ice from theclean meltwater from the inside. This decontamination technique is effective and even gastight for solid ice (density 0.82 kg L 1 ). However, we cannot completely excludesome minor contamination for the relatively porous firn,which is found at the top of the ice core, as it is possiblethat meltwater is drawn upwards by capillary forces and thatsurface contaminants may be mixed in here.A fraction of the clean meltwater stream was used to feeda range of detectors to determine the concentrations of ionsin the water using purpose-built spectrophotometric meth ods (Ca2 , Na , NH 4 , and NO3 ), electrolytic conductivAtmos. Chem. Phys., 20, 12459–12482, 2020ity, and the concentration of insoluble particles ( 1.2 µm)as detailed in Kaufmann et al. (2008) and references therein.All of these measurements were performed continuously during the melting of the ice core section to produce a continuous high-resolution record. Typical analytically limitedresolutions were in the range of 0.5–1.0 cm governed by thesmoothing of the individual detection methods.2.4Ion chromatographyThe vials containing the discrete decontaminated aliquotsof the ice core were melted at room temperature prior tothe IC analysis. The vials were then placed into an autosampler to be measured. Simultaneous analysis of anionsand cations was performed using a two-channel Dionex ICS5000 reagent-free HPIC system (Thermo Fisher). For theanion (cation) determination the Dionex IonPac AG18-Fast4µm guard column (IonPac CG12A-5µm column) and theDionex IonPac AS18-Fast-4µm analytical column (IonPacCS12A-5µm column) were used. The measurements werecalibrated with seven internal standards, prepared from available anion and cation standards. Premixed external standardswere used for quality control. In this study, the IC provideda quantitative analysis of the concentration of Ca2 , Na , 2 2 NH 4 , NO3 , K , Mg , F , MSA , C1 , Br , and SO4 .2.5Sample selectionFigure 1a shows the temporal distribution of the selectedsamples for the ice nucleation experiment (total N 135,7 % of all samples) throughout the ice core (the completelist of samples is presented in Table S1). We placed a strongemphasis on having a data set with quasi-consistent time intervals for our samples (approximately decadal interval). Weconsidered these time intervals to be both meaningful andfeasible. Furthermore, our sample selection strategy was intended to consider the preindustrial INP concentration vs. theINP concentration of the recent past (1960–1990). Therefore,the sample frequency was increased to about one sample peryear in the latter time period to potentially enhance the statistical significance. Whenever possible, we selected samplesthat theoretically represented the same season(s). However,due to the uncertainty in the ice core dating, some of the variability in the INP concentration may be attributed to seasonaldifferences.Moreover, we selected some samples according to peakvalues in the high-resolution CFA measurements. Sampleslabeled “dust event” include a respective sample that featured a peak in the high-resolution signal of particles withspherical diameters larger than 1.2 µm, as well as a couplesamples collected before and after it. Due to the episodic nature of such an event and the fact that the INP samples wereautomatically collected as multi-month means, the samplecontaining the high-resolution peak signal does not necessarily need to have an extraordinarily high average value ithttps://doi.org/10.5194/acp-20-12459-2020
J. Schrod and H. G. Bingemer et al.: Ice-nucleating particles from an ice core in Greenland12463Figure 1. (a) Temporal distribution and number of ice nucleation samples for different groups (colors). (b) Time coverage of the samplesselected for assessing IN properties. The different colors represent a broad grouping into samples averaging over short, medium, and longtime periods.self. Similarly, peak samples in the high-resolution signal ofconductivity were selected. Large peaks in the electrolyticconductivity record are most often derived from high sulfuric acid deposition in the ice after volcanic eruptions. For example, one group of these “volcanic event” samples can beunequivocally ascribed to the Laki eruption in 1783/84. Theeruption of Grímsvötn (Laki) is the best-characterized historical large volume basaltic fissure eruption in Iceland. The8-month-lasting Laki eruption occurred from a 27 km longvolcanic fissure in the Grímsvötn volcanic system. It emitted 15 of lava, 0.4 km3 of tephra, an estimated 122 Tg of SO2 ,and other gases and trace metals (Thordarson and Self, 1993,2003; Sigl et al., 2018). Lastly, 12 adjacent samples with anear-monthly resolution were measured in order to estimatethe “short-term” variability of the data set and to check for apossible seasonal variation in the INPs (1463–1464).Figure 1b gives the temporal coverage of each individualanalyzed sample. The representative time of a certain sampleis given by its lengths, which is estimated by calculating theaverage time difference between the sample before and after it. The majority (63 %) of the analyzed samples averagedover a time period of 6 2 months. About a quarter of s (26 %) averaged over a shorter time and 11 % over alonger time.2.6Ice nucleation analysisThe ice nucleation measurements were performed with theFRIDGE instrument (Klein et al., 2010; Schrod et al., 2016).FRIDGE has two operational modes. In its “standard mode”aerosol particles are activated to ice crystals by diffusion ofwater vapor at supercooled temperatures and near-vacuumconditions (Schrod et al., 2017; DeMott et al., 2018; Thomson et al., 2018; Marinou et al., 2019). In this paper however, we solely used FRIDGE in the droplet freezing mode(Hiranuma et al., 2015; Boose et al., 2016; DeMott et al.,2018; Hiranuma et al., 2019). We focused on the dropletfreezing assay (DFA), because (1) immersion freezing is considered to be the most atmospherically relevant process inheterogeneous ice nucleation for mixed-phase clouds (e.g.,Murray et al., 2012), (2) the use of a DFA seems to be thenatural choice considering that the aerosol particles are already immersed within the ice core meltwater, (3) the technique requires only a few milliliters of sample water, and (4)Atmos. Chem. Phys., 20, 12459–12482, 2020
12464J. Schrod and H. G. Bingemer et al.: Ice-nucleating particles from an ice core in Greenlandother methods would likely introduce further contaminationsources through the particle generation setup (e.g., atomizer).The performance of the FRIDGE instrument was testedduring the Fifth International Workshop on Ice Nucleation– part 2 (FIN-02, DeMott et al., 2018). In this large-scalelaboratory campaign 21 different INP counters were intercompared at the Aerosol Interaction and Dynamics in theAtmosphere (AIDA) facility of the Karlsruhe Institute forTechnology (KIT). FRIDGE agreed generally very well withthe other instruments (especially for the immersion freezingmethod) for the various investigated aerosol types (including natural mineral dusts, dust components, and a biologicalmaterial).During a measurement of an ice core sample 65 dropletsof 2.5 µL 5 % each were placed homogeneously at randomonto a clean silanized Si substrate of 47 mm diameter on thecold table in the FRIDGE chamber. The droplets were pipetted directly from the sample vial and were semiautomaticallydispensed using an Eppendorf Multipette E3 with fresh Eppendorf tips of the highest level of purity (Combotips advanced, Biopur grade, 0.1 mL). Temperature was quickly decreased at first in the range from 14 to 0 C and then slowlylowered at a constant cooling rate of 1 C per minute until all droplets were frozen. The temperature ramp was implemented by a PID-controlled Peltier element. A cryostat(Lauda, Ecoline Staredition RE110; ethanol coolant) wasused to dissipate the heat from the Peltier element. Temperature was measured by a PT-100 sensor (precision 0.2 C),which was attached to the surface of the wafer. The measurement cell was continuously flushed with synthetic airat a flow of 1 L min 1 to prevent condensation and rimingand to minimize contamination from the laboratory environment during the measurement. The freezing of dropletswas observed by a charge-coupled device (CCD) camera(AVT Oscar F-510C 2/300 ). A droplet changes its brightnesssignificantly during the freezing event: droplets are nearlytranslucent when liquid but are opaque when frozen. LabView software automatically detected the moment of freezing, recorded the corresponding temperature, and saved theimages every 10 s. The final results were always doublechecked by the operator. After all droplets were frozen, thesubstrate was heated up and cleaned and the process was repeated twice with new droplets. In total, the freezing temperatures of 195 individual droplets were determined for eachice core sample (three runs with 65 droplets). The cumulativeINP concentration per milliliter of ice as a function of temperature (NINPice (T )) was calculated by the well-establishedVali (1971) equation:NINPice (T ) 1· [ln (ntotal ) ln (ntotal nfrozen )] .Vd(1)we are typically able to resolve INP concentrations between2 and 2000 mL 1ice .Due to the nature of the experiment, droplets freeze in adifferent temperature range, leading to a slightly inconsistent data set. This means that while some samples have measurement data at a warm temperature, others will not. Whenwe calculate average concentrations, for example, we set theconcentration of those non-active samples to zero, knowingthat the actual concentration is somewhere between zero andthe lowest resolvable concentration (2 per milliliter of ice).The same issue arises at lower temperatures. For some samples all droplets are frozen before reaching a certain temperature. In those cases the concentration was set to the highestresolvable concentration (2000 per milliliter of ice). It shouldbe noted that for some cases the real INP concentration mightactually be substantially higher due to the exponential behavior in ice nucleation. The presented average concentrations(Sect. 3) should therefore be considered a lower estimate.2.7Scanning electron microscopyWe selected three individual samples (years: 1977, 1680,and 1630) to be analyzed with scanning electron microscopy(SEM) to gain information about the chemical signature ofdeposited aerosol particles. The 1977 sample was selectedexemplarily as an active modern-era sample. The 1680 sample was chosen for its average INP concentration at 25 C,as well as being in the middle of the time series. The 1630sample was analyzed with SEM,
Received: 5 June 2020 - Discussion started: 17 June 2020 Revised: 9 September 2020 - Accepted: 21 September 2020 - Published: 31 October 2020 Abstract. Ice-nucleating particles (INPs) affect the micro- . (CFA) and ion chromatography (IC) over a broad range of nucleation temperatures. The highest correlation coeffi-