Transcription
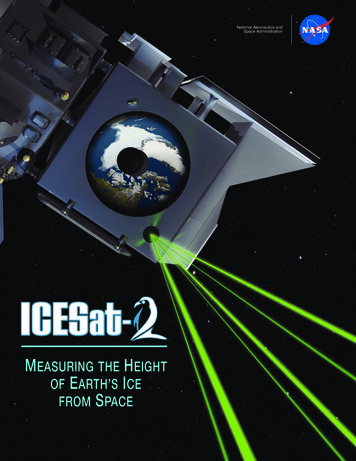
National Aeronautics andSpace AdministrationMEASURING THE HEIGHTOF E ARTH’S I CEFROM S PACE
Ice, Cloud, and land Elevation Satellite-2 mission: icesat-2.gsfc.nasa.govICESat-2 Science ObjectivesThe ICESat-2 mission is designed to accomplish fourscience objectives:1. Quantify how much melting ice sheets in Greenlandand Antarctica contribute to sea level changes.2. Quantify how ice sheets and glaciers are gainingor losing mass at a regional level, to help researchersunderstand the mechanisms behind those changes.3. Estimate the thickness of sea ice and monitor anychanges.4. Measure the height of vegetation in forests andother ecosystems worldwide.
Table of ContentsICESat-2 at a Glance.4ICESat-2: Measuring the Height of Ice from Space 6NASA’s View of Our Frozen Earth 10Instrument Overview: The Advanced Topographic Laser Altimeter System. 1418Spacecraft Design and Launch 20Ground System and Data Products 22Photo credit: Eric Rignot/NASAAlgorithm and Data Product Development
NASA’s new Earth-observing satellite will measure theheight of our planet’s ice in unprecedented detail.LaserTelescopeThe ATLAS receiver telescopecollects the handful of photonsfrom each laser pulse thatreturn to the satellite. Everysecond, the instrument recordsdata from 60,000 returningphotons. Each photon’s flighttime is measured with a precision of 800 picoseconds.ICESat-2’s ATLAS laser instrumentpulses 10,000 times a second,each pulse sending 300 trillionbright green laser photons to theground. Scientists calculate heightby using the time it takes individual photons sent from the laser tobounce off Earth’s surface and return to the satellite.
National Aeronautics andSpace AdministrationSpacecraftThe ICESat-2 spacecraft orbits Earth at 15,660 mph atan altitude of 310 miles. Every 91 days, it completes1,387 unique orbits. The mission collects a terabyte ofdata daily.Land IceSea IceSea ice forms when ocean water freezes,and in the Arctic Ocean forms a brightlyreflective cap that helps regulate Earth’stemperature. The ICESat-2 mission willcalculate the thickness of sea ice bymeasuring the freeboard—the differencebetween the top of sea ice and theocean surface.Credit: Jeremy Harbeck/Operation Icebridge/NASACredit: Nathan Kurtz/Operation Icebridge/NASAGlaciers and ice sheets form assnowfall accumulates over centuriesand millennia. As more land ice meltsinto the ocean, global sea level rises.ICESat-2 will measure the annual riseor fall of ice sheets to within a fractionof an inch.
ICESat-2Measuring the Height of Ice from SpaceEarth’s ice is shrinking.Ice is being lost across the globe, especially in the polar regions. Thecontinental ice sheets of Greenland and Antarctica are shedding ice tothe oceans and raising sea level. Arctic sea ice is less than half its 1980svolume. Fundamentally changing the Arctic, this ice loss may also beaffecting North American and global weather.NASA is launching the Ice, Cloud and land Elevation Satellite-2(ICESat-2) to measure changes in Earth’s ice and improve forecasts ofthe global impacts. With its fast-firing laser, the satellite will collectinformation enabling scientists to calculate—to within fractions of aninch—how much the vast ice sheets of Antarctica and Greenland riseor fall each year.Credit: NASAICESat-2 will take measurements across the globe and provide anincredibly precise height map of our planet in unprecedented detail.Its focus will be on Earth’s poles, including the Arctic region wheretemperatures are rising faster than at other latitudes.[Above] This image was created using data from theoriginal ICESat mission. Blue denotes decreases in iceheight per year from 2003-2009 (when ICESat was inoperation), while red denotes increases in ice heightper year. More recently, between 2002 and 2016,about 280 gigatons of ice melted from Greenlandeach year, causing annual global sea level rise of 0.03inches (0.8 millimeters). Scientists are using heightchanges to calculate the mass loss of ice.Global land-ocean temperature index for2017 relative to the 1951-1980 average: 0.9 C6Photo credit: NASA/Operation IceBridgeGreenlandIce Height Change (m/yr)GulfofMexico[Above] The calving front of the Kangerlussuaq Glacier, on Greenland’s east coast. Whenglacier ice calves and melts into the ocean, it contributes to sea level rise. Scientistsestimate global sea level could rise between 0.66 to 6.6 feet (0.2 to 2.0 meters) higherby 2100, compared to the first decade of this century.Greenland ice mass change since 2002:-286 gigatons/yearGreenland ice loss 2002-2018:4,576 gigatonsAntarctic ice mass change since 2002:-127 gigatons/year
ICESat-2 is poised to capture changes inthe planet’s ice in unprecedented detail,shedding light on rising sea levels andCredit: NASAshifting ocean currents.Hundreds of billions of tons of landice melt into the oceans annually,raising sea levels worldwide. In recentyears, meltwater from the ice sheets onGreenland and Antarctica alone has raisedglobal sea level by more than a millimetera year, and the rate is increasing. Basedon computer simulations and satellitedata, global sea level could be anywherefrom 0.66 to 6.6 feet (0.2 to 2.0meters) higher by 2100 than in the firstdecade of this century. ICESat-2 datadocumenting the ongoing height changeof ice sheets will help researchers narrowthat range of possibilities to forecast sealevel rise with greater certainty, allowingcommunities to be better prepared.Floating sea ice doesn’t change sea levelwhen it melts, just like melting ice cubesdon’t overflow a glass of water. But seaice loss has a different suite of globalconsequences. The bright Arctic ice capreflects the Sun’s heat back into space.When white ice melts away, leaving darkwaters, the ocean soaks up that heat.This alters wind and ocean circulationpatterns that span the globe, affectingEarth’s weather and climate.Shrinking sea ice cover also disruptstraditional ways of life for native ArcticAntarcticaIce Height Change (m/yr)Antarctic ice loss 2002-2018:2,032 gigatonsArctic sea ice loss since 1980: 40%Arctic sea ice minimumrelative to the 1981-2010 average:-13.2 %/decadeCredit: NASA[Right] In this image, created using data from theoriginal ICESat mission, blue denotes decreasesin ice height per year from 2003-2009 (whenICESat was in operation), while red denotesincreases in ice height per year. While some areasgained ice from 2003-2009, data from 2002 to2016 show that overall the ice from the continentis melting, sending approximately 125 gigatons ofice into the ocean and raising sea level about 0.01inches (0.35 mm) per year.Sea level rate of change 1993-2018:3.2 millimeters/year7
Credit: NASA[Left] Earth’s 2017 surfacetemperatures were the secondwarmest since modern measurements began in 1880, with2016 taking the record. Thismap shows global temperature anomalies averaged from2013 through 2017 in degreesFahrenheit. Red shades showhow much warmer a given areawas compared to an averagedbase period from 1951 to1980. Warming is concentratedover the Arctic and some landareas (darkest shades of red).Generally, warming is greaterover land than over the oceanbecause water is slower to absorb and release heat.communities, and changes habitats forwildlife such as polar bears and whales.While scientists routinely measure seaice coverage from satellite images,they lack region-wide sea ice heightmeasurements that would allow themto derive thickness and volume—heightmeasurements that ICESat-2 will provide.In the blink of an eye—half a second—ICESat-2’s laser altimeter will fire 5,000times, sending trillions of photons tothe ground in six beams of green light.The instrument, called the AdvancedTopographic Laser Altimeter System(ATLAS), measures height by timinghow long it takes individual photonsto travel from the spacecraft to Earthand back—and does so with a precisionbetter than a billionth of a second. Inthe course of three months, ATLAS willcover the globe with 1,387 individualorbits, collecting billions of measurementsto create a three-dimensional portrait ofour planet.Credit: NASA[Right] In 2017, Arctic sea icereached its lowest extent for thatyear on September 13, accordingto NASA and the National Snowand Ice Data Center (NSIDC).Since satellites began continuallymonitoring sea ice in 1978,researchers have observed asteep decline in the averageextent of Arctic sea ice for everymonth of the year. With ICESat-2data, scientists will be able totrack the thickness of the sea icein addition to the extent.Arctic sea ice extent has consistently shrunk belowthe 1980–2010 average since 2011.8Between 2003 and 2009, Arctic sea ice declined in thickness by more than23.6 inches (60 centimeters).
Beyond the poles, ICESat-2 willmeasure the heights of the world’sforests. ATLAS is designed to measureboth the tops of trees and the forestfloor below, which—combined withexisting datasets on forest extent—willhelp researchers estimate the amount ofglobal vegetation.Even prior to launch, potential data-usershave been working with ICESat-2 toconnect the mission science to societalneeds. ICESat-2 measurements of reservoir heights could help local governments plan for flooding or drought, forexample. Forest height maps, showingtree density and structure, could improvecomputer models that firefighters use toforecast wildfire behavior. Sea ice measurements could be integrated into forecasts the U.S. Navy issues for navigationand sea ice conditions.Photo credit: Jeremy Harbec/NASAAs the satellite orbits, it will alsomeasure the height of the ocean andland. Researchers investigating vegetation,clouds, and more will be able to use thesatellite’s terabytes of data to study theplanet’s temperate and tropical latitudes.The full potential of ICESat-2’s data isunknown; the mission’s profile of Earthwill open the door for discoveries not yetimagined.[Above] Changes in ice cover directly impactthe lives of people who live north of theArctic Circle in Greenland and Canada.Sea Ice Versus Land IceEarth’s frozen poles are dominated by different forms of ice. The North Pole lies in the Arctic Ocean, whichis mostly covered by sea ice, while the South Pole is on the Antarctic continent, covered by land ice.Sea ice forms when salty ocean water freezes.Some sea ice lasts for decades and can grow to15 feet (4.5 meters) thick. Some sea ice formsand melts yearly. Just as melting ice cubes donot cause a full glass of water to overflow, meltingsea ice does not change sea level. However,melting sea ice can change ocean circulationpatterns and influence the global climate.AntarcticCredit: NASAArcticCredit: NASALand ice, such as the ice sheets in Greenlandand Antarctica or glaciers in the Himalaya, buildsup from centuries’ worth of snowfall. It can bemiles thick. The Antarctic ice sheet has a meanthickness of 1.6 miles (2.2 km), for example, andreaches a maximum of almost 3 miles (4.8 km)thick. When ice on land melts, it can flow into theocean and raise sea level.Since 1870, sea level has risen about8 inches (20 centimeters).ICESat-2 will collect data within a swath width of 56 feet (17 meters).9
NASA’s View of Our Frozen EarthFrom space, satellite observationsCredit: NASAof ice show rapid change.[Above] The Nimbus-7 spacecraft (1978-1994) began a continuous satellite record of sea ice measurements that now covers 40years and has revealed dramatic changes to the Arctic climate.NASA’s ICESat-2 mission will extend acontinuous data record on the height ofEarth’s ice. This record started in 2003 withthe original ICESat mission and continuedin 2009 with NASA’s Operation IceBridge.IceBridge fills the data gap between ICESatand ICESat-2, with airplanes flying a suiteof scientific instruments over the Arcticand Antarctic. The airborne campaign hasprovided essential information to improvesea ice forecasts and has charted the declineof several Antarctic glaciers and ice shelves,among many other accomplishments.A C-130 Herculesflown by Operation IceBridge10NASA’sIce-MeasuringLidarsWith ICESat-2’s advanced laser technology,NASA will provide even more detailed,more precise and more dense datasets onland and sea ice.The Frozen OceanSea IceArctic sea ice fluctuates with the seasons, buton average covers an area the size of the UnitedStates. This ice cap acts as a cooling system forthe rest of the globe.1993: NASA’s Airborne TopographicMapper begins surveysof Greelnand’s ice2003: The original ICESat launches;ends mission in 2010
In 2009, NASA began acampaign calledOperation IceBridgeWhen heat from the Sun hits the ArcticOcean, ice cover makes a difference.Solar energy that hits bright, white seaice is reflected back into space, whilesolar energy that hits the dark oceanis absorbed, warming the water andkeeping the heat on Earth.Sea ice also acts as insulation for the ocean.The Arctic air is often far colder than theArctic Ocean, and open water easily losesheat into the atmosphere.Photo credit: Chris Larsen/UAFthe world’s largest airbornesurvey of polar ice tocontinue the data recordstarted by ICESat.infrared instruments like the ModerateResolution Imaging Spectroradiometer(MODIS) and NOAA’s AdvancedVery High Resolution Radiometer(AVHRR), researchers can measure thesurface temperature. The Landsat seriesof satellites has collected images of thepolar ice for decades as well. Scientistshave charted the annual variations in sea[Above] This DHC-3 Otter is flown in NASA’sOperation IceBridge-Alaska surveys of mountainglaciers in Alaska. Over the past few decades,Alaskan glaciers have lost about 75 billiontons of ice per year.[Below] Young sea ice in the ChukchiSea, north of the Bering Sea, as seenby Operation IceBridge in March2017. IceBridge measures ice thickness along its flight lines. ICESat-2will provide the most comprehensivemeasurements yet of sea ice thickness and how it is changing.Changes in sea ice extent can thereforehave a significant effect on the temperatures of the ocean and atmosphere. This, inturn, can lead to alteration of global oceanand atmospheric circulation patterns—patterns that determine the climate inmore temperate parts of the world.2007: NASA’s Land, Vegetation, andIce Sensor begins airborne Greenlandsurveys2007: The National ResearchCouncil’s Decadal Survey recommendsa second ICESat missionPhoto credit: Operation IceBridge/NASANASA and other organizations havebeen monitoring sea ice extent frompolar-orbiting satellites for more thanfour decades, beginning operationallywith the Nimbus-7 satellite in the late1970s. Some satellites carry passivemicrowave instruments that allowscientists to monitor the daily reach ofthe sea ice, even through clouds. With2009: NASA’s Operation IceBridge begins annual airborne campaignover the Arctic and Antarctic with the Airborne Topographic Mapper andthe Land, Vegetation, and Ice Sensorcont’dp. 1211
ice and documented the decline in the ice’s extent in recent years. Since 2011, Arcticsea ice extent has consistently shrunk below the 1980–2010 average.Sea ice that has built up over years can be 5 meters (15 feet) thick and is tougher tomelt than the relatively thin ice that forms annually. The first ICESat mission, inoperation from 2003 to 2010, demonstrated that between those years Arctic sea icethickness declined overall by more than 60 centimeters (2 feet).ICESat-2 will measurethe distance betweenICESat-2 will provide a wealth of detailed sea ice thickness data. The satellite’sinstrument will measure freeboard—the distance between the top of the ice and thethe top of sea iceand the oceansurface to provideunprecedented seaPhoto credit: Andy Mahoney/NSIDCice thickness data.[Above] Sea ice is changing in different ways in the Arctic and Antarctic, and ICESat-2 will help scientistsinvestigate this variation.ocean surface. From that, computer programs can use the ratio of ice above water toice below water to calculate the thickness of the floating ice.Massive Stores of IceCredit: NASAIce Sheets[Above] The first ICESat spacecraft (2003-2010)2012: The Multiple Altimeter BeamExperimental Lidar (MABEL) beginsflights for ICESat-2 algorithm development.12cont’d fromp. 11The ice that covers Greenland and Antarctica may seem as stationary as cement.But it is in flux. New ice forms as snow falls on top of the ice sheet over decades,compacted into layers of ice over thousands of years. Along the Greenland andAntarctic coasts, glaciers calve icebergs, which eventually melt into the ocean andcontribute to sea level changes. Some ice, especially in Greenland, melts directlyfrom the ice sheet into the ocean.2014: Engineers begin integrating andtesting the ATLAS laser altimeter atNASA Goddard.2016: ATLAS instrument assemblycompleted, instrument undergoesenvironmental testing.2017: Engineers installATLAS flight lasers.
Credit: NASAThe GRACE mission allowedscientists to detect a significant trendof ice loss in Greenland and WestAntarctica over 15 years.[Above] The twin GRACE spacecraft(2002-2017)If the ice sheets are in balance, the amountof snowfall and the amounts of ice lostthrough calving and melt are equal. Butsatellite data show that has not been thecase in this century. ICESat demonstratedthat the margins of ice sheets weredropping in height, in some places by 3.3feet (1 meter) or more a year.From satellites such as GRACE,the Gravity Recovery and ClimateExperiment, scientists have found thatGreenland is losing more than 250gigatons of ice each year. Antarctica islosing more than 125 gigatons of iceeach year. To put this into perspective,one gigaton of water is enough tofill 400,000 Olympic-sized swimmingpools, and it would take more than foursummer days for one gigaton of waterto flow over Niagara Falls.Those 375 gigatons of melt from icesheets make up roughly a third of thecurrent observed sea level rise. Globally,sea level has risen about 8 inches (20centimeters) since the beginning ofthe twentieth century and more than2 inches (5 centimeters) in the last 20years alone. A 2017 study suggested thatsea level rise is accelerating and projectedthat by 2100 sea level will rise 26 inches(65 centimeters).ice sheets, which will give researchersmore data on the precise location, andamount, of ice loss. The sheer numberof data points ICESat-2 will collect,together with the laser’s small footprintsize of about 56 feet (17 meters), meansthat researchers will have informationon the changes in ice height on the scaleof individual glaciers—in Greenlandand Antarctica, as well as other partsof the globe. This, in turn, will allowscientists to better understand thecurrent situation and better predict howmuch sea level will rise and the impactsto coastal communities globally.ICESat-2 will be able to detect centimeterlevel rises or falls in the height of the2017/18: ICESat-2 scientists collectAntarctic elevation measurementsto assess future satellite data.Photo credit: NASA[Right] This view from a NOAAP-3 Orion aircraft shows thecalving front of Sermeq Kujatdleqglacier, located on the westcoast of Greenland. ICESat-2’smeasurements will allow scientists to calculate the elevationof glaciers such as this in unprecedented detail and to trackchanges over time. Glacial icemelt is a major contributor toglobal sea level rise.Early 2018: ATLAS ships to NorthropGrumman facility in Gilbert, Arizona,for spacecraft integration and testing.June 2018: Integrated ICESat-2satellite ships to VandenbergAir Force Base.Fall 2018: ICESat-2launch scheduled.13
Instrument OverviewPhoto credit: NASAThe Advanced Topographic Laser Altimeter System[Above and Right] These photos show the ATLAS instrumentinside a cleanroom at NASA’s Goddard Space Flight Centerwhere the instrument was assembled. The instrument will carry abackup laser in case the primary laser fails.TelescopeTo precisely time how long it takes a pulse of laser light to travelfrom space to Earth and back, you need a really good stopwatch— one that can measure within a fraction of a billionth of asecond. Nothing available met ICESat-2’s exacting requirements,so the team behind the satellite’s Advanced Topographic LaserAltimeter System (ATLAS), built one themselves. It, and otherATLAS components make it one of the most advanced spacelasers ever flown.ATLAS has three major tasks: send pulses of laser light tothe ground (while precisely determining where the laser ispointing), collect the returning photons in a telescope, andrecord the photon travel time. To do this, ATLAS will release10,000 laser pulses a second. The light from the lasers, built byLaser 1Laser 2Fibertek, is at 532 nanometers—a bright green on the visiblespectrum. As a pulse is fired, ATLAS splits the single laser beaminto six. The multiple beams from ATLAS are designed tocover more ground than the first ICESat’s GLAS instrument,which used only a single beam. The six beams are arranged inthree pairs, designed to allow scientists to gauge the slope, orgradient, of the terrain in one pass. With its incredibly fastpulse rate, ATLAS can take measurements every 2.3 feet (70centimeters) along the satellite’s ground path. The footprint ofeach pulse is 56 feet (17 meters ) in diameter. In comparison,GLAS took measurements every 170 meters.About 300 trillion photons leave ATLAS with each pulse;only about a dozen from each beam are detected uponreturning to the satellite’s beryllium telescope. To ensure thatthe telescope is aligned to catch those returning photons,ATLAS engineers have designed and built a Laser ReferenceSystem. This system picks up a fraction of the laser lightPhoto credit: NASA[Left] ICESat-2’s laser beam has to make several turns as it travels throughATLAS, as seen in this illustrated image. Shown here, the pulses of lighttravel through a series of lenses and mirrors before beaming to the ground.This pathway along the optical bench serves to start the stopwatch on thetiming mechanism, check the laser’s wavelength, set the size of the groundfootprint, ensure that the laser and the telescope are perfectly aligned, andsplit the laser into six beams, divided into three pairs.Laser wavelength:532 nanometers14DoorTransmitted pulse width:1.5 nanosecondsPulse repetition rate:10 kilohertz
Coverage from one pair ofATLAS laser beamsCoverage from asingle GLAS laserbeam90 mCredit: NASA70 m[Above] The high-frequency laser on ATLAS allows for nearly continuous coverage under its orbit. If it flew over a football field, the GLAS instrument on the firstICESat would have taken a measurement in each end zone (two red circles); ATLAS will take measurements within each yard line (green circles). ATLAS also createsa tighter footprint than GLAS did, providing more certainty of where on Earth’s surface the photons are reflecting off of. And while GLAS had one laser beam, ATLASwill have three pairs of beams, or six beams total—which means at the same time two laser beams are collecting data on one field, the other two pairs of beamscan gather data on two parallel football fields 2.1 miles (3.3 kilometers) apart.before it leaves the satellite to check the aim. If it’s notaligned, ATLAS can steer the laser to correct it.The photons that return to the ATLAS telescope are focusedon six fiber optic cables that correspond with where the sixlaser beams will return. From those fibers, the photons passthrough a series of filters, which only let through light thatis at precisely 532 nanometers. When an individual photonmakes it through the filters, it triggers a detector and its timeis recorded. ATLAS can measure the time of flight of a photonto within 800 picoseconds (0.0000000008 seconds).Slope Versus Elevation ChangeScientists analyzing data from the original ICESat mission were faced with a problem. As the satellite mademultiple passes over an area, it was difficult to tell whether the ice had melted over time, or if the laser beam wassimply pointed a bit off the path and down a hill. To be sure, they had to gather data on a particular site severaltimes to first estimate the slope and then estimate ice loss.ICESat-2 can determine the slope across the laser’s path on a single pass. The updated satellite uses pairs ofbeams that straddle the reference ground track. Then, on subsequent passes, even if the two beams end upslightly upslope or downslope from where they were on the first pass, scientists can use the ground track tocalculate elevation change.Number of beams:6 beams, organized in 3 pairsBeam spacing (across track):295 feet (90 m) within pairs, 2.1 miles(3.2 km) separating the pairsCredit: NASA[Right] This image depicts how one pair of laser beams willtrack on Earth as ICESat-2 passes overhead. The red linedenotes the reference ground track, while the two orangelines represent ICESat-2’s first pass and the two yellowlines represent beams from a later pass. Each time ATLAScollects data along a particular track, onboard software aimsthe laser beams so that the reference ground track is alwaysbetween the two beams, as shown in the image at right.This allows scientists to combine the elevation and slopeinformation from two different passes to determine elevationchange along the same reference ground track.Illuminated spot diameter: 57.4 feet (17.5 meters)Telescope aperture diameter:2.6 feet (0.8 meters)15
elevation with the required precision; therefore, hundreds ofdata points, averaged over different intervals, are needed.The number of data points collected over a given area willdetermine how precise the elevation measurements will be fora particular area. With more data points collected, the dataanalyzing software can better identify the surface. For example,over large areas such as the Greenland and Antarctic icesheets, ICESat-2 will gather enough data points to estimatethe annual elevation change within 0.16 inches (4 millimeters).Photo credit: NASAThe time-tagged data about each returned photon iscommunicated to the electronics and communication systemon ICESat-2’s spacecraft, before the data are sent to a groundstation. Computer programs can use that travel time, laserpointing direction, and precise satellite position to determinethe distance the photon traveled and the height of thesurface. However, one data point isn’t sufficient to determinePhoto credit: NASAIce SheetCredit: NASAPhoto credit: Southeast Atmosphere StudySea IceForest[Above] Scientists will analyze ICESat-2’s data byplotting each photon that the satellite detects. Typicalexamples of these data plots, called photon clouds, areseen here for ice sheets [top], sea ice [middle], andvegetated areas [bottom]. For photon clouds over icesheets, the surface can clearly be seen by the denseaccumulation of photons. The “random” photons fromall over the plot are indeed random and sporadic–these are photons from the Sun that naturally bounceoff Earth and make it to ICESat-2’s telescope and pastthe filters. To extract the surface height of more variedterrain with great confidence, scientists use computerReceiver field of view diameter:139 feet (42.5 meters)16programs to analyze the data. On the graphic’s righthand side are plots of the photon density (histograms)for the photons between the two red lines. Over seaice, researchers will calculate the height of the iceitself (red lines) as well as for the adjacent open water(green lines), so that we can calculate the portion ofthe sea ice that is above sea level. The photon cloudis more diffuse when measuring vegetation, but fromthe histogram researchers can detect the crown of thetree as well as the ground surface, which is the narrowpeak below the tree.Single photon time-of-flight precision:800 picoseconds
Over smaller areas, such as glaciers, the elevation estimates areless precise, because there are fewer data points.While detecting a dozen or so returning photons for eachlaser pulse, ATLAS will also detect a significant number ofbackground photons. These photons did not originate fromATLAS, but from reflected sunlight from Earth’s surface.Some may have exactly the same wavelength as the laser andthereby are allowed to pass through the filters. To isolatethe laser photons from reflected photons, scientists will usecomputer programs to create photon cloud graphs, showingthousands of data points. By applying additional computerprograms, which identify stronger signals within the photoncloud graphs, scientists can determine the elevation of Earth’sice, land, water, and vegetation.ICESat-2’s laser instrument will measure the elevation ofice sheets, glaciers, sea ice, vegetation, fresh water, theCredit: ICESat-2/Savannah College of Art and Design (SCAD) collaborationocean, and land surfaces in unprecedented detail.17
Algorithm and Data ProductDevelopmentPhoto credit: NASABefore ICESat-2 ever reaches orbit,scientists conduct airborne campaigns tolearn how to interpret the satellite data ofice sheets, glaciers, and sea ice.[Above] A laser instrument was flown aboard NASA’s ER-2 plane in multiple campaigns to simulate the type of datacollected by ICESat-2.Once data start streaming down fromICESat-2, scientists want to be ready to analyzethe information. Before launch, the missiondeveloped the computer programs that willanalyze and interpret the elevation data pointsfrom the satellite, with the help of airbornecampaigns that fly similar instruments thatgather similar types of data. In order to do so,they conducted multiple airborne campaignswith similar instruments to figure out how tointerpret elevation data from the satellite.Photo credit: NASAThe Multiple Altimeter Beam ExperimentalLidar (MABEL) instrument has been flown on18three scientific campaigns
Ice is being lost across the globe, especially in the polar regions. The continental ice sheets of Greenland and Antarctica are shedding ice to the oceans and raising sea level. Arctic sea ice is less than half its 1980s volume. Fundamentally changing the Arctic, this ice loss may also be affecting North American and global weather.