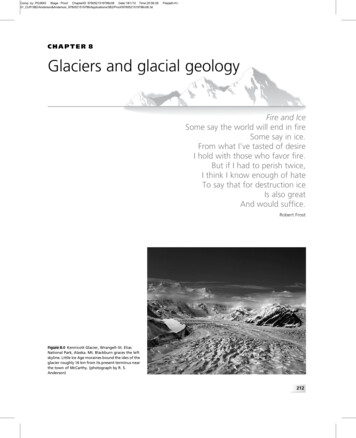
Transcription
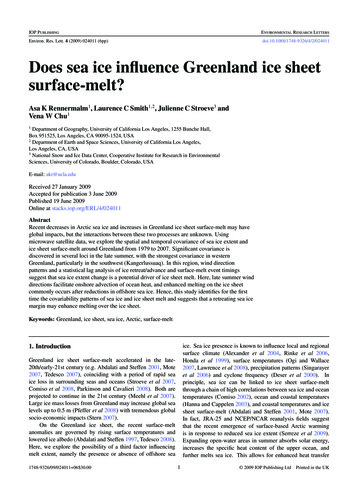
IOP PUBLISHINGENVIRONMENTAL RESEARCH LETTERSEnviron. Res. Lett. 4 (2009) 024011 (6pp)doi:10.1088/1748-9326/4/2/024011Does sea ice influence Greenland ice sheetsurface-melt?Asa K Rennermalm1, Laurence C Smith1,2 , Julienne C Stroeve3 andVena W Chu11Department of Geography, University of California Los Angeles, 1255 Bunche Hall,Box 951525, Los Angeles, CA 90095-1524, USA2Department of Earth and Space Sciences, University of California Los Angeles,Los Angeles, CA, USA3National Snow and Ice Data Center, Cooperative Institute for Research in EnvironmentalSciences, University of Colorado, Boulder, Colorado, USAE-mail: akr@ucla.eduReceived 27 January 2009Accepted for publication 3 June 2009Published 19 June 2009Online at stacks.iop.org/ERL/4/024011AbstractRecent decreases in Arctic sea ice and increases in Greenland ice sheet surface-melt may haveglobal impacts, but the interactions between these two processes are unknown. Usingmicrowave satellite data, we explore the spatial and temporal covariance of sea ice extent andice sheet surface-melt around Greenland from 1979 to 2007. Significant covariance isdiscovered in several loci in the late summer, with the strongest covariance in westernGreenland, particularly in the southwest (Kangerlussuaq). In this region, wind directionpatterns and a statistical lag analysis of ice retreat/advance and surface-melt event timingssuggest that sea ice extent change is a potential driver of ice sheet melt. Here, late summer winddirections facilitate onshore advection of ocean heat, and enhanced melting on the ice sheetcommonly occurs after reductions in offshore sea ice. Hence, this study identifies for the firsttime the covariability patterns of sea ice and ice sheet melt and suggests that a retreating sea icemargin may enhance melting over the ice sheet.Keywords: Greenland, ice sheet, sea ice, Arctic, surface-meltice. Sea ice presence is known to influence local and regionalsurface climate (Alexander et al 2004, Rinke et al 2006,Honda et al 1999), surface temperatures (Ogi and Wallace2007, Lawrence et al 2008), precipitation patterns (Singarayeret al 2006) and cyclone frequency (Deser et al 2000). Inprinciple, sea ice can be linked to ice sheet surface-meltthrough a chain of high correlations between sea ice and oceantemperatures (Comiso 2002), ocean and coastal temperatures(Hanna and Cappelen 2003), and coastal temperatures and icesheet surface-melt (Abdalati and Steffen 2001, Mote 2007).In fact, JRA-25 and NCEP/NCAR reanalysis fields suggestthat the recent emergence of surface-based Arctic warmingis in response to reduced sea ice extent (Serreze et al 2009).Expanding open-water areas in summer absorbs solar energy,increases the specific heat content of the upper ocean, andfurther melts sea ice. This allows for enhanced heat transfer1. IntroductionGreenland ice sheet surface-melt accelerated in the late20th/early-21st century (e.g. Abdalati and Steffen 2001, Mote2007, Tedesco 2007), coinciding with a period of rapid seaice loss in surrounding seas and oceans (Stroeve et al 2007,Comiso et al 2008, Parkinson and Cavalieri 2008). Both areprojected to continue in the 21st century (Meehl et al 2007).Large ice mass losses from Greenland may increase global sealevels up to 0.5 m (Pfeffer et al 2008) with tremendous globalsocio-economic impacts (Stern 2007).On the Greenland ice sheet, the recent surface-meltanomalies are governed by rising surface temperatures andlowered ice albedo (Abdalati and Steffen 1997, Tedesco 2008).Here, we explore the possibility of a third factor influencingmelt extent, namely the presence or absence of offshore sea1748-9326/09/024011 06 30.001 2009 IOP Publishing Ltd Printed in the UK
Environ. Res. Lett. 4 (2009) 024011A K Rennermalm et alData analysis had two objectives: (1) to determinethe monthly covariability between each region’s respectivetime-series of offshore open-water extent and inland surfacemelt during the melting season from May to September,and (2) to quantify the frequency of surface-melt eventsfollowing/preceding open-water events, using daily data andvarious time lags.The covariability was quantified with correlation coefficients obtained from linear regression.Regions withsignificant correlations were identified by testing the nullhypothesis that the correlation was a result of random chanceusing a confidence level of α 0.05. However, because thelikelihood of finding significant relationships can be inflatedby the presence of autocorrelation and cross-correlation(Lettenmaier et al 1994, Gujarti 2003), two additionalstatistical tests were also performed. First, the influenceof autocorrelation was tested using the Durbin–Watson test(e.g. Gujarti 2003). Second, months in which the numberof regions with significant correlations could be due tocross-correlations were identified using the bootstrap testof Burn and Elnur (2002). The bootstrap test establishedthe expected number of regions with significant correlationsarising due to chance, but with cross-correlations preserved, ata given significance level α . If this number is less than thenumber of regions with significant correlations in the actualdata, the actual data is field significant at a significance levelof α . Hence, months with field significant data are likely to beunaffected by cross-correlation.The lag study examined if the relative timings betweenopen-water and surface-melt events support the notion thatoffshore ocean conditions can influence the ice sheet.Assuming similar response time to external forcing, strongexternal forcing should result in both surface-melt and openwater events occurring on the same day (i.e., zero timelag), whereas open-water extent forcing should favor meltevents after open-water events (i.e. positive time lag but nota negative one). We define an ‘event’ (meaning an expansionor contraction of surface-melt or open-water area) as theoccurrence of a sign change, exceeding one standard deviation,in the time-series derivatives in SSM/I data between 1988 and2007 (before 1988 the SSMR sensor provides only data everyother day). The melt event lags were determined in the periodbetween surface-melt onset and the time of maximum openwater expansion. The frequency of melt events occurring attime lags within 8 days of open-water events was determined.The result was tested against the null hypothesis that meltevents occur at random in relation to open-water events byemploying a permutation resample test (e.g. Hesterberg et al2006). Significance level is established as the correspondingpercentile of the test data.from the ocean to the atmosphere during autumn and winter,causing strongest warming in these seasons.Put simply, we hypothesize that reduced offshore seaice concentration, i.e. greater open-water fraction, warms theocean mixed layer and increases onshore advection of sensibleand turbulent heat fluxes, in turn raising air temperatures overthe ice sheet and the probability of surface-melt occurring.We explore this hypothesis for the Greenland ice sheetusing simultaneous passive microwave satellite observations ofsurrounding open-water extent and inland surface-melt extentfrom 1979 to 2007.2. Study area, data and methodsOur study area is the Greenland ice sheet and its surroundingoceans and seas, divided into 16 land and 16 ocean regions(figure 2). Between 62.5 N and 80 N we divided the studyarea into 2.5 meridional bands separated east–west along42 W, and with the ocean regions extending 20 grid cells( 500 km) outwards from the Greenland coast. One southernand one northern region cover the remaining land and oceanarea below 62.5 N and above 80 N, respectively.Temporal and spatial patterns in Greenland surfacemelt were obtained from the dataset of Abdalati (2007).This dataset is a binary classification of melt/no-meltdetermined with the cross-polarized gradient ratio algorithm(Abdalati and Steffen 1997) utilizing passive microwavebrightness temperatures measured by the scanning multichannel microwave radiometer (SMMR) and the special sensormicrowave/imager (SSM/I). Although active microwave data ismore sensitive to snow wetness (Nghiem et al 2001), passivemicrowave sensors have been operational for much longer andcapture Greenland melt anomalies quite well (Abdalati andSteffen 1997, Tedesco 2007). The dataset was processed toprovide daily and average monthly time-series between 1979and 2007 by calculating the areal extent of surface-melt withineach land region and interpolating any days with missing data.These data gaps primarily occurred before 1988, when thepassive microwave sensors collected data every other day.Temporal and spatial patterns in open-water extent werederived using the Goddard Space Flight Center (GSFC) iceconcentration dataset (Comiso 1999, updated 2008). Seaice concentration is determined with the bootstrap sea icealgorithm (Comiso et al 1997) utilizing the same passivemicrowave brightness temperatures from SMMR and SSM/Iused by Abdalati (2007). Summer sea ice concentrationsare typically underestimated by passive microwave sensors,for example due to melt pond formation (e.g. Comiso andKwok 1996). This uncertainty was reduced by using a binaryclassification of each ocean grid cell as either ice-coveredor ice-free (e.g. Serreze et al 2003). The sea ice ‘edge’separating open-water from sea ice was defined as 15% sea iceconcentration, a widely used threshold value (e.g. Comiso et al1997). The dataset was processed to provide daily and averagemonthly time-series of open-water extent between 1979 and2007 by calculating the area of grid cells with less than 15%sea ice within each ocean region and interpolating any dayswith missing data similar to the surface-melt dataset.3. ResultsPosition of the mean sea ice edge sweeps progressivelynorthward, in concert with expanding ice sheet surface-meltarea, from May to July (figure 1). In southwest Greenland,open-water expansion into the Davis Strait is mirrored byinwards surface-melt expansion into the ice sheet. In August2
Environ. Res. Lett. 4 (2009) 024011A K Rennermalm et alFigure 1. Average monthly melt extent (red) and sea ice/open-water-extent (white/blue) in Greenland and surrounding ocean and seasbetween 1979 and 2007. The spatial monthly averages are defined as all grid cells with more than an average of 10% melting/seaice/open-water days in the month.Figure 2. The spatial distribution of correlation coefficients between average monthly ice sheet melt extent and offshore open-water extent(i.e. area of ocean grid cells with sea ice concentration less than 15%) within each of the 16 regions. The outlines of the regions and thecoastlines of Greenland and Ellesmere Island are shown for reference. Regions with significant correlations are demarked with a ‘*’, andregions with significant autocorrelation are demarked with a ‘–’. The largest number of significant correlations occurs in August, with thestrongest correlation in the Kangerlussuaq area (demarked with a ‘K’). None of the time-series in the regions with significant correlations hadsignificant autocorrelation.and September, the sea ice edge continues to migrate northwardwhile the inland surface-melt area contracts, leaving only athin coastal, fragmented band of surface-melt by September.In contrast to the relatively uniform zonal inwards expansionand contraction of surface-melt throughout the summer, thepattern of sea ice retreat differs for the east and west coastsof Greenland. While the eastern sea ice stays proximal to thecoast while retreating northwards, the western coastal areas arethe first to become ice-free as the sea ice edge moves northwestinto Davis Strait and Baffin Bay (figure 1).Monthly melt extent varies independently of open-waterextent except in seven of the sixteen regions during the monthof August (figure 2). Only then does the bootstrap test showthat the fraction of regions with significant trends ( p 0.05)is field significant at a confidence level of α 0.05, suggestingthat significant correlations in all other months are due tocross-correlation. Similarly, the Durbin–Watson test suggestssignificant autocorrelation in several time-series pairs, but nonein the August time-series pairs. Thus, both tests indicate thatthe high correlations cannot be due to cross- or autocorrelationin the month of August. High correlations could be a resultof errors in the passive microwave dataset used to determineboth open-water and melt extent, but this error is considerednegligible given the low correlation in most regions.In August, most regions on the west coast of Greenlanddisplay significant positive correlations between the twovariables, but the highest correlation is in the Kangerlussuaqregion (r 0.71) (demarked with a ‘K’ in figure 2). Forthis region three different observations suggest a link betweenopen-water fraction and ice sheet melt. First, ocean–landinteractions are facilitated by the presence of westerly windsduring the melting season suggesting favorable meteorologicalconditions for the advection of ocean air masses onto the icesheet open-water (figure 3(a)). In all months, northeasterlykatabatic winds flowing down the ice sheet interior dominate(45 from North), but in the melting season a second modewith westerly winds (270 from North) suggests a period ofocean–ice sheet interactions. Second, assuming that both seaice and melt extent respond with a similar time lag to externalforcing, the significant frequency of melt events occurring0–2 days after open-water events (figure 3(b)) suggests thatthe arrival of open-water offshore is able to contribute to thearrival of surface-melt on the ice sheet. Third, given the strongrelation between air temperature and surface mass balance3
Environ. Res. Lett. 4 (2009) 024011A K Rennermalm et ala)b)c)d)Figure 3. The relationship between open-water fraction and melt extent examined for the Kangerlussuaq region, the region with the highestcorrelation: (a) the distribution of sub-daily observed wind directions at the Kangerlussuaq meteorological station for each month between1980 and 2008, (b) the frequency of melt events lagging open-water events derived from daily data, and the 99th percentile of the randomizeddata corresponding to the 99% confidence level, (c) time-series of average monthly melt extent and in situ air temperature from theKangerlussuaq meteorological station, (d) time-series of average monthly melt and open-water extent. The Kangerlussuaq meteorologicalstation is situated on land between the ocean and the ice sheet (67.017 N, 50.70 E) (data available at: National Climatic Data . De Woul and Hock 2005), melt extent is likely a goodmeasure of ice sheet surface mass balance, as indicated bythe strong linear relation between melt extent and in situ airtemperature (figure 3(c)). The potential sea ice influenceon melt is strongest before 1999, thereafter the open-waterfraction reaches its near maximum every year (figure 3(d)).sea ice retreat. In contrast to the east coast, the west coastice retreats westward into the Davis Strait leaving a growingnear-shore open-water area, allowing for more solar heatingin expanding open-water areas and ocean warming in closeproximity to the ice sheet (figure 1).The strongest covariability between open-water and meltextent occurs in the Kangerlussuaq region in August, thelatter part of the melting season. Prevalence of a positivetime lag between melt and open-water suggests that openwater enhances ice sheet melt in this area (figure 3(b)).Other factors also explain why this relationship is strongestin the late melting season. First, the late melting seasongenerally has warmer ocean temperatures (World Ocean AtlasWorld Oceanographic Database 1998). Second, the arrivalof westerly winds (figure 3(a)) allows advection of oceanheat onto the ice sheet potentially enhancing ice sheet melt.Third, while a strong relationship between late summer airtemperature and surface-melt may not hold universally, it doesso in the Kangerlussuaq region (figure 3(c)). Fourth, icesheet albedo typically decreases during the melting season(Stroeve et al 2001), making the ice sheet more susceptibleto late season melting. Finally, declining ocean heat flux4. DiscussionOpen-water and ice sheet surface-melt covariability issignificant in seven of sixteen regions in the month of August,with most of these regions located on the west coast. Relativeto northern and southern Greenland, the western and easternparts of Greenland have a higher probability of occurrence ofseasonal sea ice (Kinnard et al 2008) at the time of year whenthe ice sheet surface is most susceptible to melting. Thus,the western and eastern parts are more likely to experiencesimultaneous variability in both sea ice and surface-melt,facilitating a higher correlation between the two variables.Relative to Greenland’s east coast, the west coast interactionsbetween the ocean and the land are helped by: (1) gentletopographic slopes (Bamber et al 2001) and (2) the nature of4
Environ. Res. Lett. 4 (2009) 024011A K Rennermalm et al(Perovich and Elder 2002), and the possibility of ocean toatmosphere heat transfer (Steele et al 2008) may increase therelative importance of heat advected from the ocean in the latesummer/fall.This study suggests that the sea ice retreat can enhancesurface-melting on the Greenland ice sheet, especially insouthwestern Greenland during late summer. Future workshould assess the importance of sea ice in controlling solarheating of ocean surface water, local weather patterns and thevalidity of the assumption of identical response time of openwater and melt area to changes in external forcings. Regardlessof how the mechanism of open-water influence on ice sheetmelt takes place, if model predictions of a northwards seaice edge retreat in the 21st century are correct (Meehl et al2007), the ice sheet region influenced by sea ice variabilitymight reasonably be expected to correspondingly migratenorthwards. North of the Kangerlussuaq area is the Jakobshavnice-stream, which accounts for 10% of current Greenlandmass losses (Rignot and Kanagaratnam 2006). Althoughsurface-melt is an insignificant driver of the Jakobshavnice-stream’s present-day discharge variability (Joughin et al2008), future increased sensitivity in combination withenhanced surface-melt may further increase the discharge fromJakobshavn ice-stream.De Woul M and Hock R 2005 Static mass-balance sensitivity ofArctic glaciers and ice caps using a degree-day approach Ann.Glaciol. 42 217–24Gujarti D N 2003 Basic Econometrics (New York, NY:McGraw-Hill/Irwin)Hanna E and Cappelen J 2003 Recent cooling in coastal southernGreenland and relation with the north Atlantic oscillationGeophys. Res. Lett. 30 1132Hesterberg T, Moore D S, Monaghan S, Clipson A andEpstein R 2006 Introduction to the Practice of Statistics 5thedn, ed D S Moore and G P Mccabe (New York: Freeman)chapter 14 (Bootstrap methods and permutation tests)Honda M, Yamazaki K, Nakamura H and Takeuchi K 1999 Dynamicand thermodynamic characteristics of atmospheric response toanomalous sea-ice extent in the Sea of Okhotsk J. Clim.12 3347–58Joughin I, Das S B, King M A, Smith B E, Howat I M andMoon T 2008 Seasonal speedup along the western flank of theGreenland Ice Sheet Science 320 781–3Kinnard C, Zdanowicz C M, Koerner R M and Fisher D A 2008 Achanging Arctic seasonal ice zone: observations from1870–2003 and possible oceanographic consequences Geophys.Res. Lett. 35 L02507Lawrence D M, Slater A G, Tomas R A, Holland M M andDeser C 2008 Accelerated Arctic land warming and permafrostdegradation during rapid sea ice loss Geophys. Res. Lett.35 L11506Lettenmaier D P, Wood E F and Wallis J R 1994Hydro-climatological trends in the continental United-States,1948–88 J. Clim. 7 586–607Meehl G A et al 2007 Global climate projections Climate Change2007: The Physical Science Basis. Contributions of WorkingGroup I to the Fourth Assessment Report of theIntergovernmental Panel on Climate Change ed S Solomon,D Qin, M Manning, Z Chen, M Marquis, K B Averyt,M Tignor and H L Miller (Cambridge: Cambridge UniversityPress)Mote T L 2007 Greenland surface melt trends 1973–2007: Evidenceof a large increase in 2007 Geophys. Res. Lett. 34 L22507Nghiem S V, Steffen K, Kwok R and Tsai W Y 2001 Detection ofsnowmelt regions on the Greenland ice sheet using diurnalbackscatter change J. Glaciol. 47 539–47Ogi M and Wallace J M 2007 Summer minimum Arctic sea iceextent and the associated summer atmospheric circulationGeophys. Res. Lett. 34 L12705Parkinson C L and Cavalieri D J 2008 Arctic sea ice variability andtrends, 1979–2006 J. Geophys. Res. 113 C07003Perovich D K and Elder B 2002 Estimates of ocean heat flux atSHEBA Geophys. Res. Lett. 29 1344Pfeffer W T, Harper J T and O’neel S 2008 Kinematic constraints onglacier contributions to 21st-century sea-level rise Science321 1340–3Rignot E and Kanagaratnam P 2006 Changes in the velocity structureof the Greenland ice sheet Science 311 986–90Rinke A, Maslowski W, Dethloff K and Clement J 2006 Influence ofsea ice on the atmosphere: a study with an Arctic atmosphericregional climate model J. Geophys. Res. 111 D16103Serreze M, Barrett A P, Stroeve J, Kindig D N and Holland M M2009 The emergence of surface-based Arctic amplificationCryosphere 3 11–19Serreze M C, Maslanik J A, Scambos T A, Fetterer F, Stroeve J,Knowles K, Fowler C, Drobot S, Barry R G and Haran T M2003 A record minimum arctic sea ice extent and area in 2002Geophys. Res. Lett. 30 1110Singarayer J S, Bamber J L and Valdes P J 2006 Twenty-first-centuryclimate impacts from a declining Arctic sea ice cover J. Clim.19 1109–25Steele M, Ermold W and Zhang J L 2008 Arctic Ocean surfacewarming trends over the past 100 years Geophys. Res. Lett.35 L02614AcknowledgmentsThis research was supported through funding provided by theNASA Cryospheric Sciences Program (Grant NNG05GN89G).ReferencesAbdalati W 2007 Greenland Ice Sheet Melt Characteristics Derivedfrom Passive Microwave Data (Boulder, CO: National Snowand Ice Data Center)Abdalati W and Steffen K 1997 Snowmelt on the Greenland ice sheetas derived from passive microwave satellite data J. Clim.10 165–75Abdalati W and Steffen K 2001 Greenland ice sheet melt extent:1979–1999 J. Geophys. Res. 106 33983–8Alexander M A, Bhatt U S, Walsh J E, Timlin M S, Miller J S andScott J D 2004 The atmospheric response to realistic Arctic seaice anomalies in an AGCM during winter J. Clim. 17 890–905Bamber J L, Ekholm S and Krabill W B 2001 A new, high-resolutiondigital elevation model of Greenland fully validated withairborne laser altimeter data J. Geophys. Res. 106 6733–45Burn D H and Elnur M A H 2002 Detection of hydrologic trends andvariability J. Hydrol. 255 107–22Comiso J 1999, updated 2008 Bootstrap Sea Ice Concentrations fromNIMBUS-7 SMMR and DMSP SSM/I, [1979–2007] (Boulder,CO: National Snow and Ice Data Center, Digital media)Comiso J C 2002 Correlation and trend studies of the sea-ice coverand surface temperatures in the Arctic Ann. Glaciol. 34 420–8Comiso J C, Cavalieri D J, Parkinson C L and Gloersen P 1997Passive microwave algorithms for sea ice concentration: acomparison of two techniques Remote Sens. Environ.60 357–84Comiso J C and Kwok R 1996 Surface and radiative characteristicsof the summer Arctic sea ice cover from multisensor satelliteobservations J. Geophys. Res. 101 28397–416Comiso J C, Parkinson C L, Gersten R and Stock L 2008 Accelerateddecline in the Arctic Sea ice cover Geophys. Res. Lett.35 L01703Deser C, Walsh J E and Timlin M S 2000 Arctic sea ice variability inthe context of recent atmospheric circulation trends J. Clim.13 617–335
Environ. Res. Lett. 4 (2009) 024011A K Rennermalm et alTedesco M 2007 Snowmelt detection over the Greenland ice sheetfrom SSM/I brightness temperature daily variations Geophys.Res. Lett. 34 L02504Tedesco M 2008 Diagnosing the extreme surface melt event oversouthwestern Greenland in 2007 Cryosphere 2 159–66World Oceanographic Database 1998 National Oceanographic DataCenter data provided by the NOAA/OAR/ESRL PSD, Boulder,CO, USA, from their website at http://www.cdc.noaa.gov/Stern N 2007 The Economics of Climate Change: The Stern Review(Cambridge: Cambridge University Press)Stroeve J, Serreze M, Drobot S, Gearhead S, Holland M, Maslanik J,Meier W and Scambos T 2007 Arctic sea ice extent plummetsin 2007 EOS, Trans. Am. Geophys. Union 89 13–4Stroeve J C, Box J E, Fowler C, Haran T and Key J 2001Intercomparison between in situ and AVHRR polarpathfinder-derived surface Albedo over Greenland Remote Sens.Environ. 75 360–746
Keywords: Greenland, ice sheet, sea ice, Arctic, surface-melt 1. Introduction Greenland ice sheet surface-melt accelerated in the late-20th/early-21st century (e.g. Abdalati and Steffen 2001,Mote 2007, Tedesco 2007), coinciding with a period of rapid sea ice loss in surrounding seas and oceans (Stroeve et al 2007, Comiso et al 2008, Parkinson .